Prompt and non-prompt J$/ψ$ production at midrapidity in Pb$-$Pb collisions at $\sqrt{s_{\mathrm{NN}}}$ = 5.02 TeV

The transverse momentum ($p_{\rm T}$) and centrality dependence of the nuclear modification factor $R_{\rm AA}$ of prompt and non-prompt J$/\psi$, the latter originating from the weak decays of beauty hadrons, have been measured by the ALICE collaboration in Pb$-$Pb collisions at $\sqrt{s_{\mathrm{NN}}}$ = 5.02 TeV. The measurements are carried out through the ${\rm e}^{+}{\rm e}^{-}$ decay channel at midrapidity ($|y| <~ 0.9$) in the transverse momentum region $1.5 <~ p_{\rm T} <~ 10$ GeV/$c$. Both prompt and non-prompt J$/\psi$ measurements indicate a significant suppression for $p_{\rm T} >$ 5 GeV/$c$, which becomes stronger with increasing collision centrality. The results are consistent with similar LHC measurements in the overlapping $p_{\rm T}$ intervals, and cover the kinematic region down to $p_{\rm T}$ = 1.5 GeV/$c$ at midrapidity, not accessible by other LHC experiments. The suppression of prompt J$/\psi$ in central and semicentral collisions exhibits a decreasing trend towards lower transverse momentum, described within uncertainties by models implementing J$/\psi$ production from recombination of c and $\overline{\rm c}$ quarks produced independently in different partonic scatterings. At high transverse momentum, transport models including quarkonium dissociation are able to describe the suppression for prompt J$/\psi$. For non-prompt J$/\psi$, the suppression predicted by models including both collisional and radiative processes for the computation of the beauty-quark energy loss inside the quark$-$gluon plasma is consistent with measurements within uncertainties.


JHEP 02 (2024) 066
HEP Data
e-Print: arXiv:2308.16125 | PDF | inSPIRE
CERN-EP-2023-190
Figure group

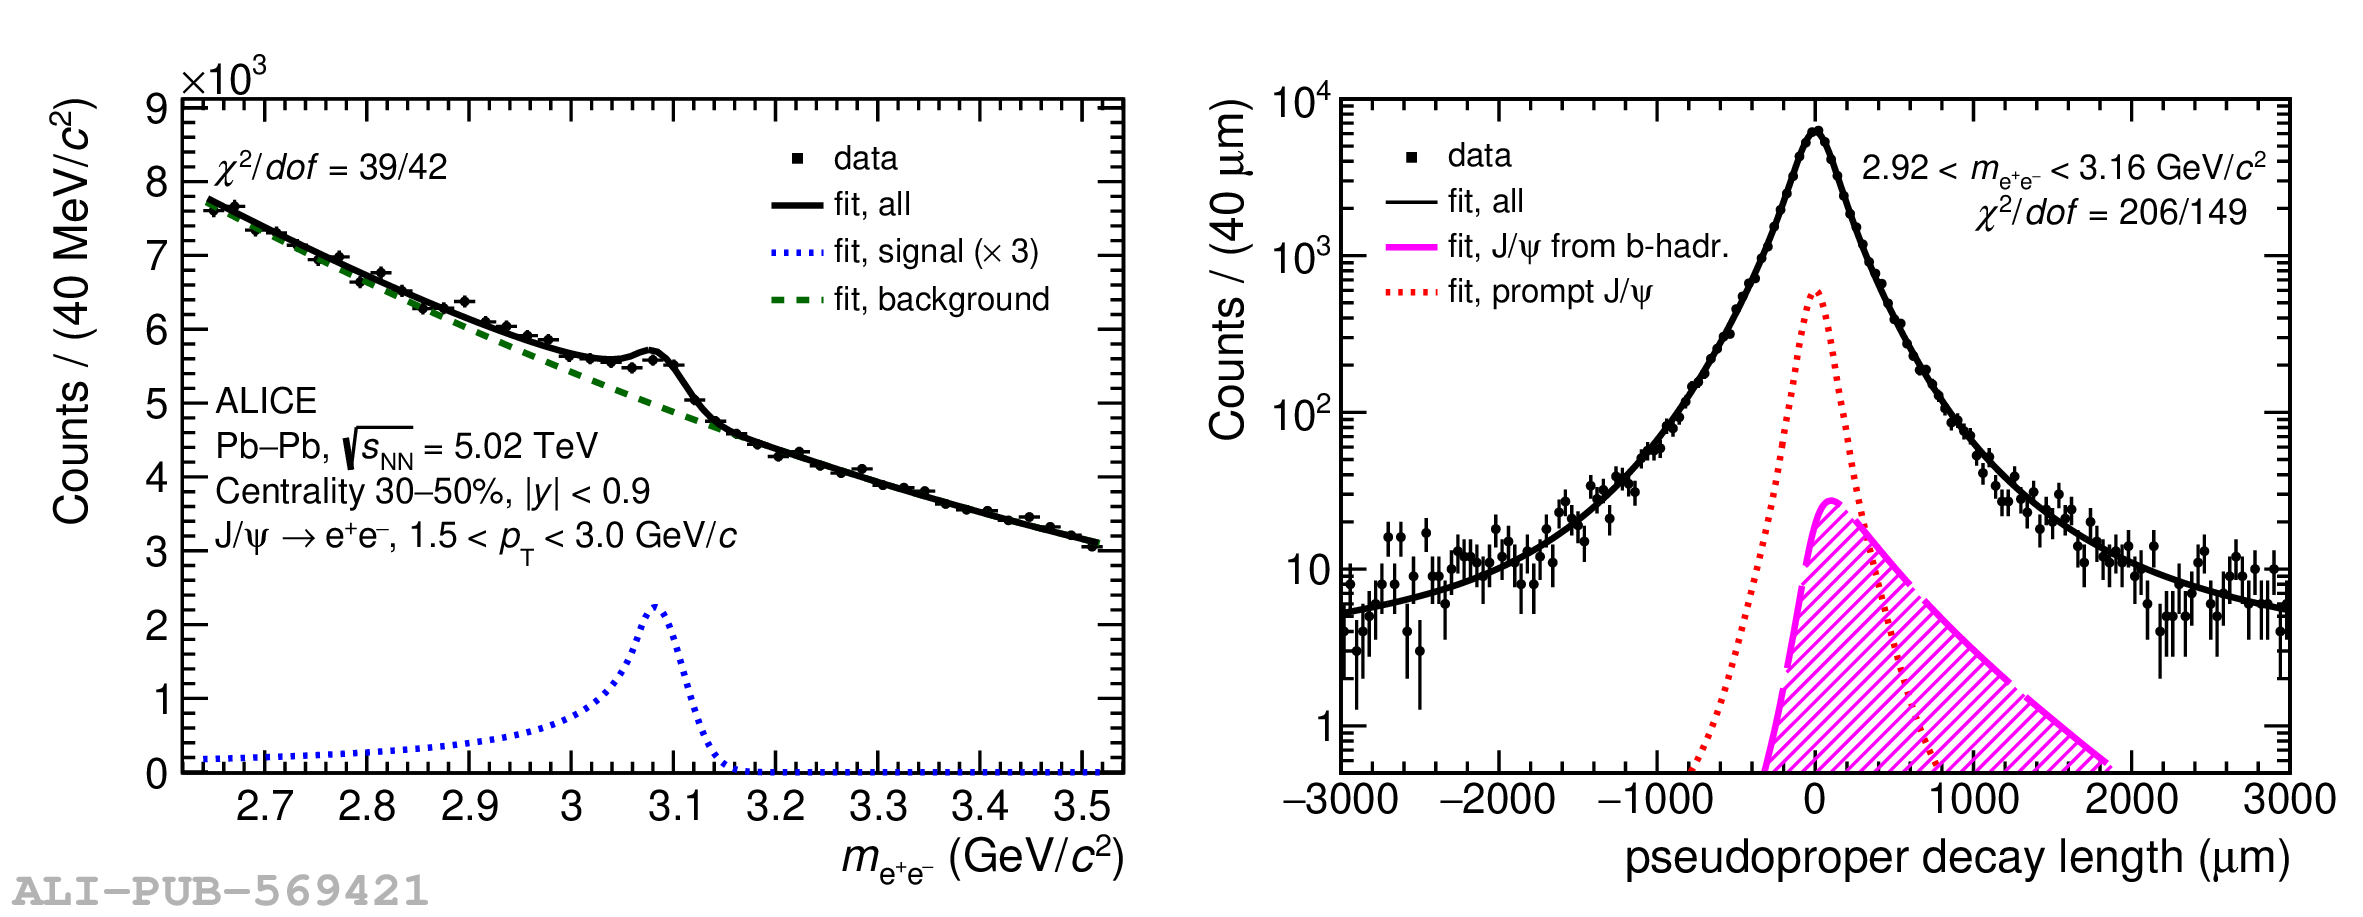
Figure 1

Invariant mass (left panel) and pseudoproper decay length (right panel) distributions of $\jpsi$ candidates with maximum likelihood fit projections superimposed. The distributions in the figures correspond to selected candidates with $1.5 < \pt < 3.0$ GeV/$c$ in the centrality class 30--50\%. The pseudoproper decay length distribution is shown for $\jpsi$ candidates reconstructed under the $\jpsi$ mass peak, i.e. for $2.92 < m_{\rm ee} < 3.16$ GeV/$c^{2}$, for display purposes only. The $\chi^{2}$ values, obtained by comparing the binned distributions of data points and the corresponding projections of the total fit function, are also reported.

Figure 2

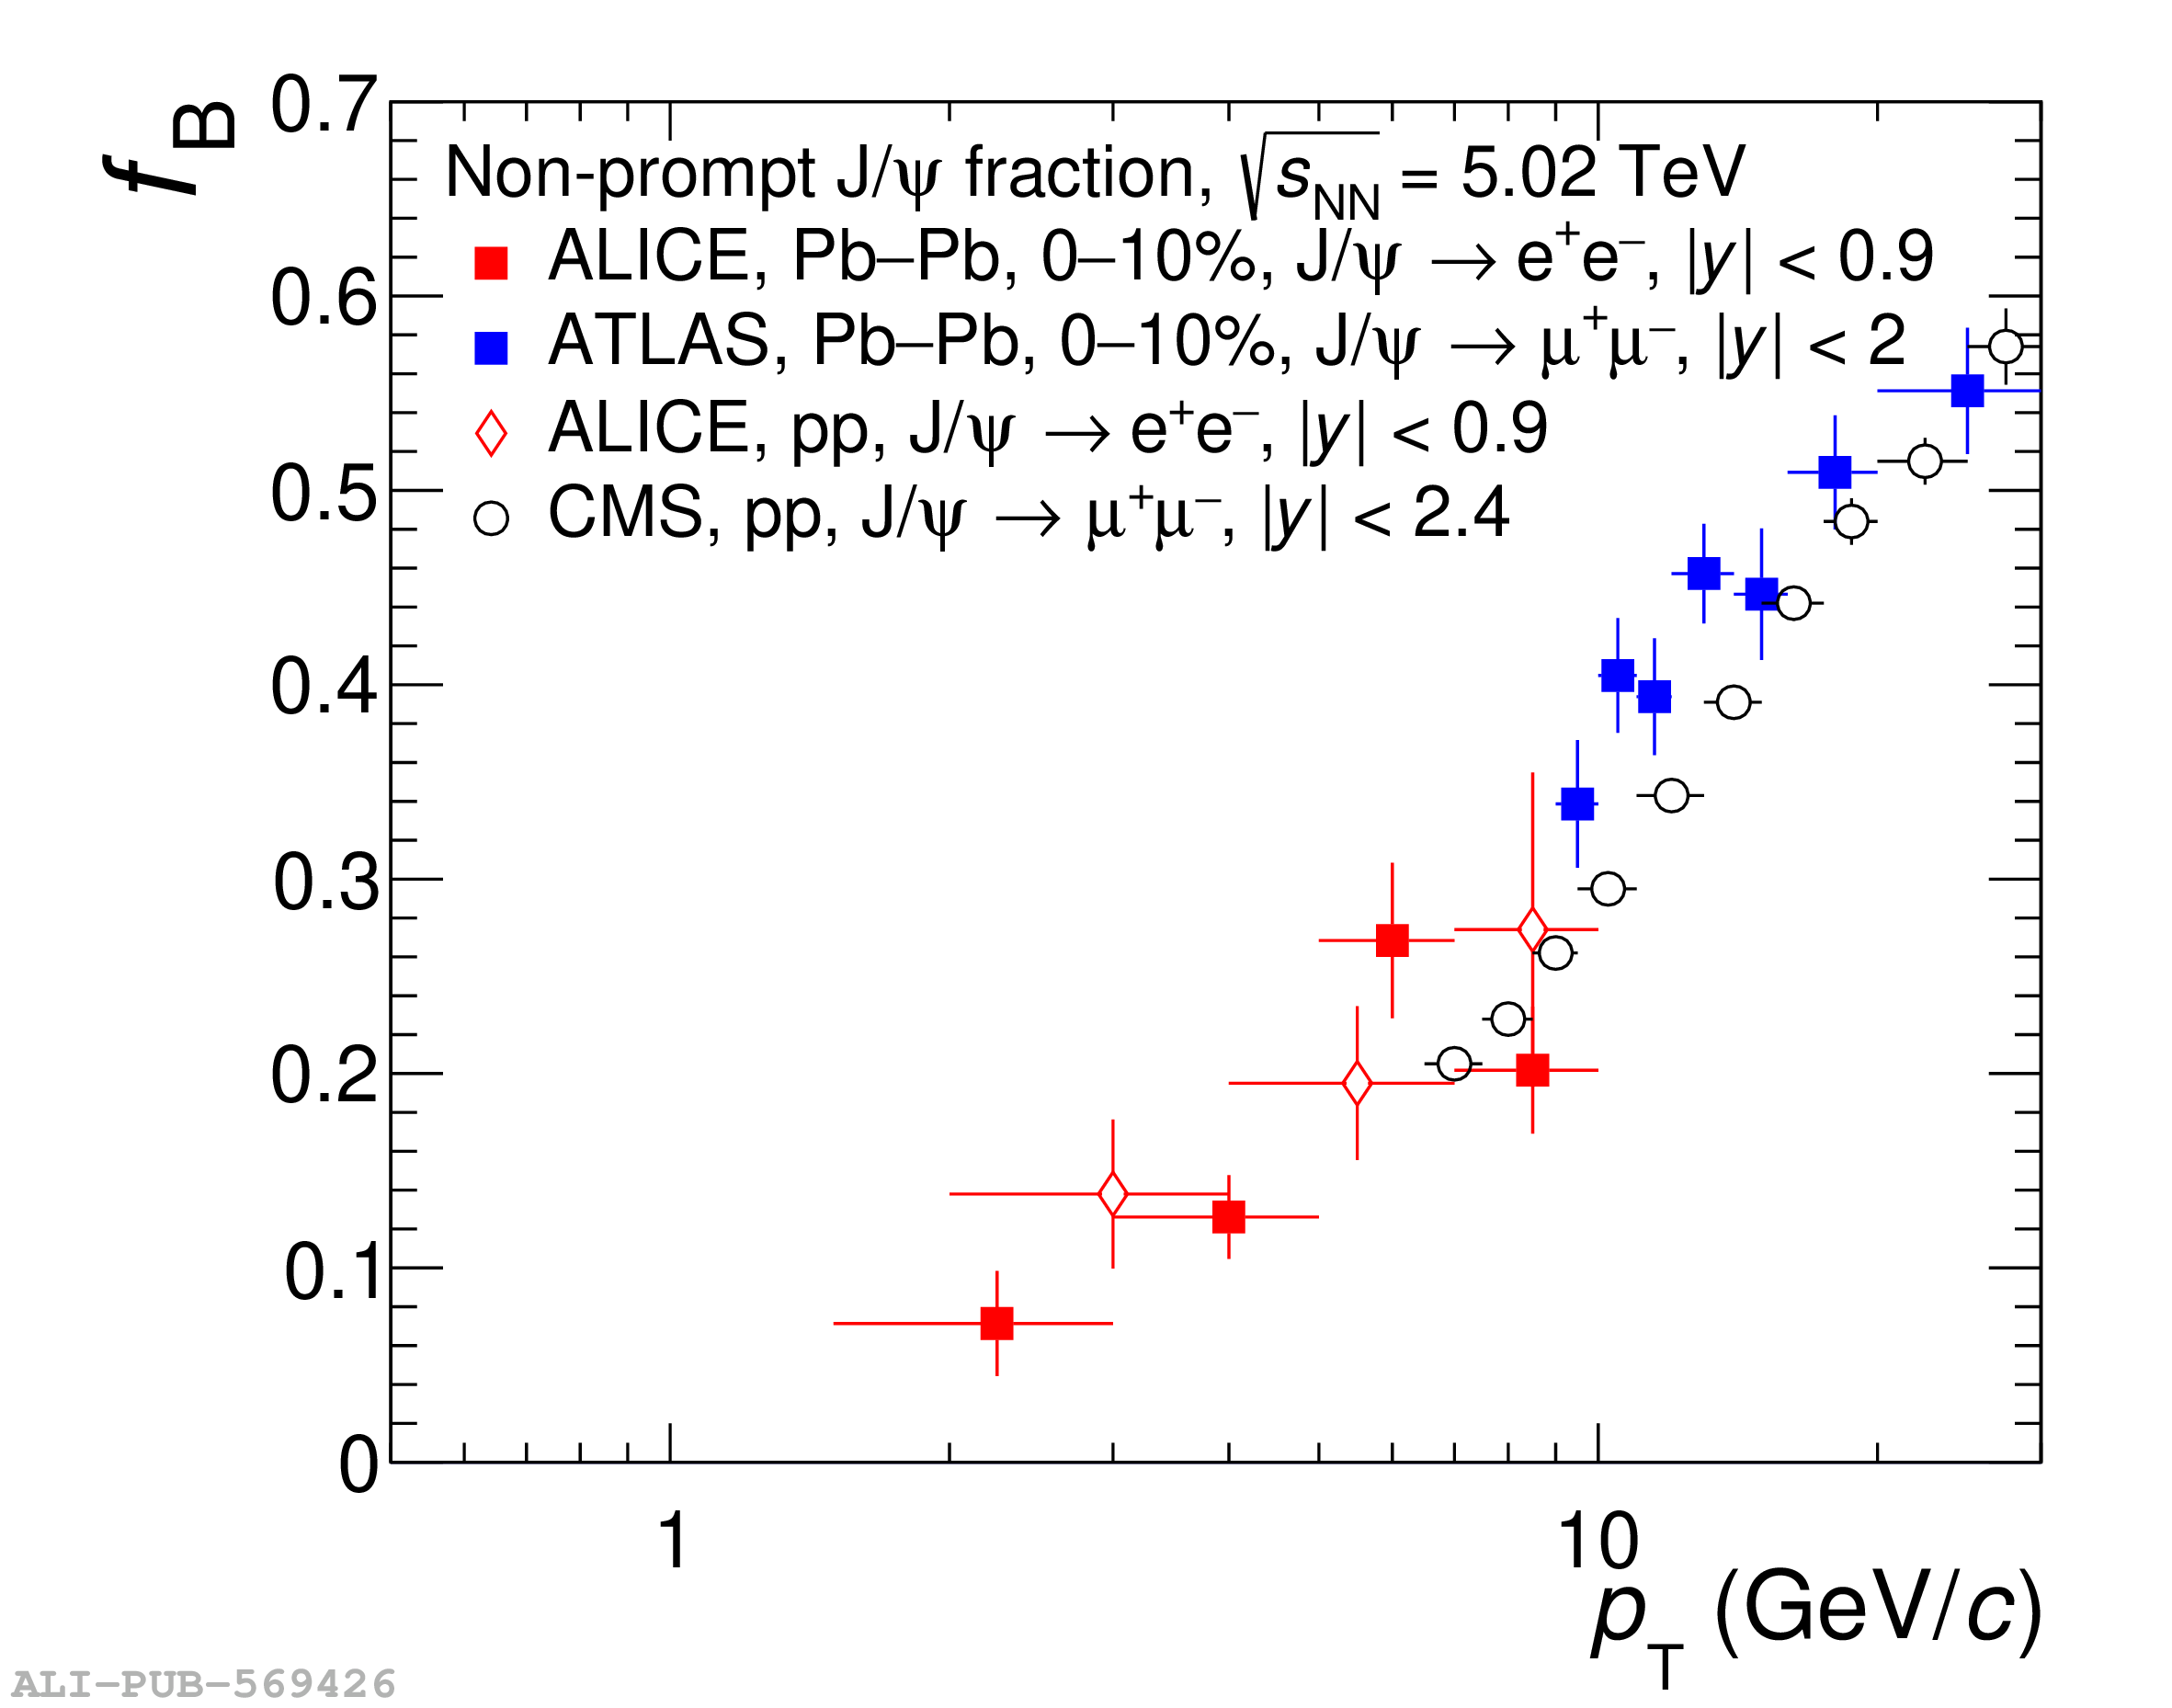
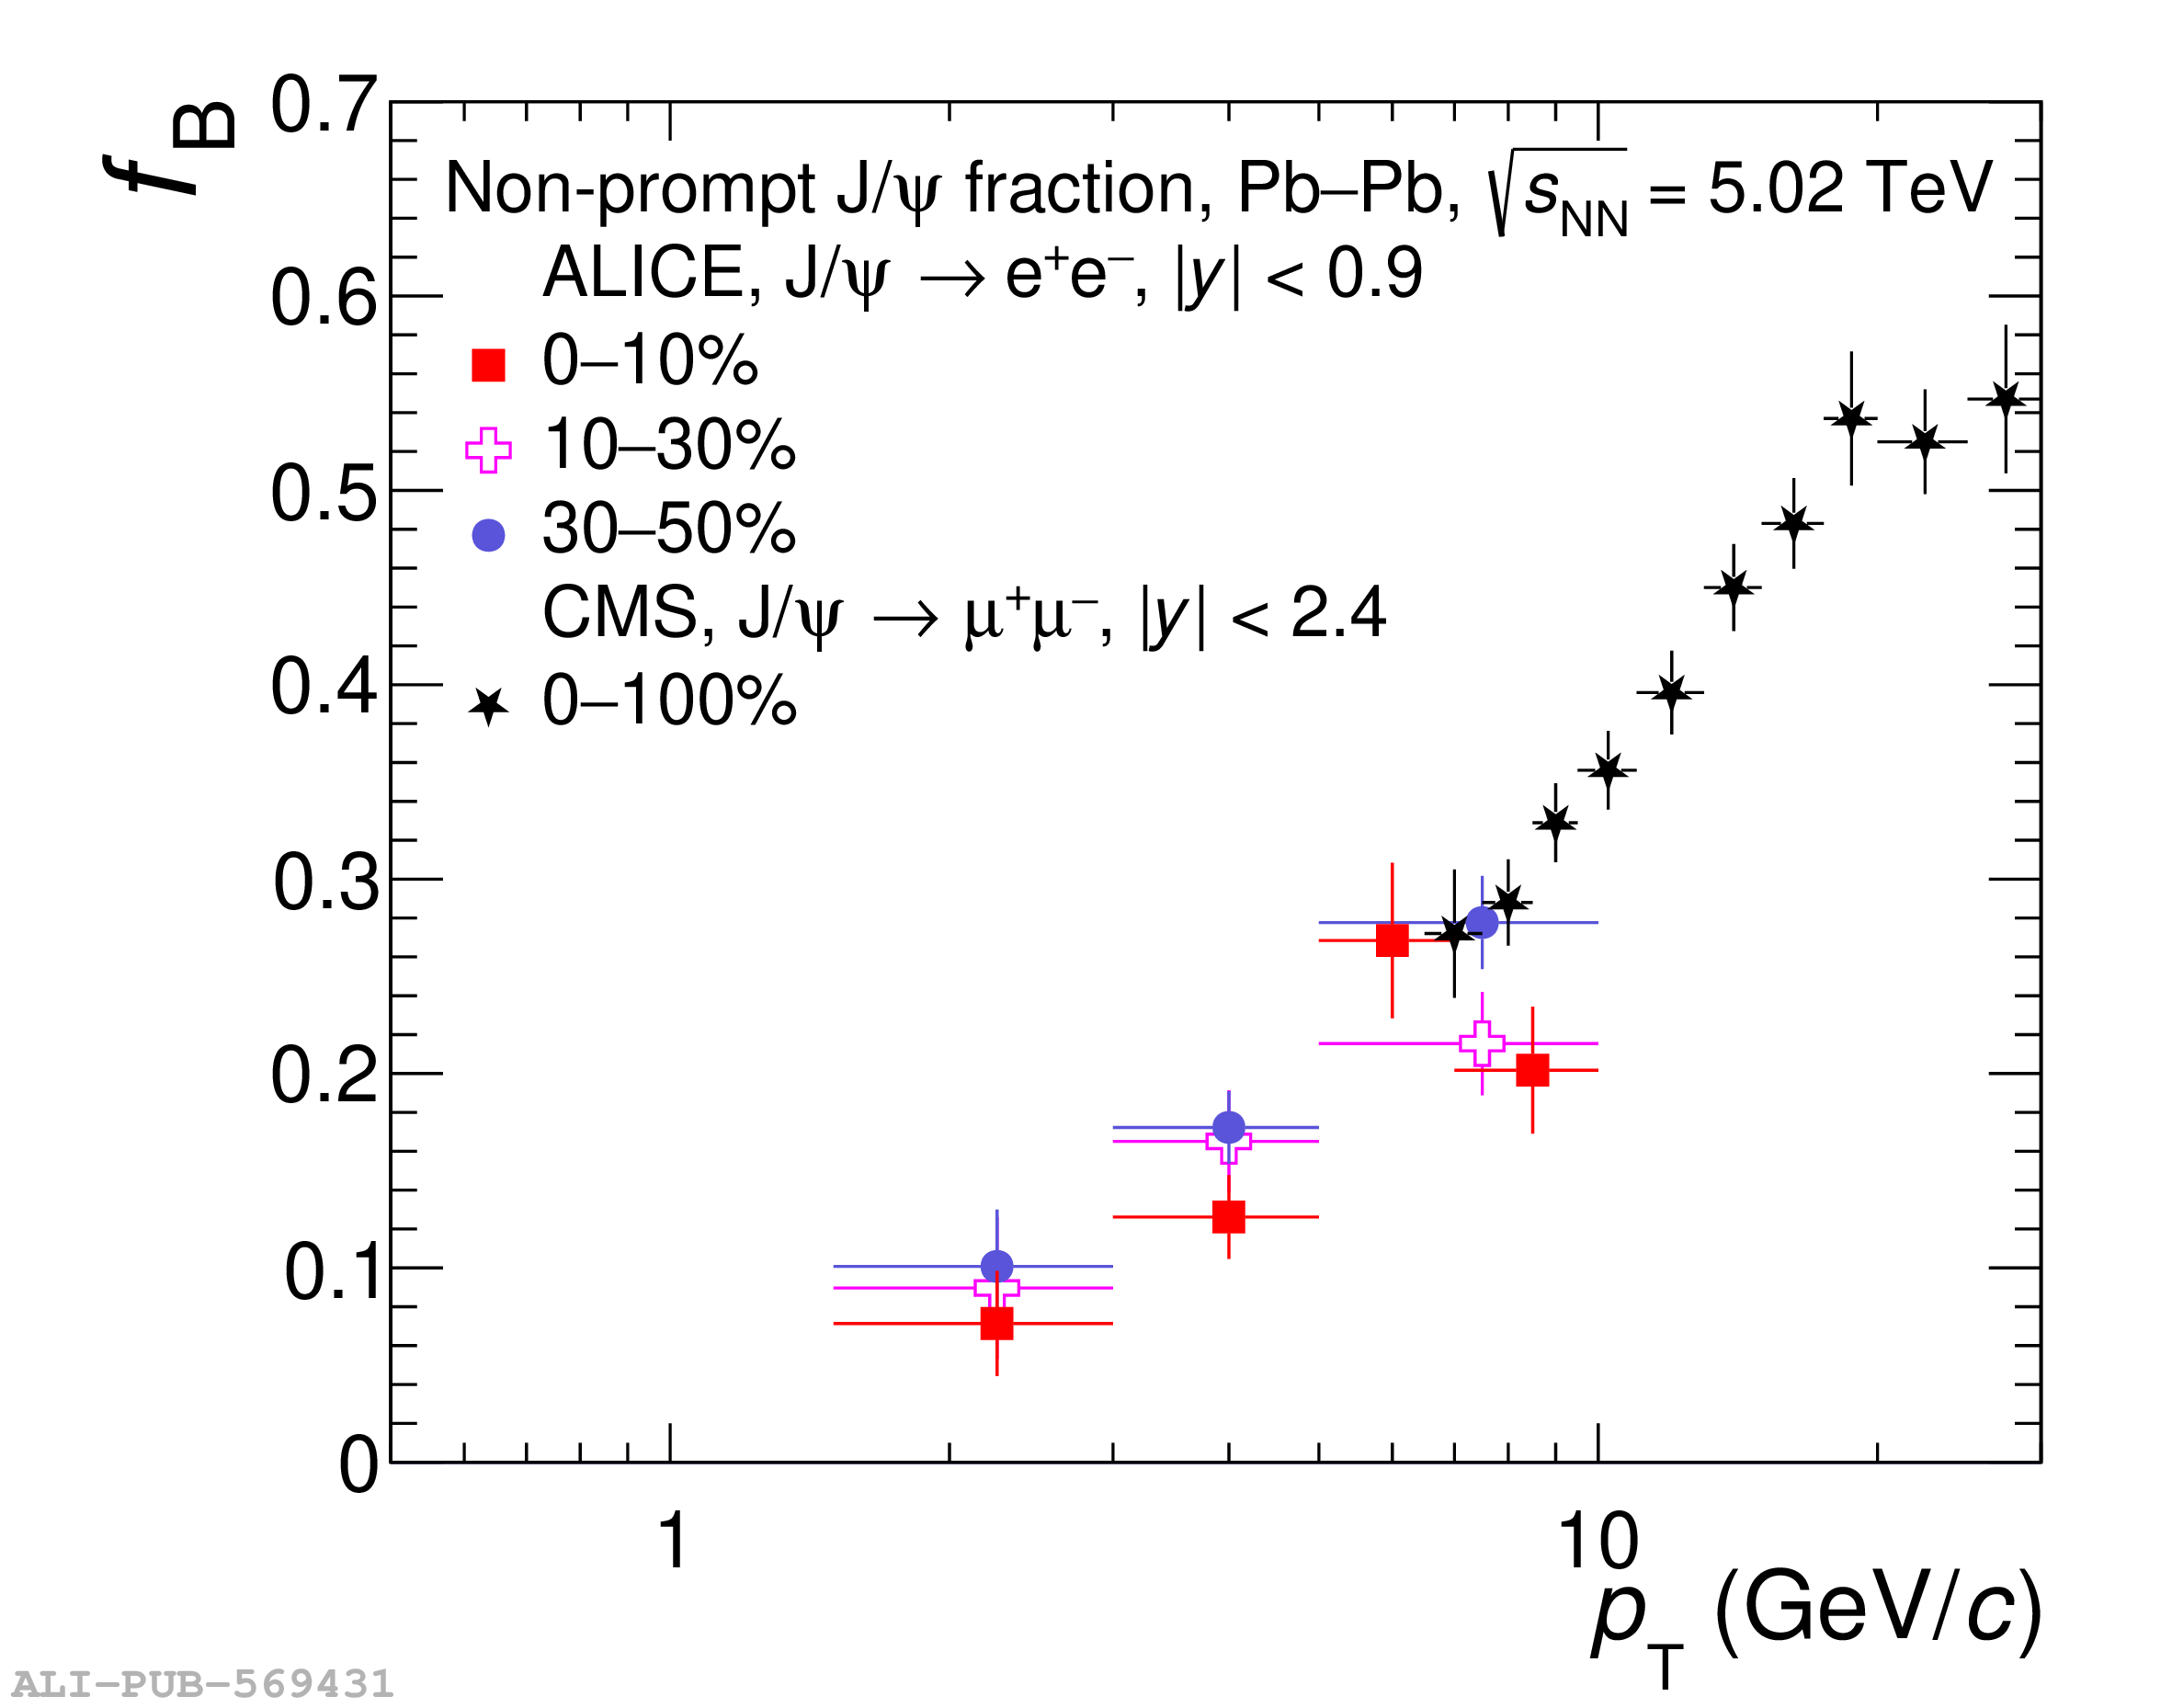
Non-prompt $\jpsi$ fraction as a function of transverse momentum measured by the ALICE collaboration in 0--10\% most central Pb--Pb collisions (left panel) and in all centrality classes (right panel). Results in the left panel are compared with ATLAS midrapidity measurements  in the centrality class 0--10\%, and with ALICE  and CMS  measurements in pp collisions at $\s$ = 5.02 TeV. The ALICE measurements in the right panel are compared with similar midrapidity measurements from CMS , performed in the centrality class 0--100\%. In both panels, the error bars represent the quadratic sum of statistical and systematic uncertainties.

Figure 3

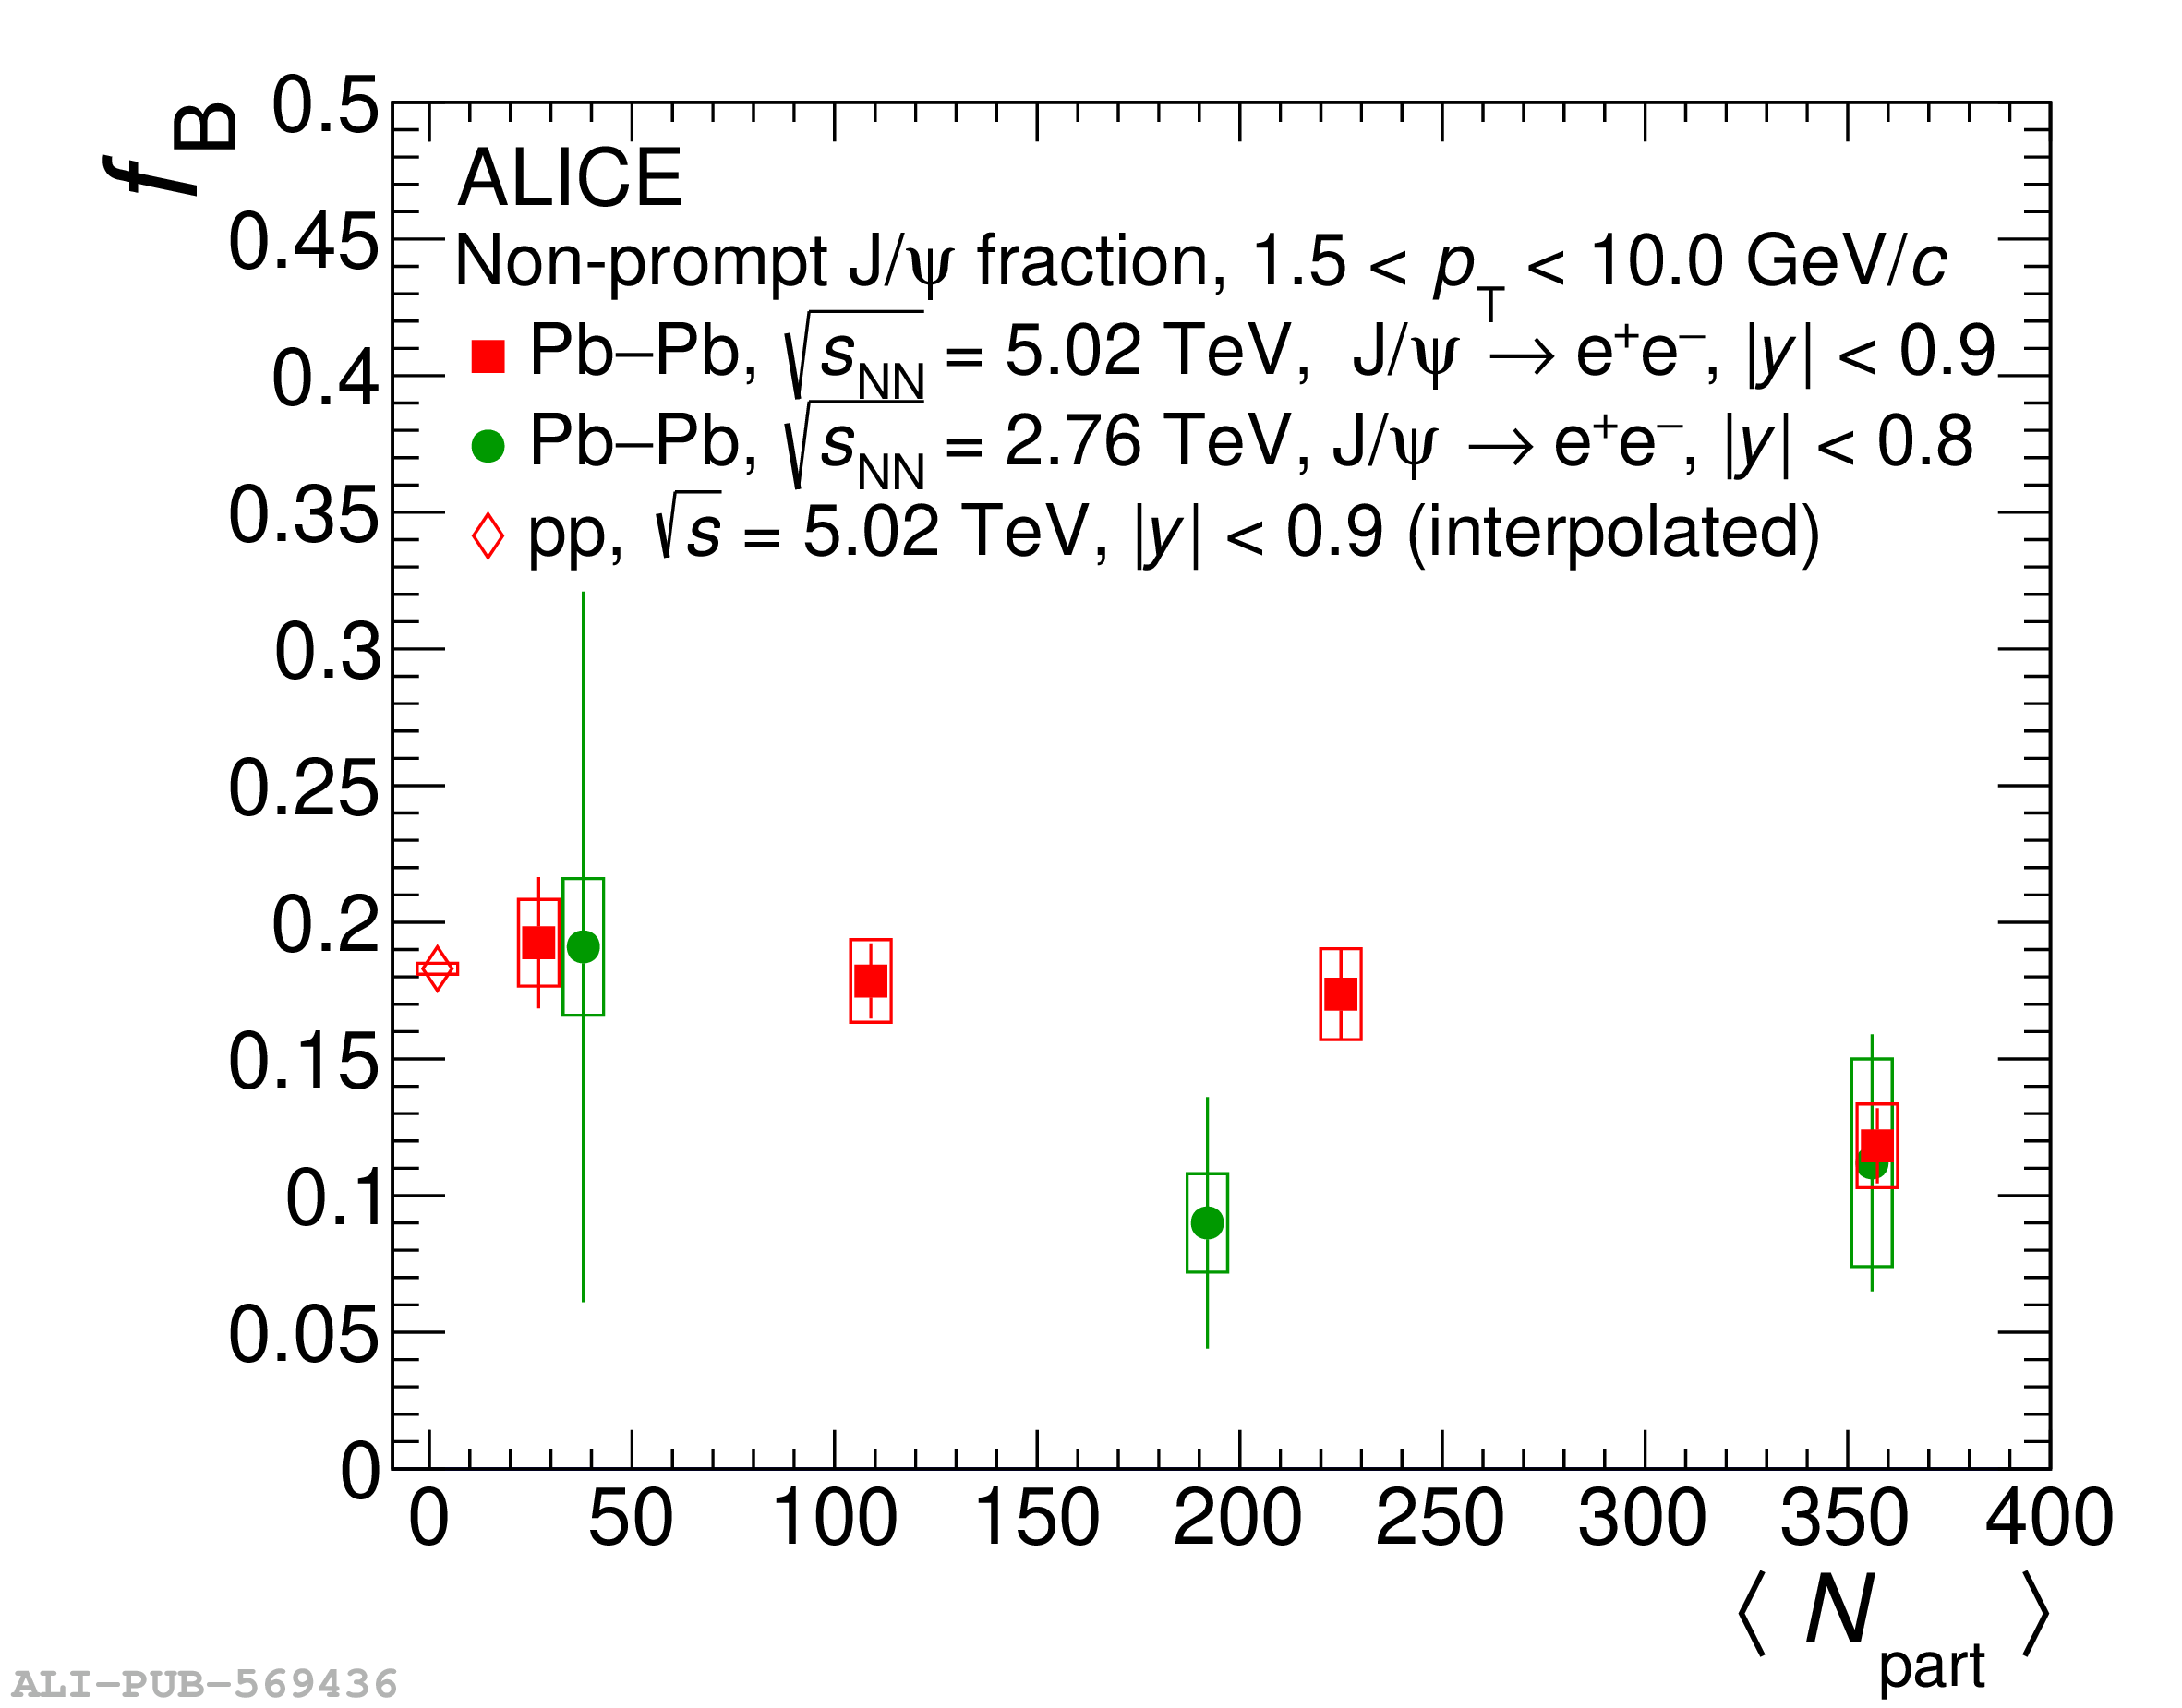
Centrality dependence (expressed in terms of average number of participants) of the non-prompt $\jpsi$ fraction measured by ALICE in Pb-Pb collisions at $\snn$ = 5.02 TeV in the transverse momentum interval 1.5 $< \pt <$ 10 GeV/$c$. Results are compared with previous ALICE measurements performed in Pb-Pb collisions at $\snn$ = 2.76 TeV . The $\pt$-integrated non-prompt $\jpsi$ fraction in pp collisions at $\s$ = 5.02 TeV obtained from an interpolation procedure (see text for details) is also shown. Statistical and systematic uncertainties are shown by error bars and boxes, respectively.

Figure 4

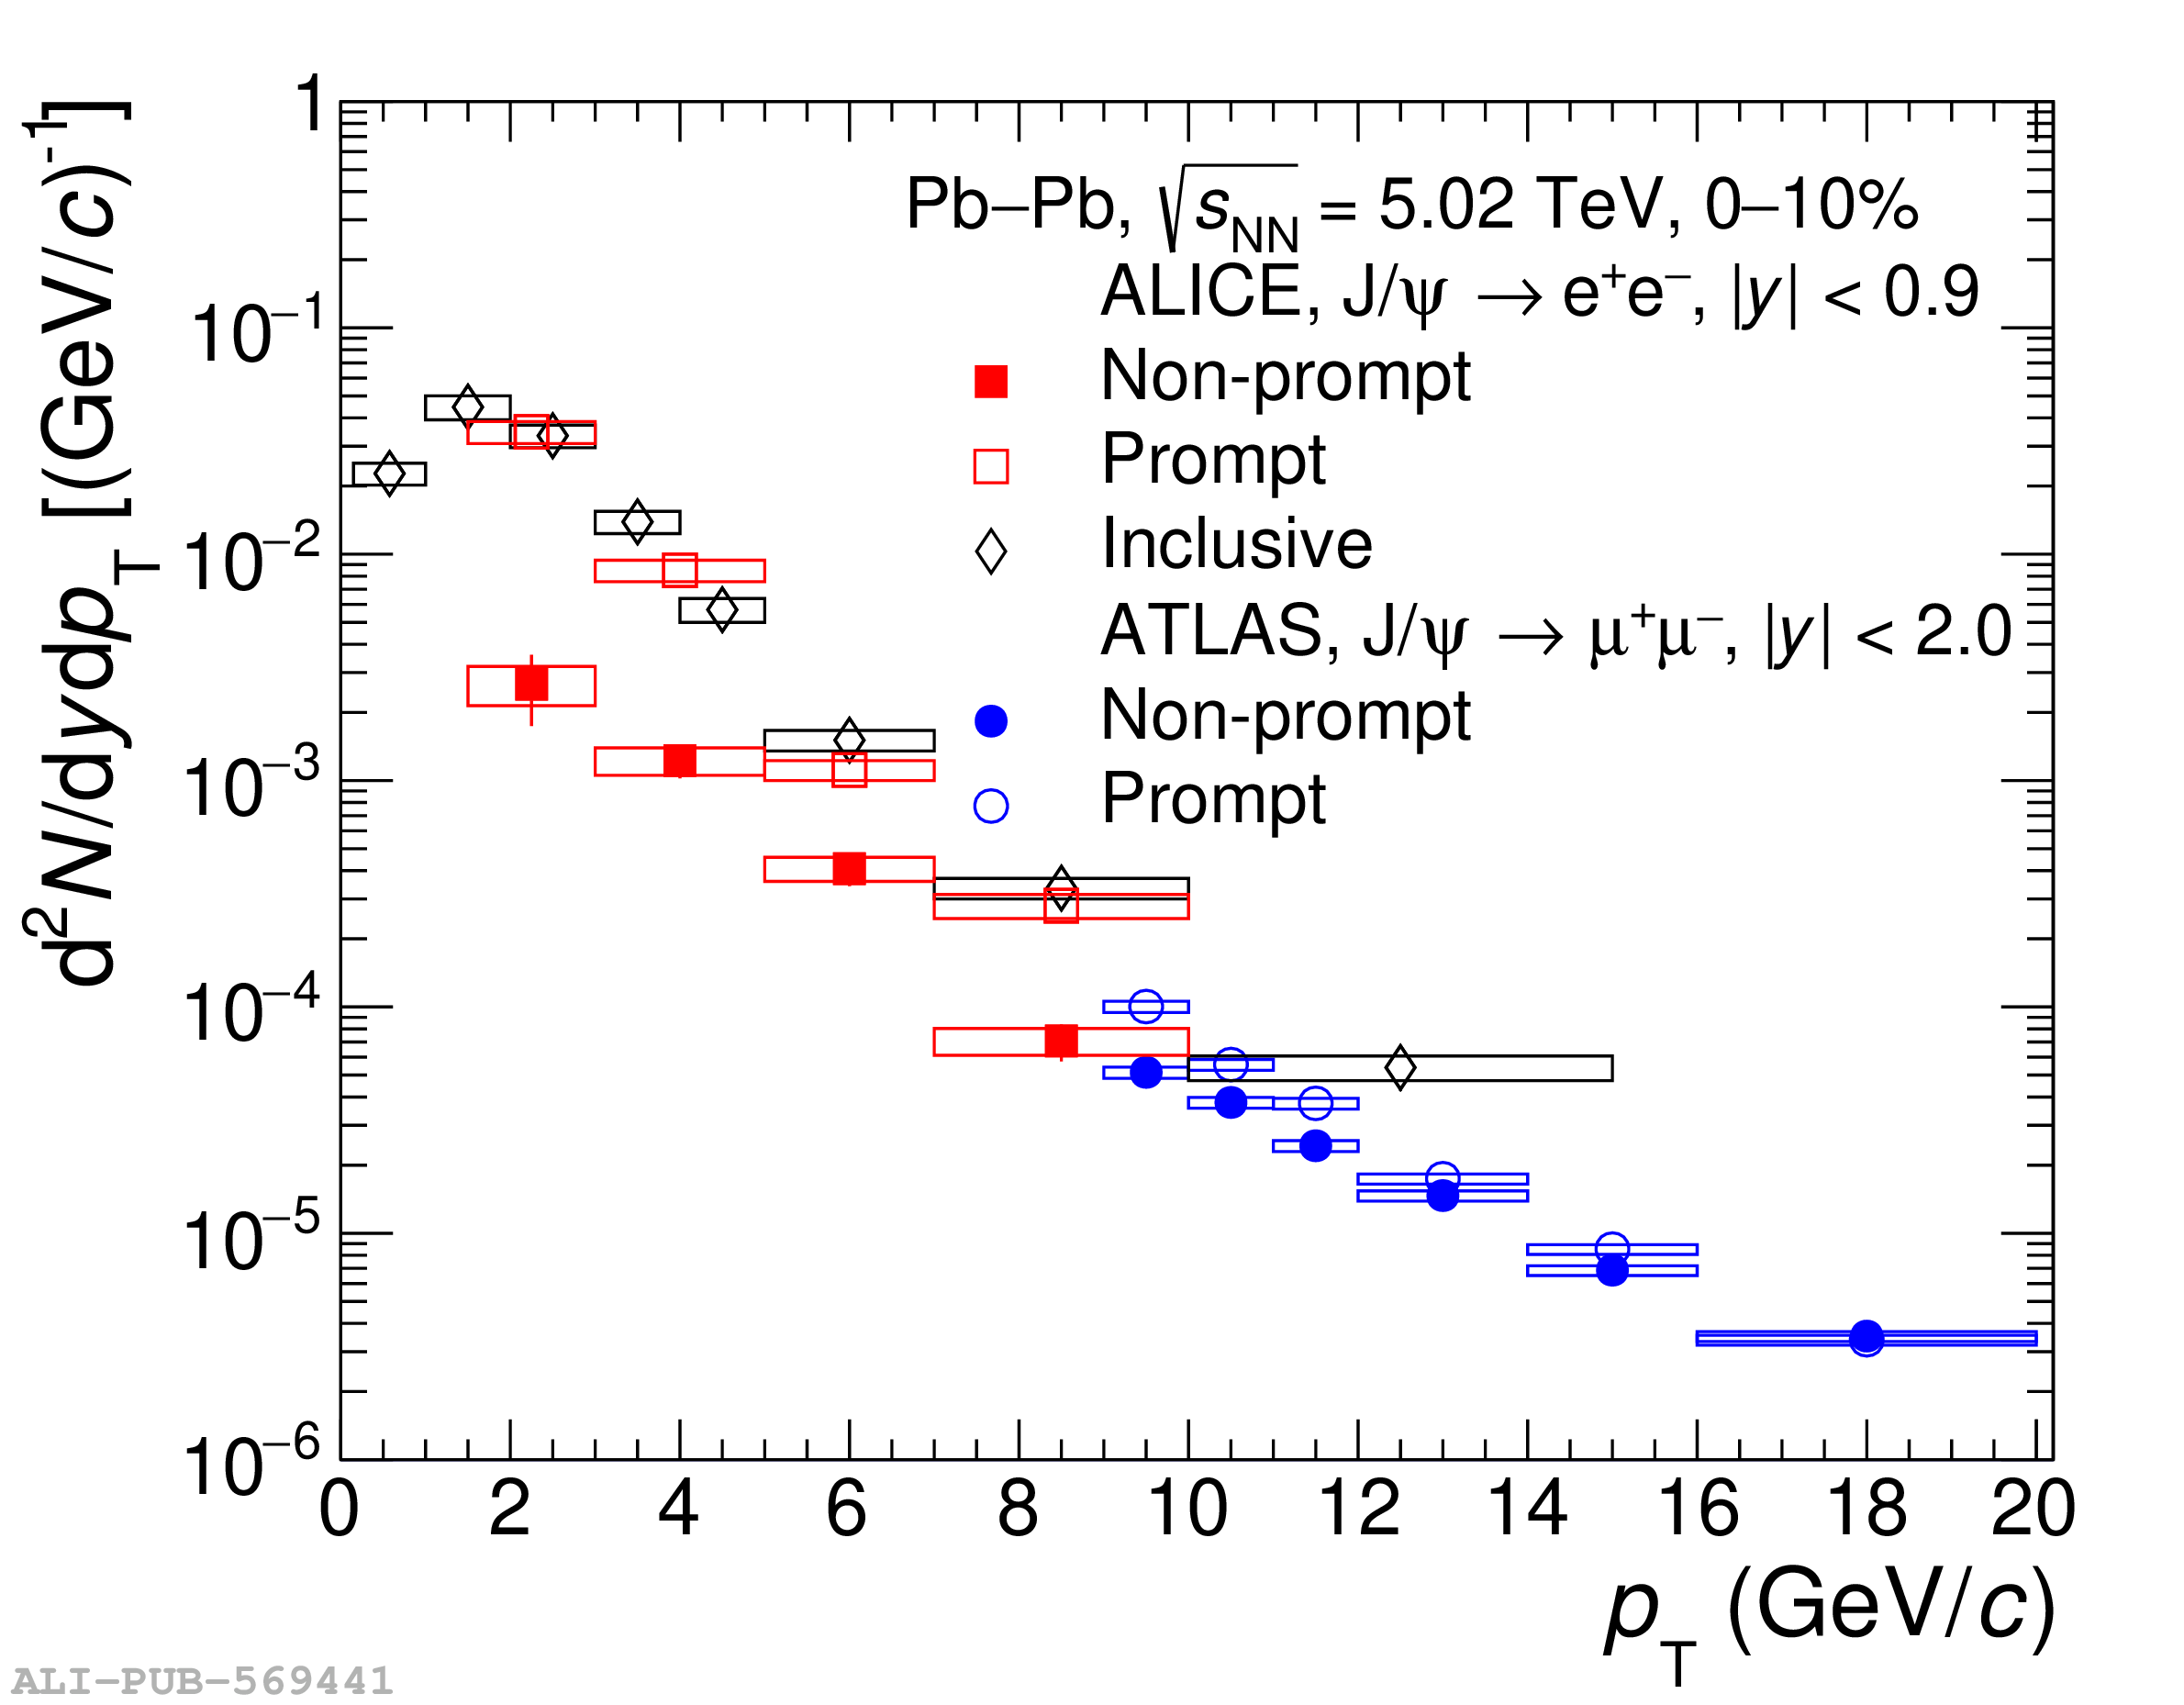
Prompt and non-prompt $\jpsi$ $\pt$-differential production yields measured by ALICE in the 0--10\% centrality class at midrapidity, compared with similar measurements from the ATLAS collaboration  in the same centrality class. Inclusive $\jpsi$ yields measured by the ALICE collaboration in 0--10\%  are shown for comparison. Error bars and boxes represent statistical and systematic uncertainties, respectively.

Figure 5

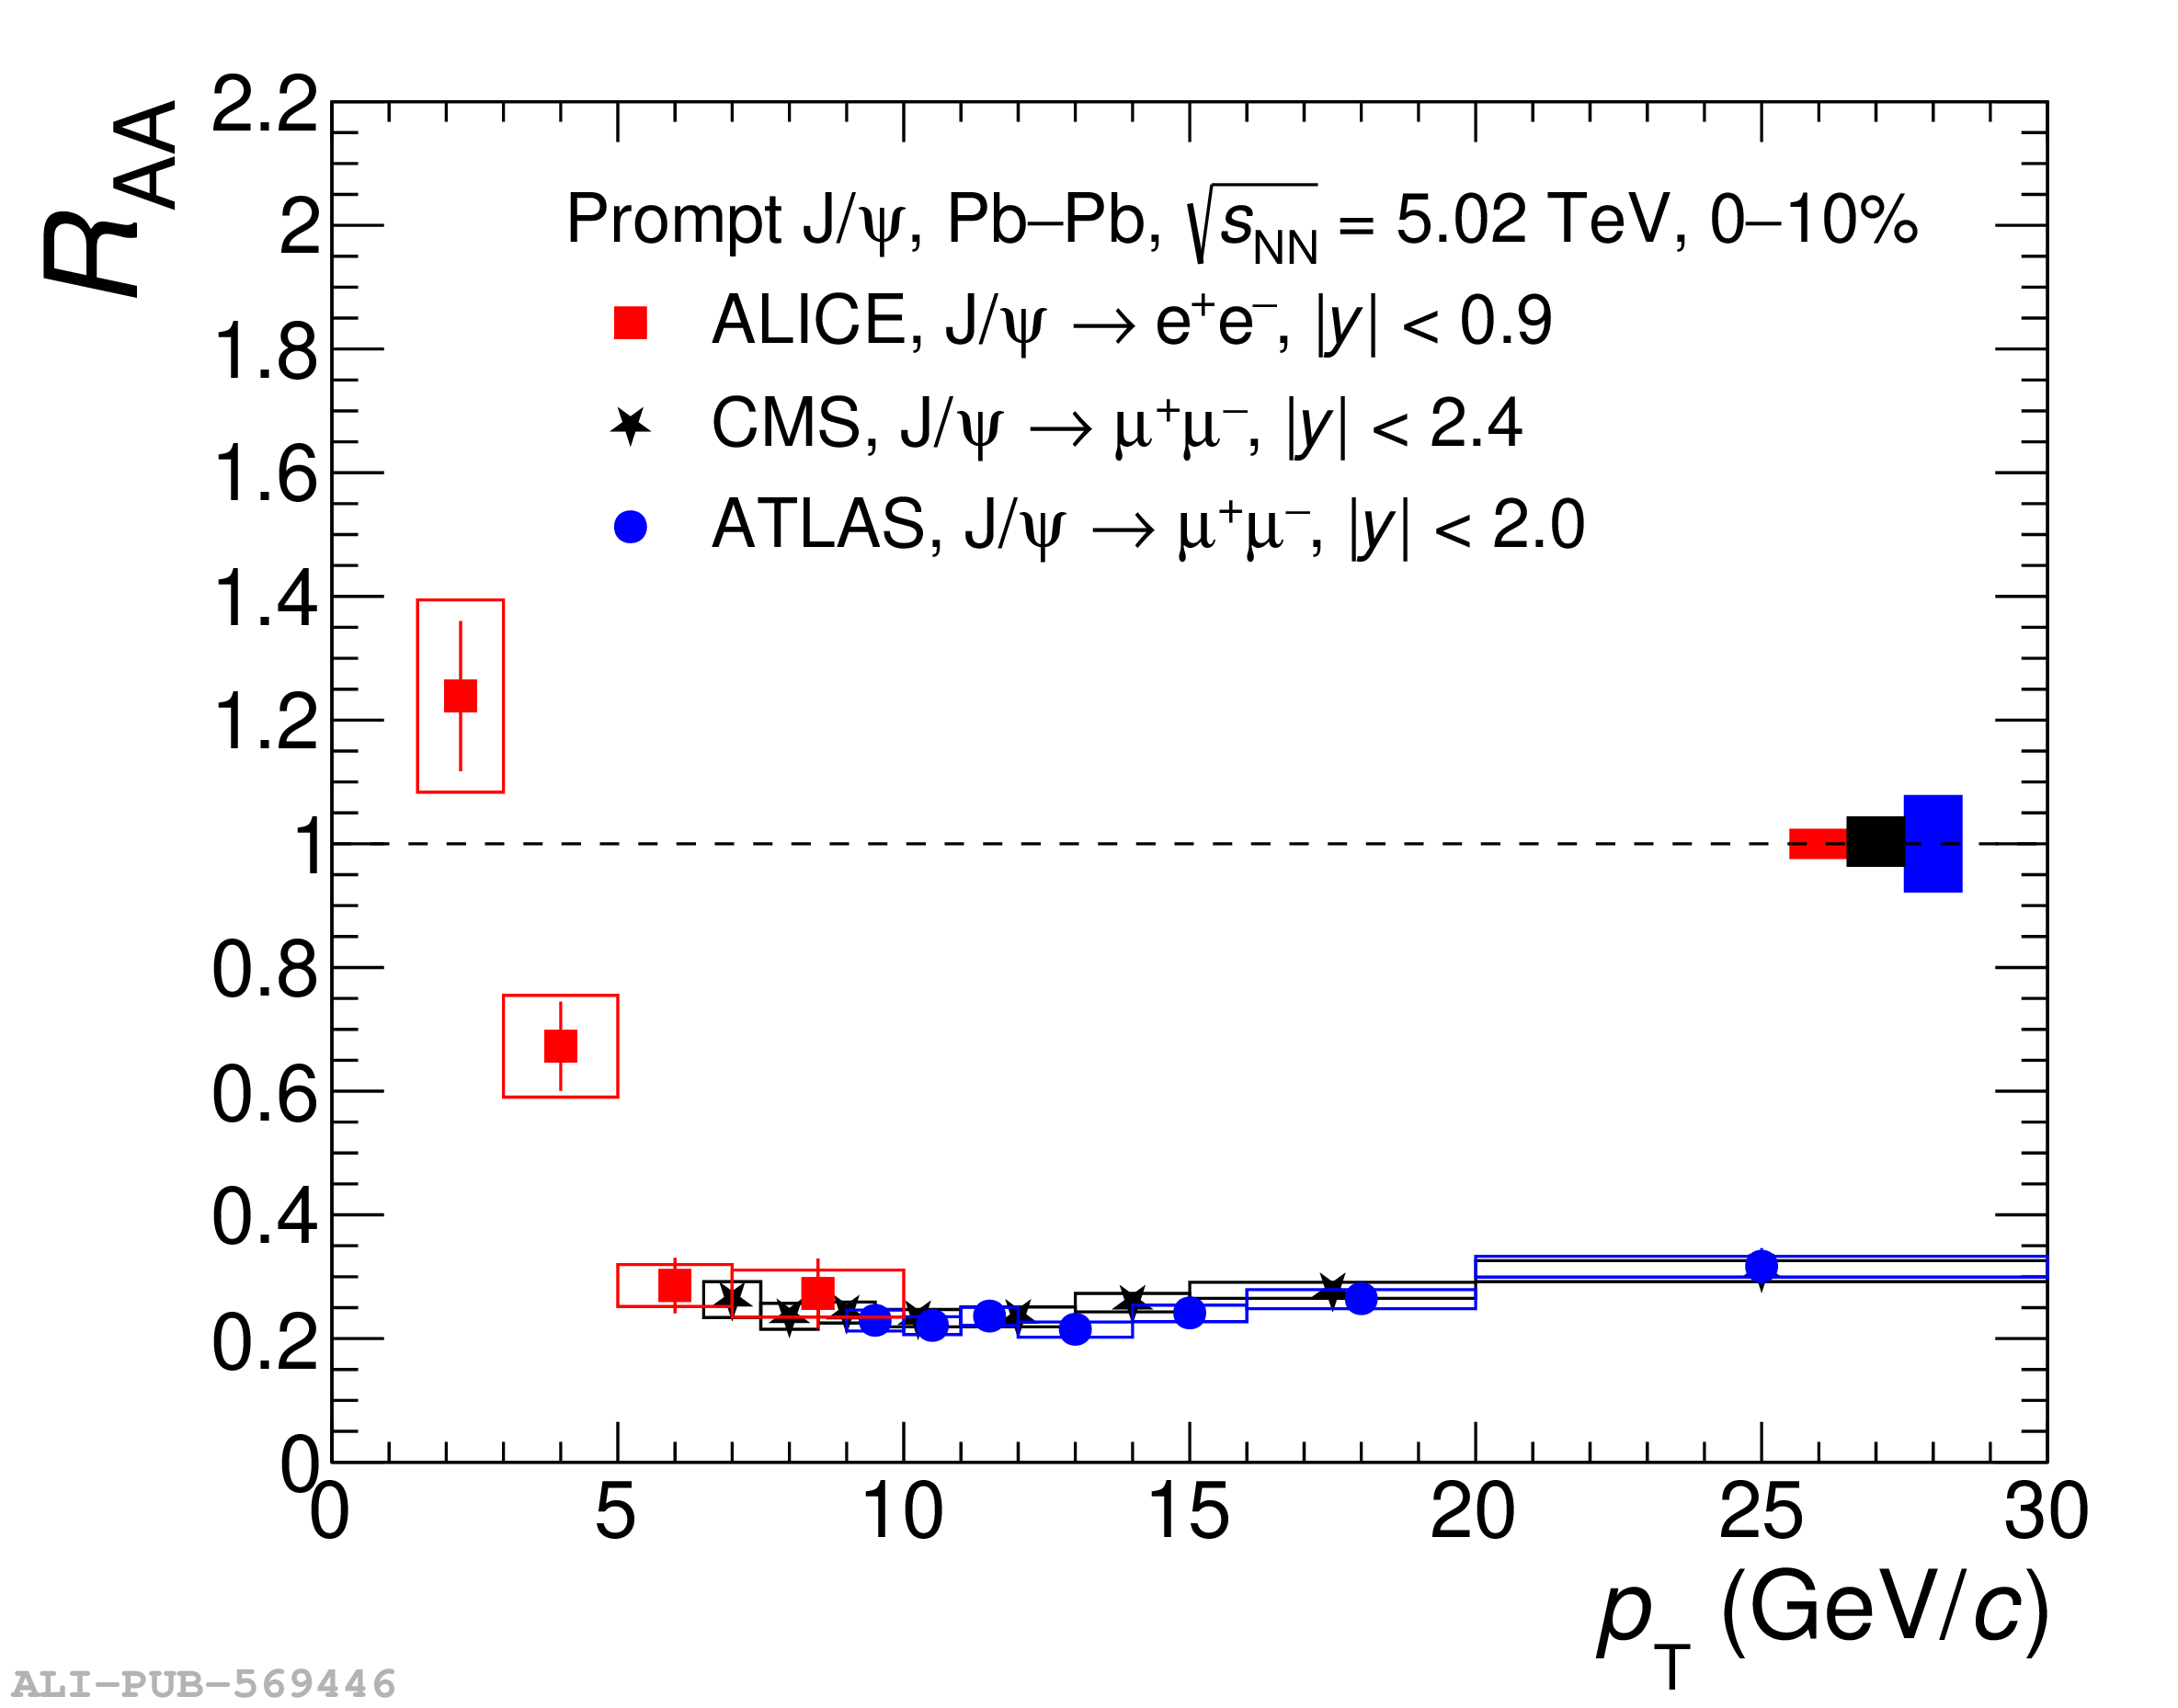
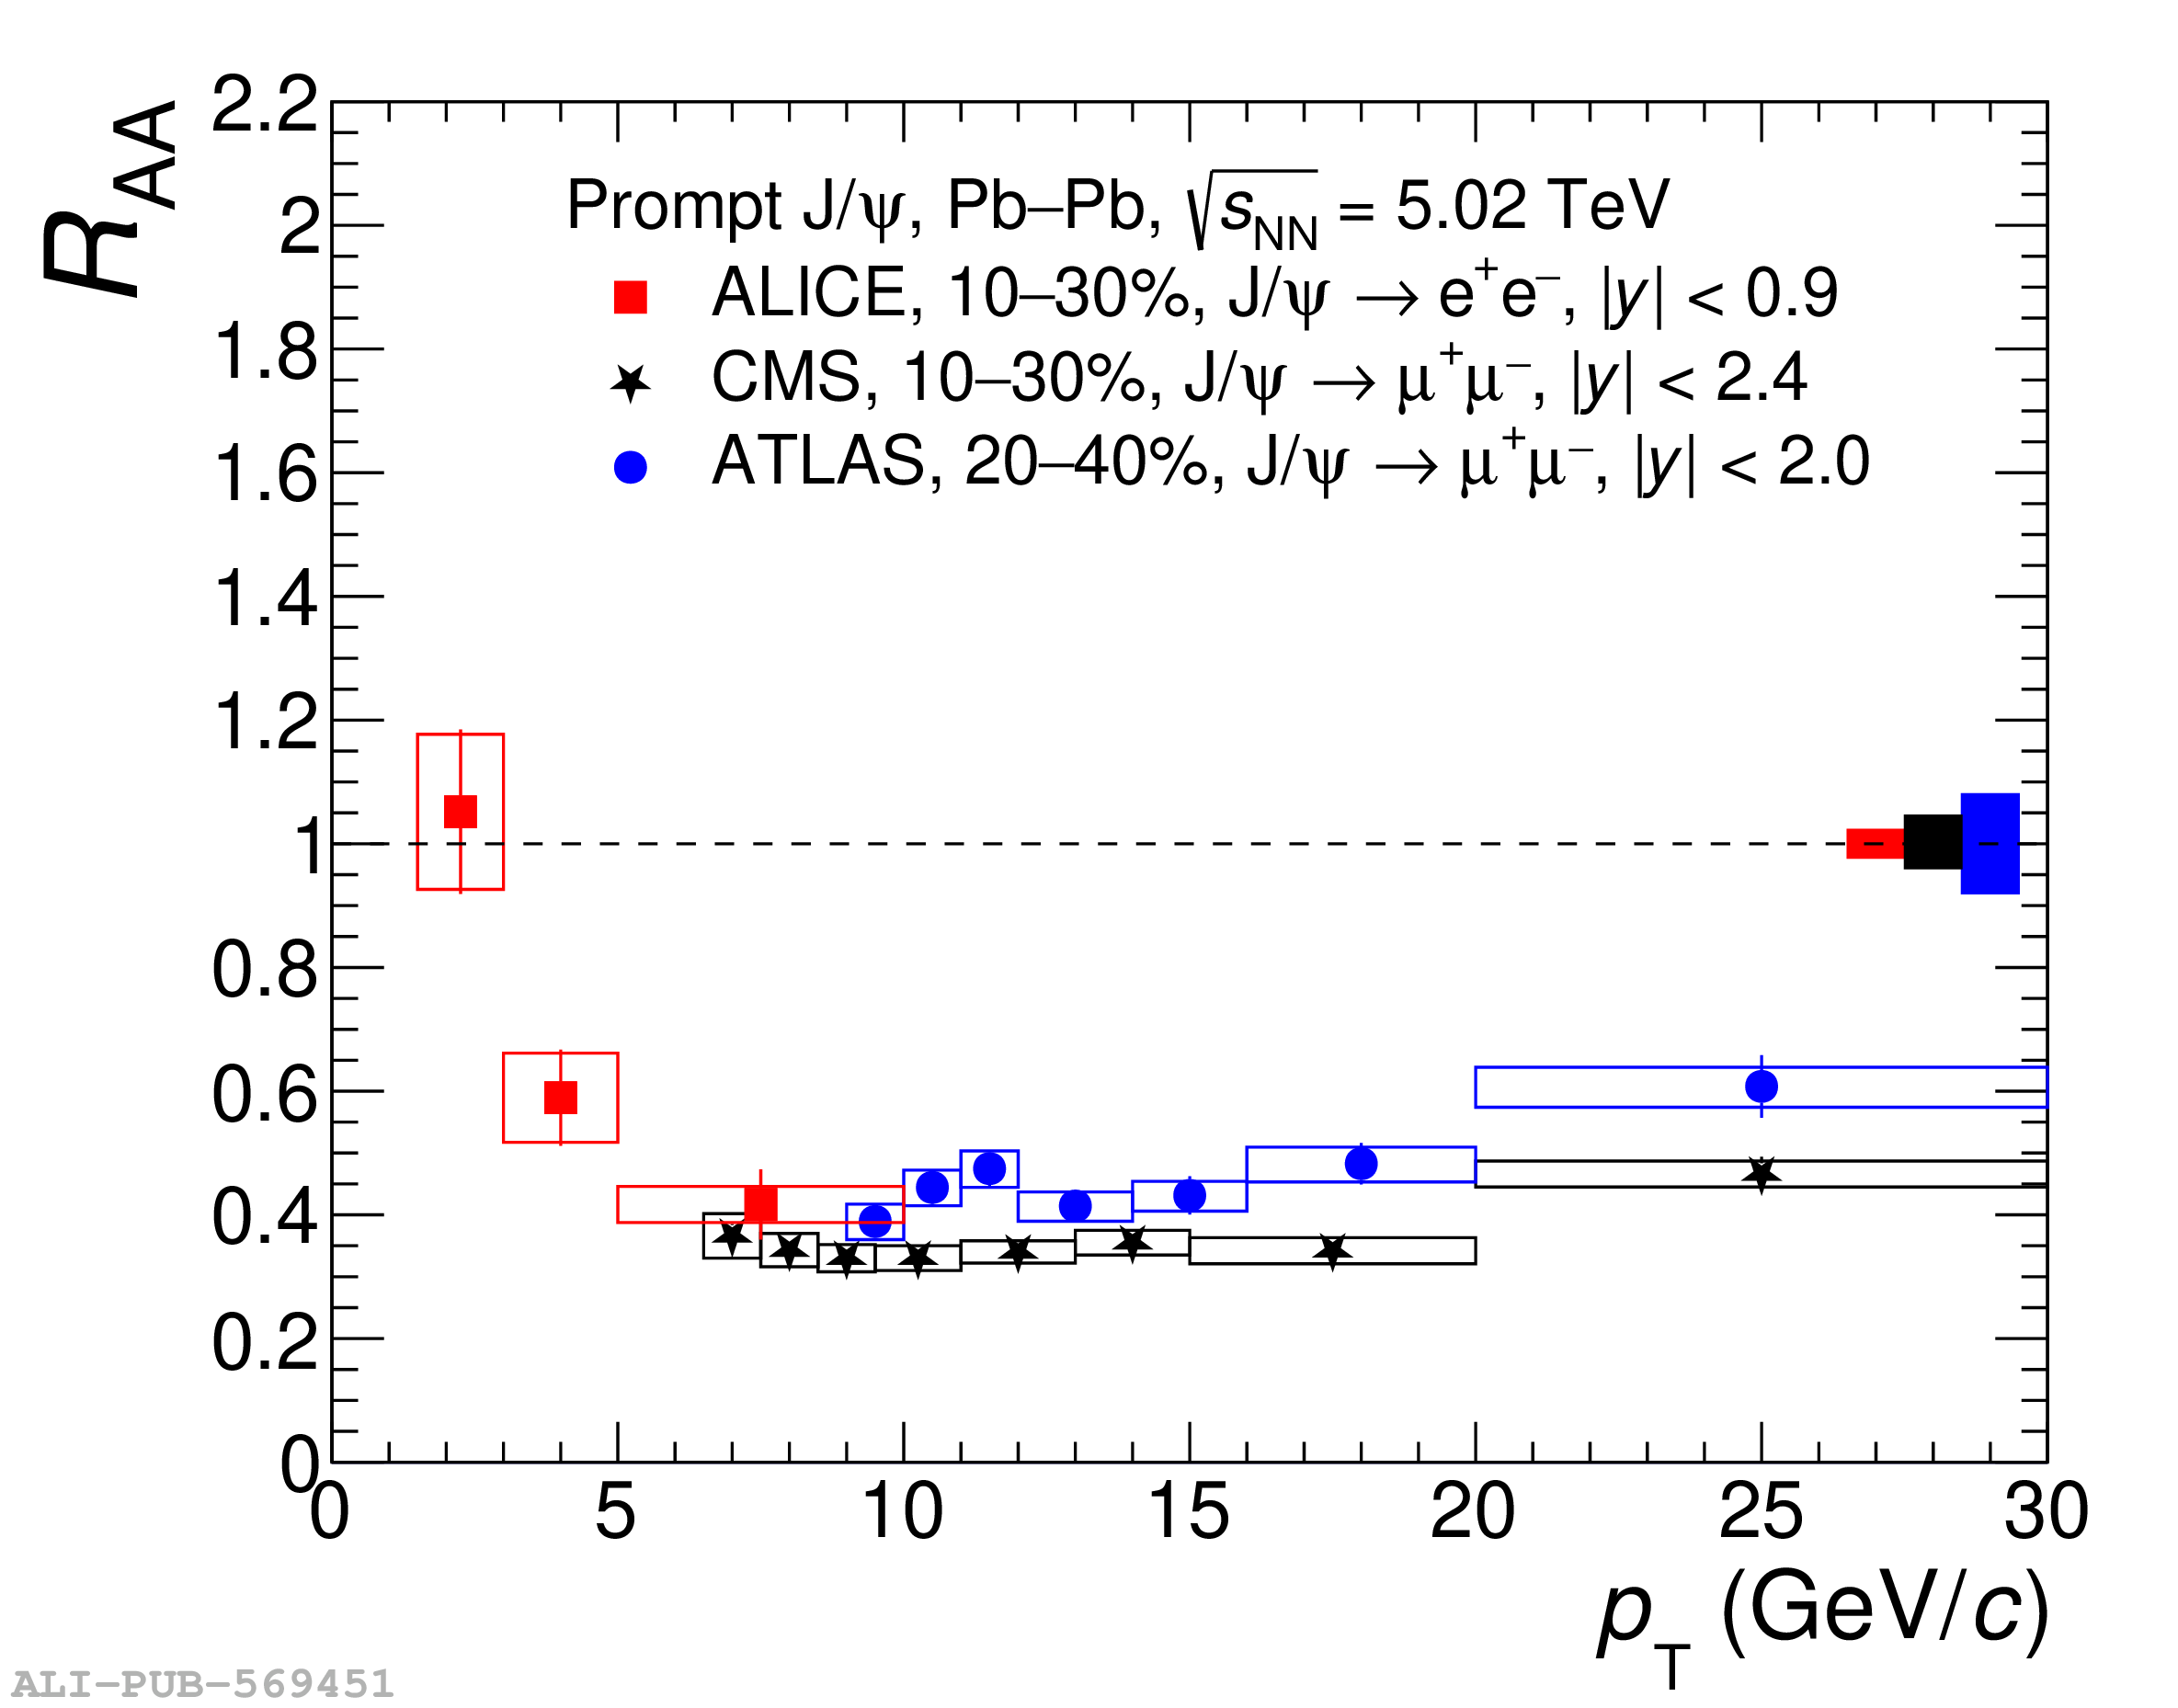
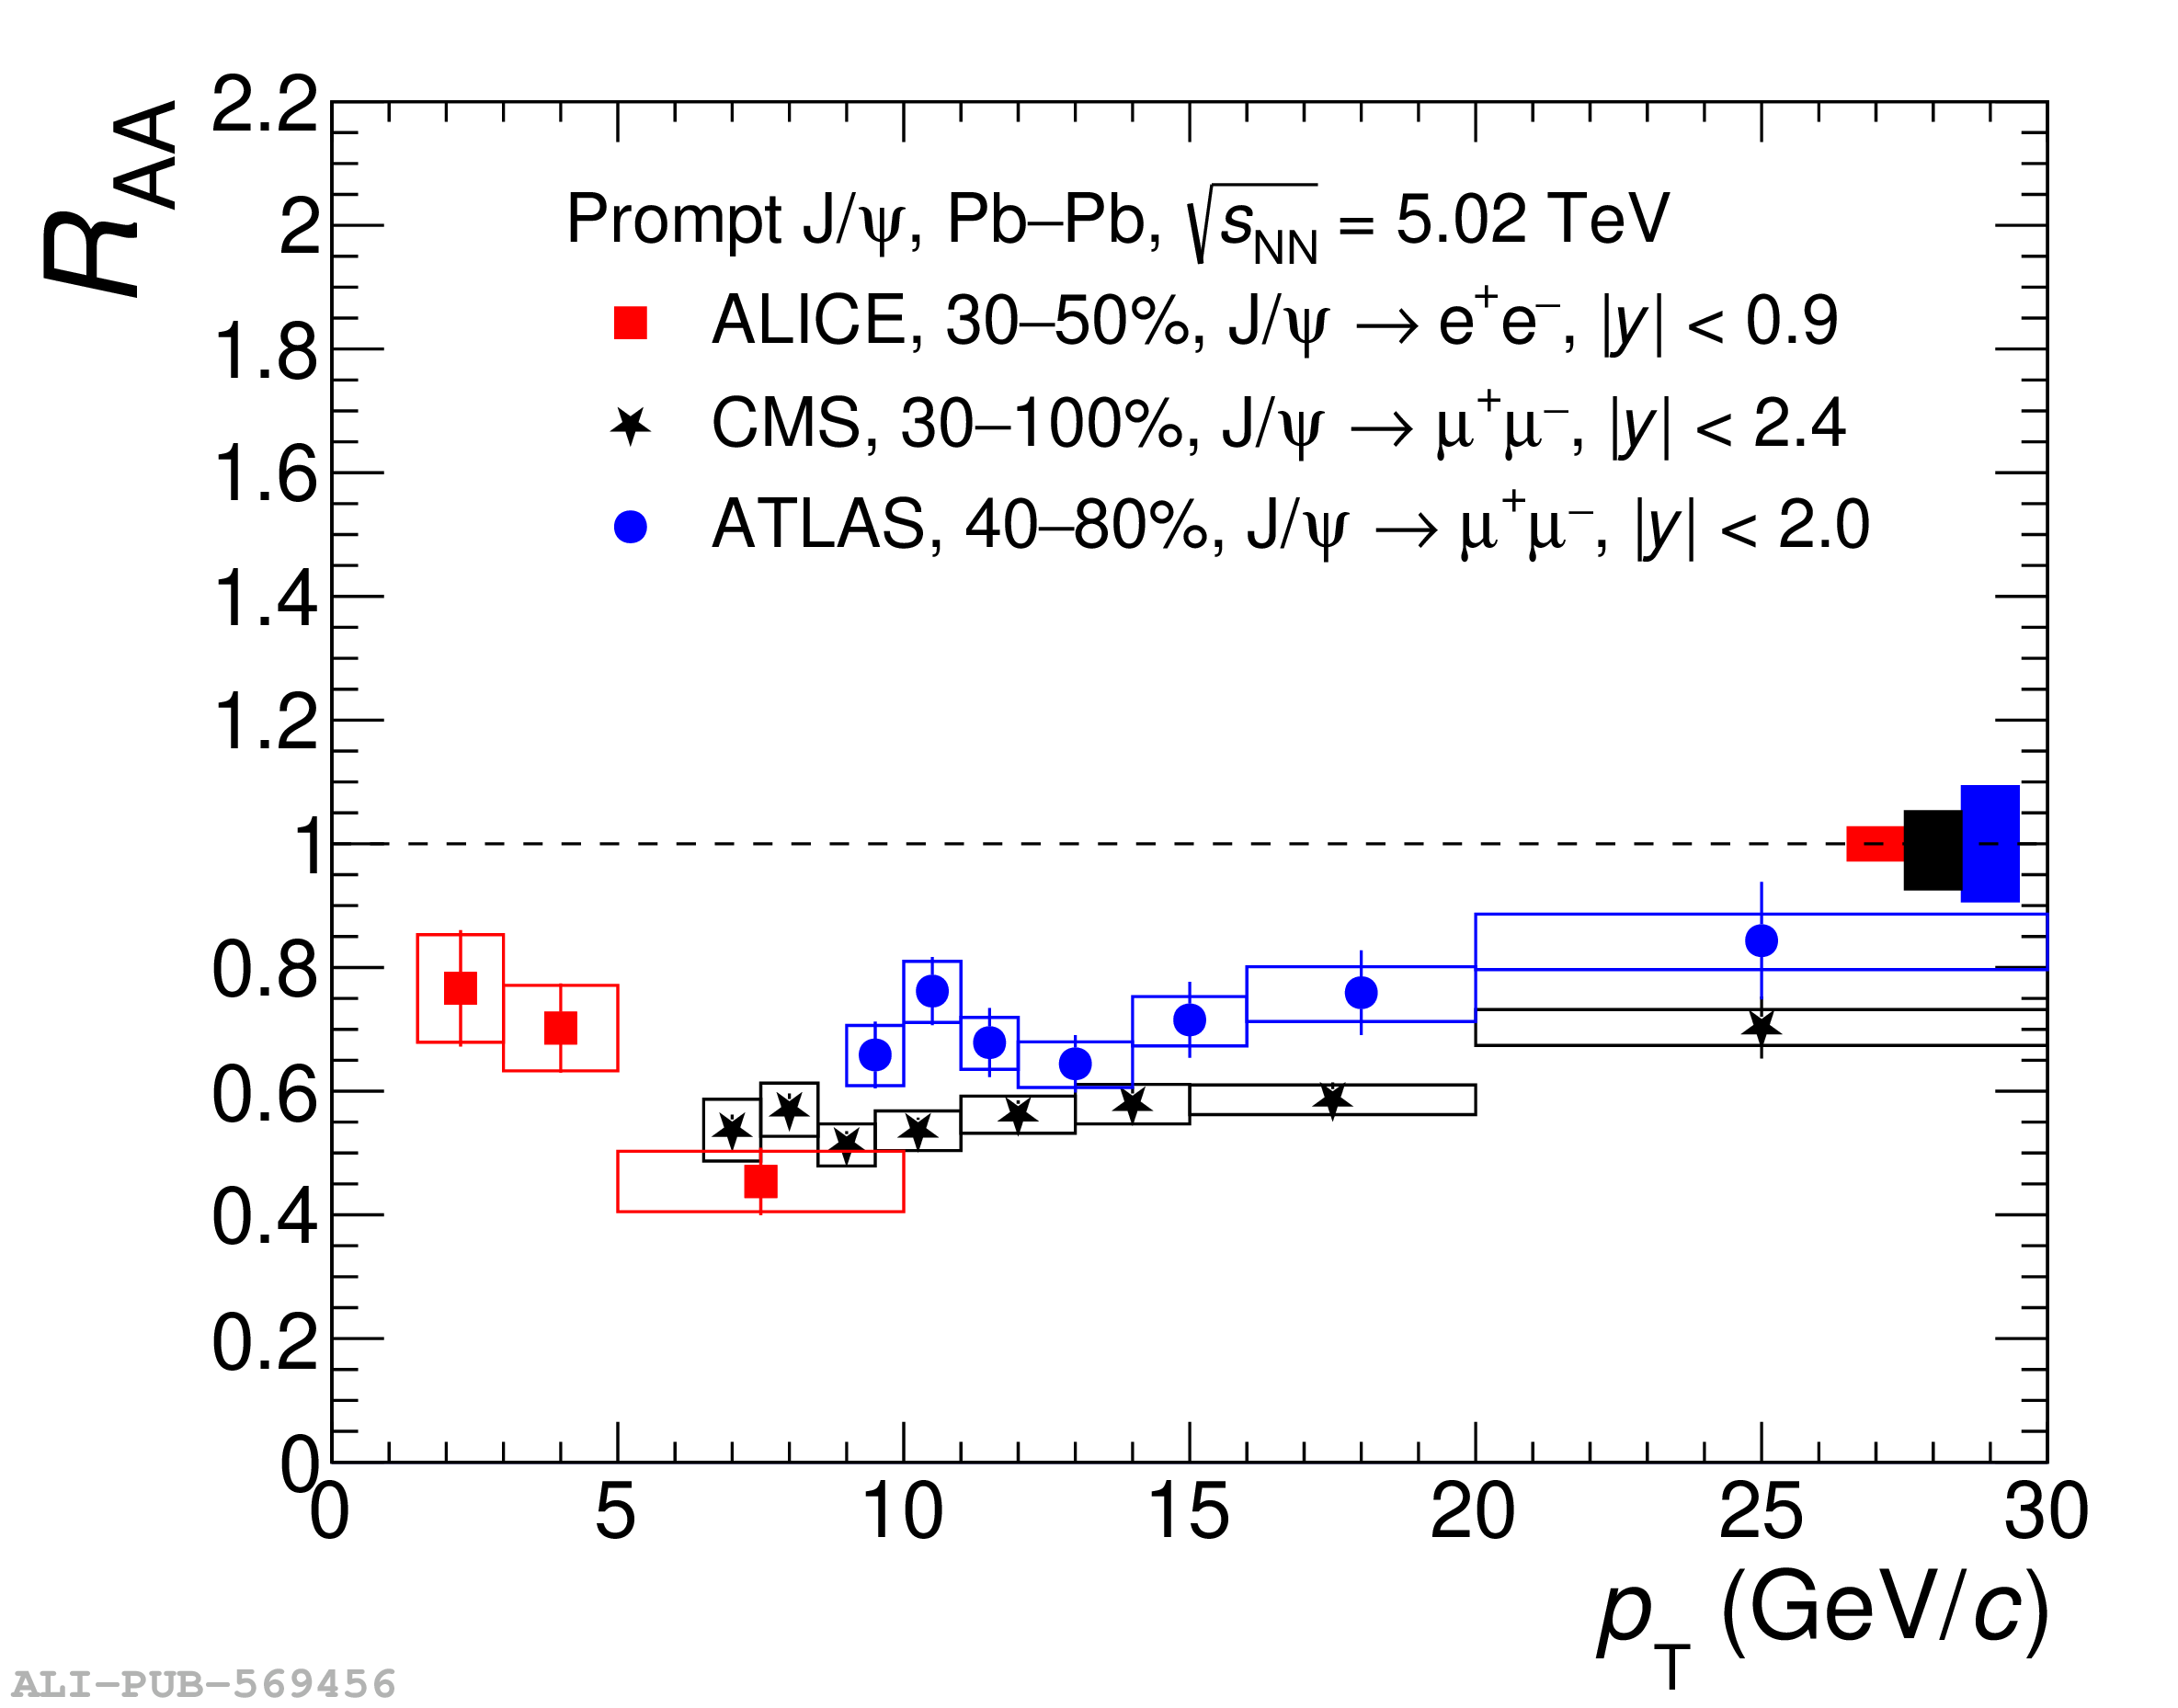
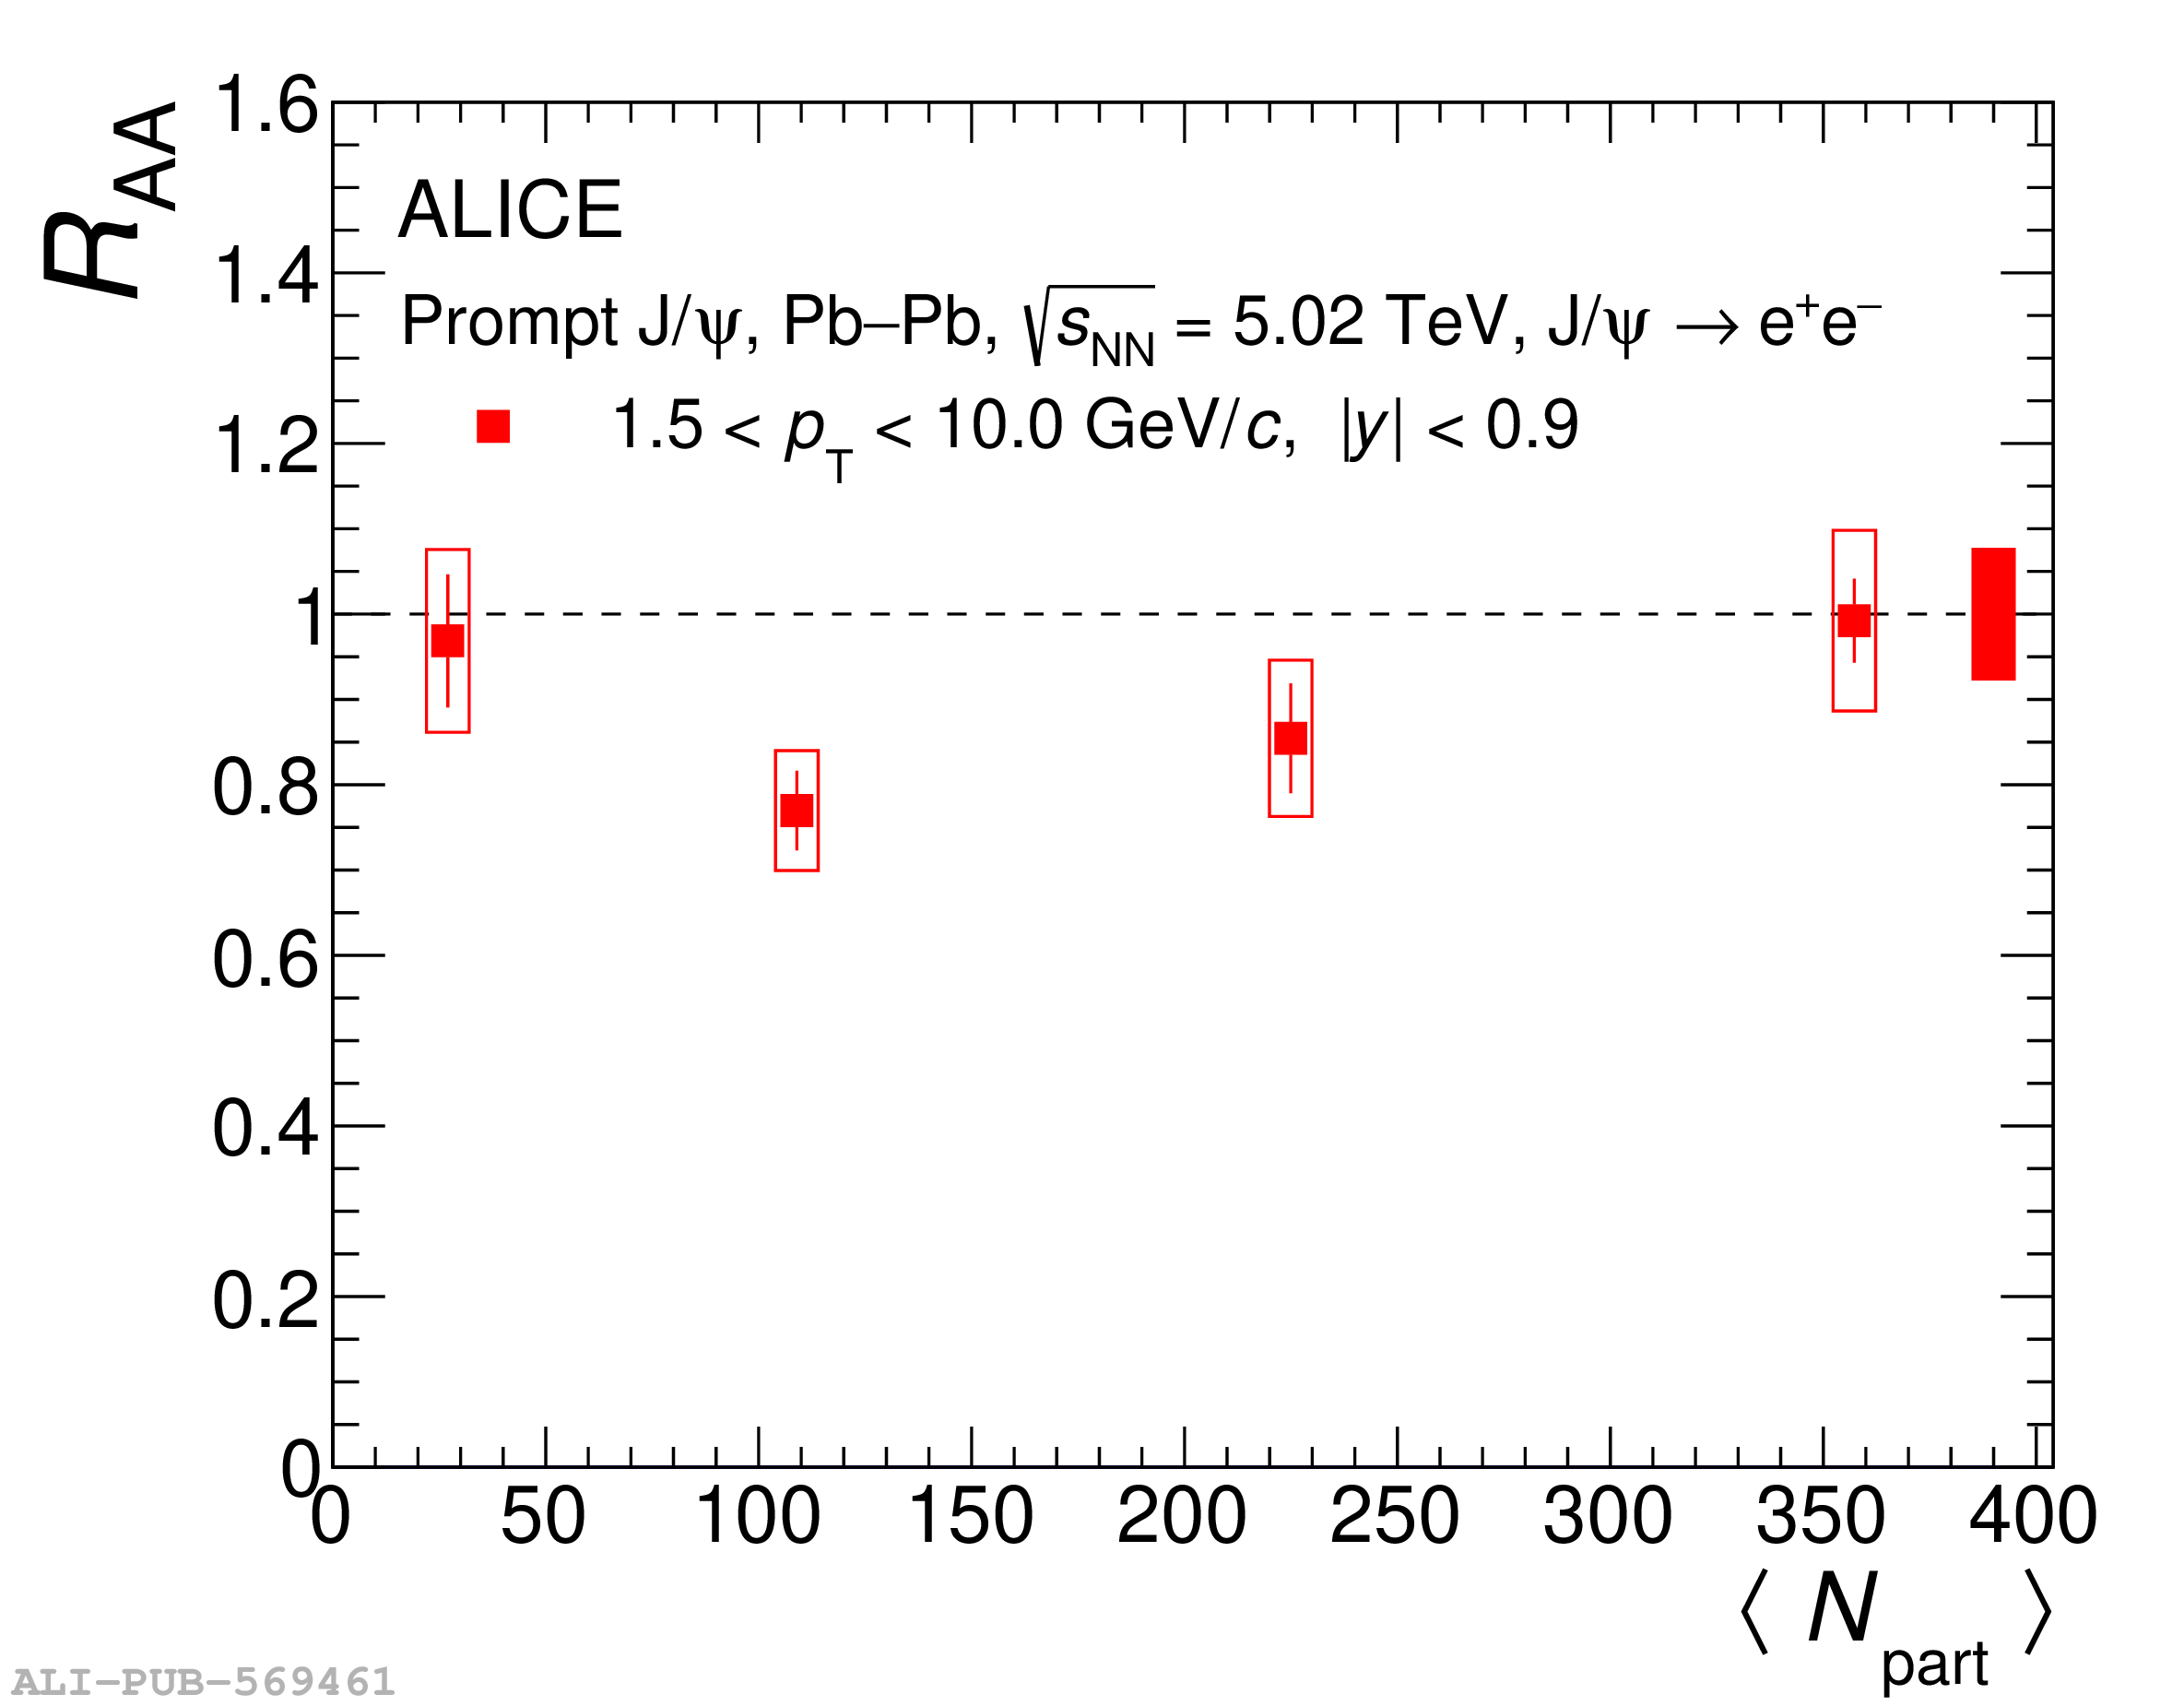
Nuclear modification factor of prompt $\jpsi$ as a function of $\pt$ in 0--10\% (upper left panel), 10--30\% (top right panel) and 30--50\% (bottom left panel) centrality classes. Results are compared with similar measurements from the ATLAS  and CMS  collaborations. The centrality dependent prompt $\jpsi$ $\RAA$ in 1.5 $< \pt <$ 10 GeV/$c$ is shown in the bottom right panel (centrality is expressed in terms of average number of participants). Error bars and boxes represent, respectively, statistical and systematic uncertainties uncorrelated with $\pt$ (centrality, for the bottom right panel). Global uncertainties are shown as boxes around unity.

Figure 6

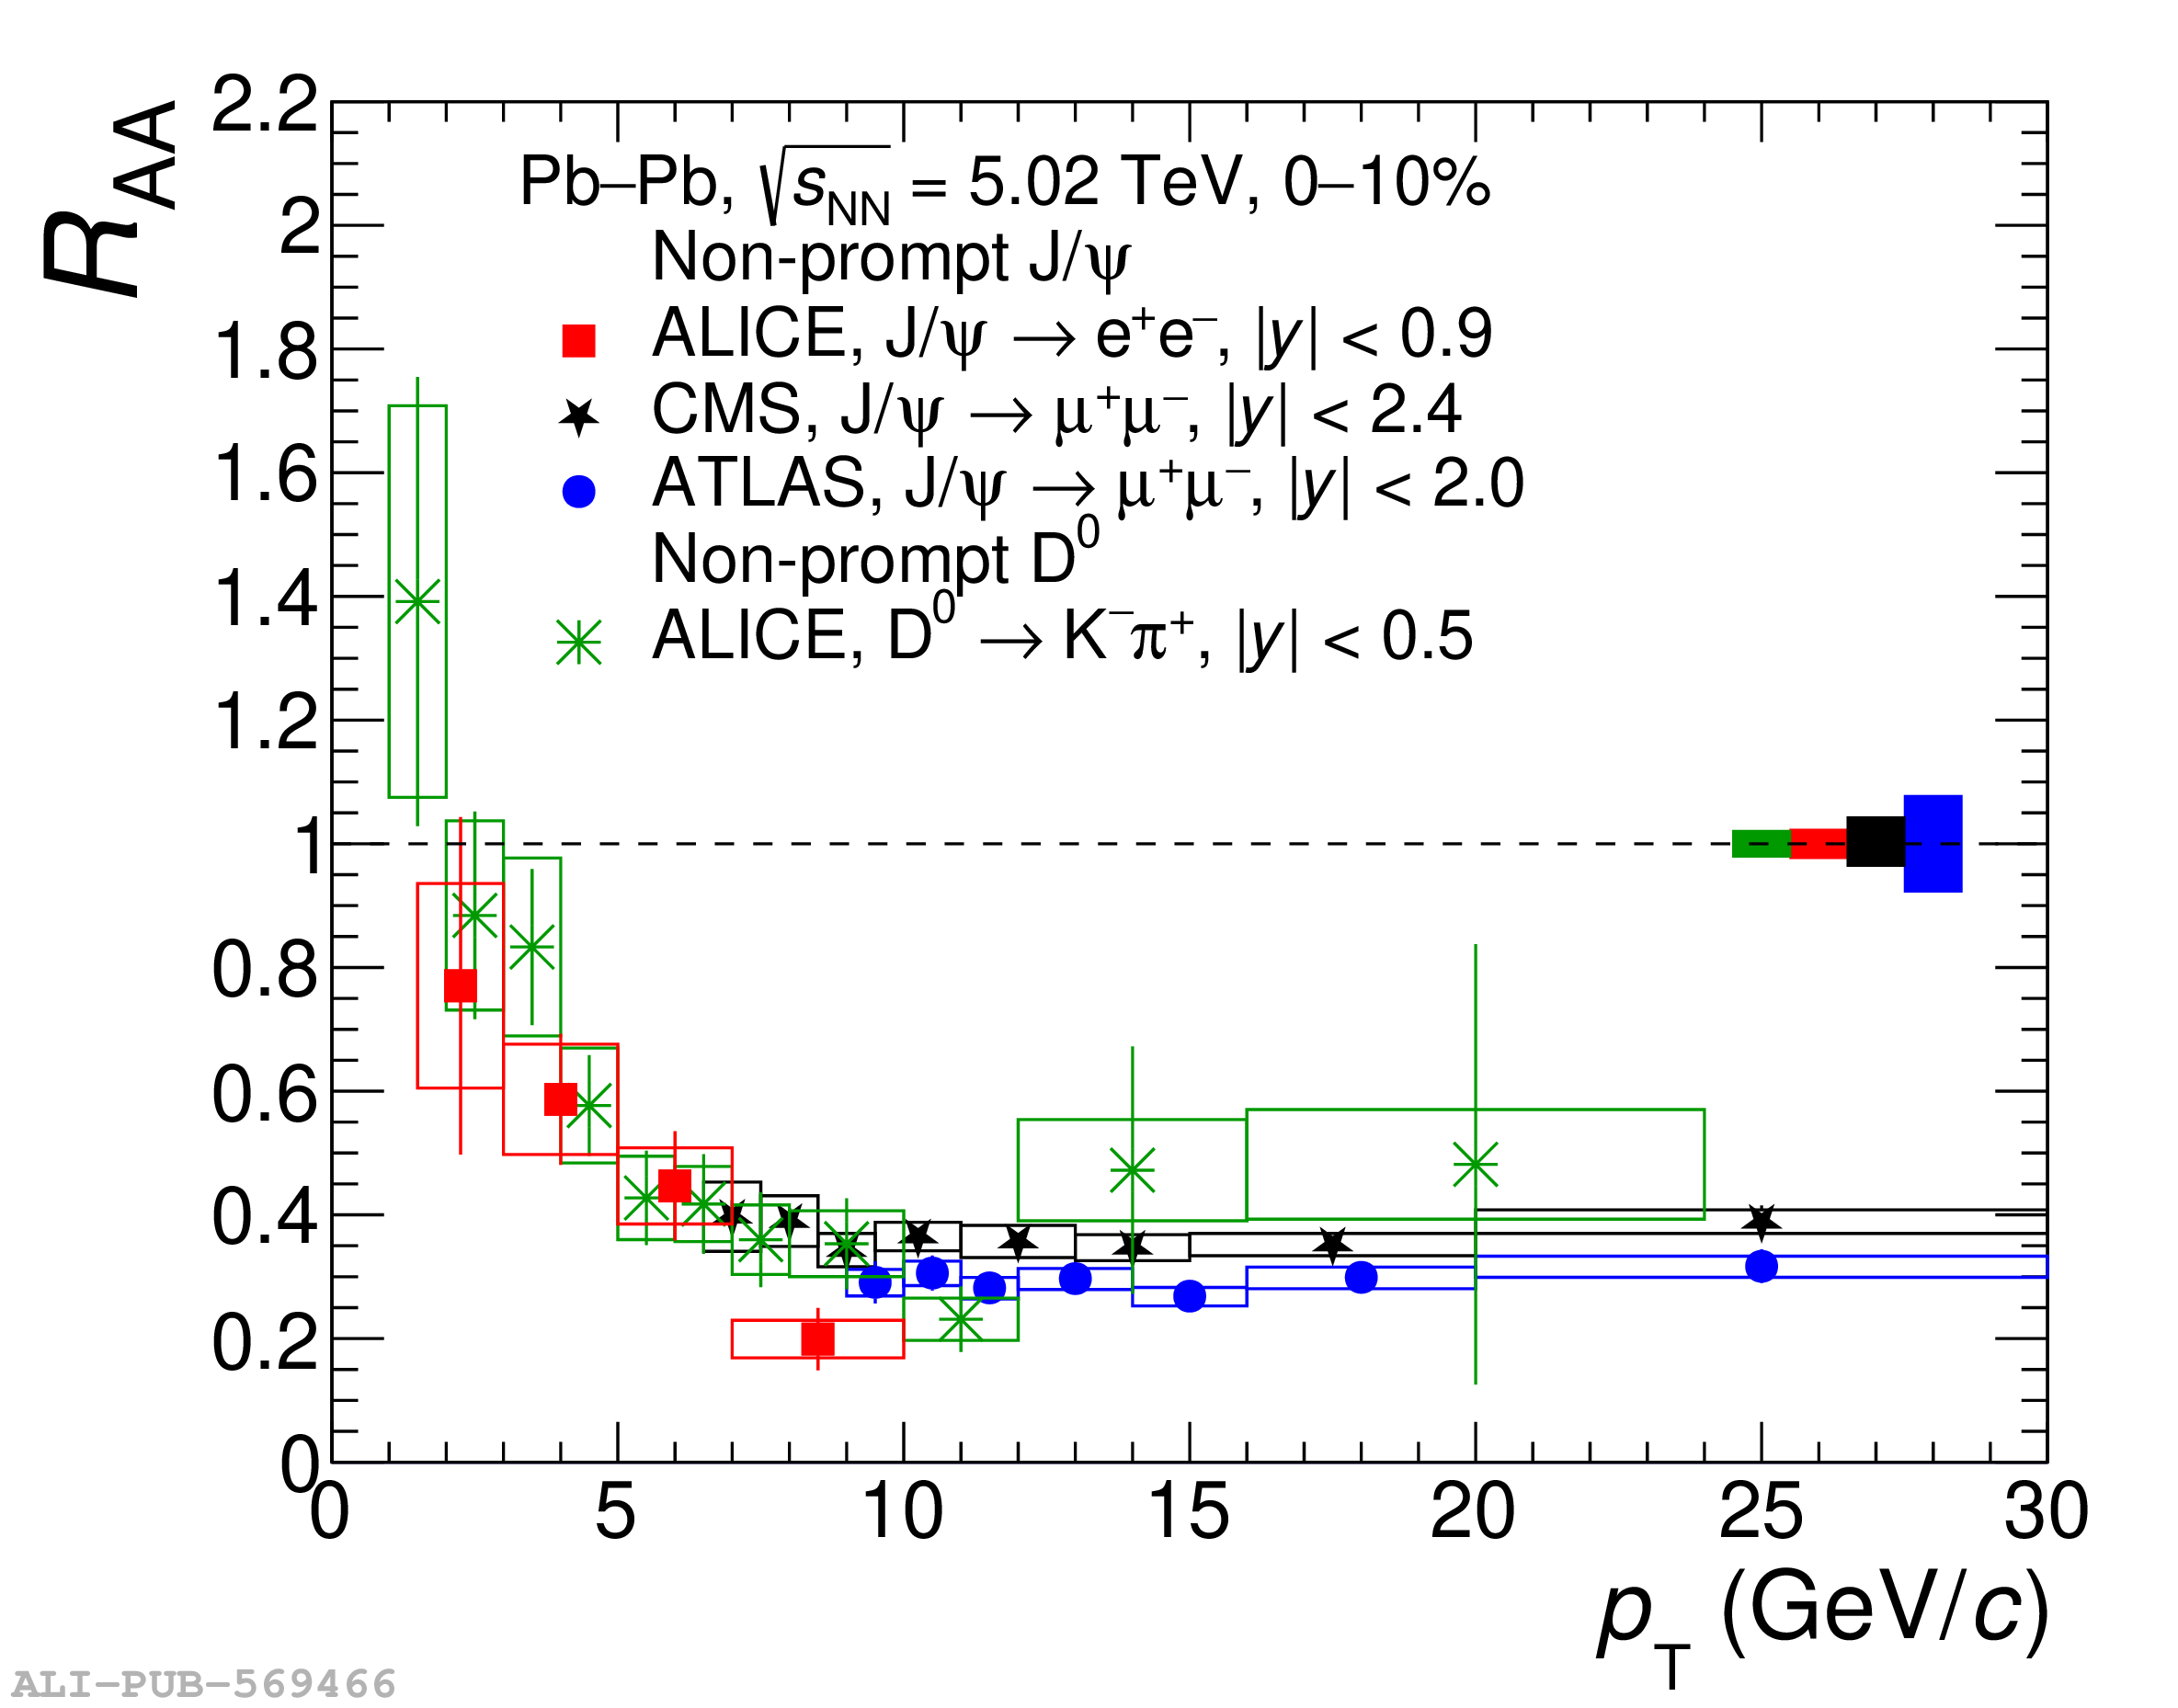
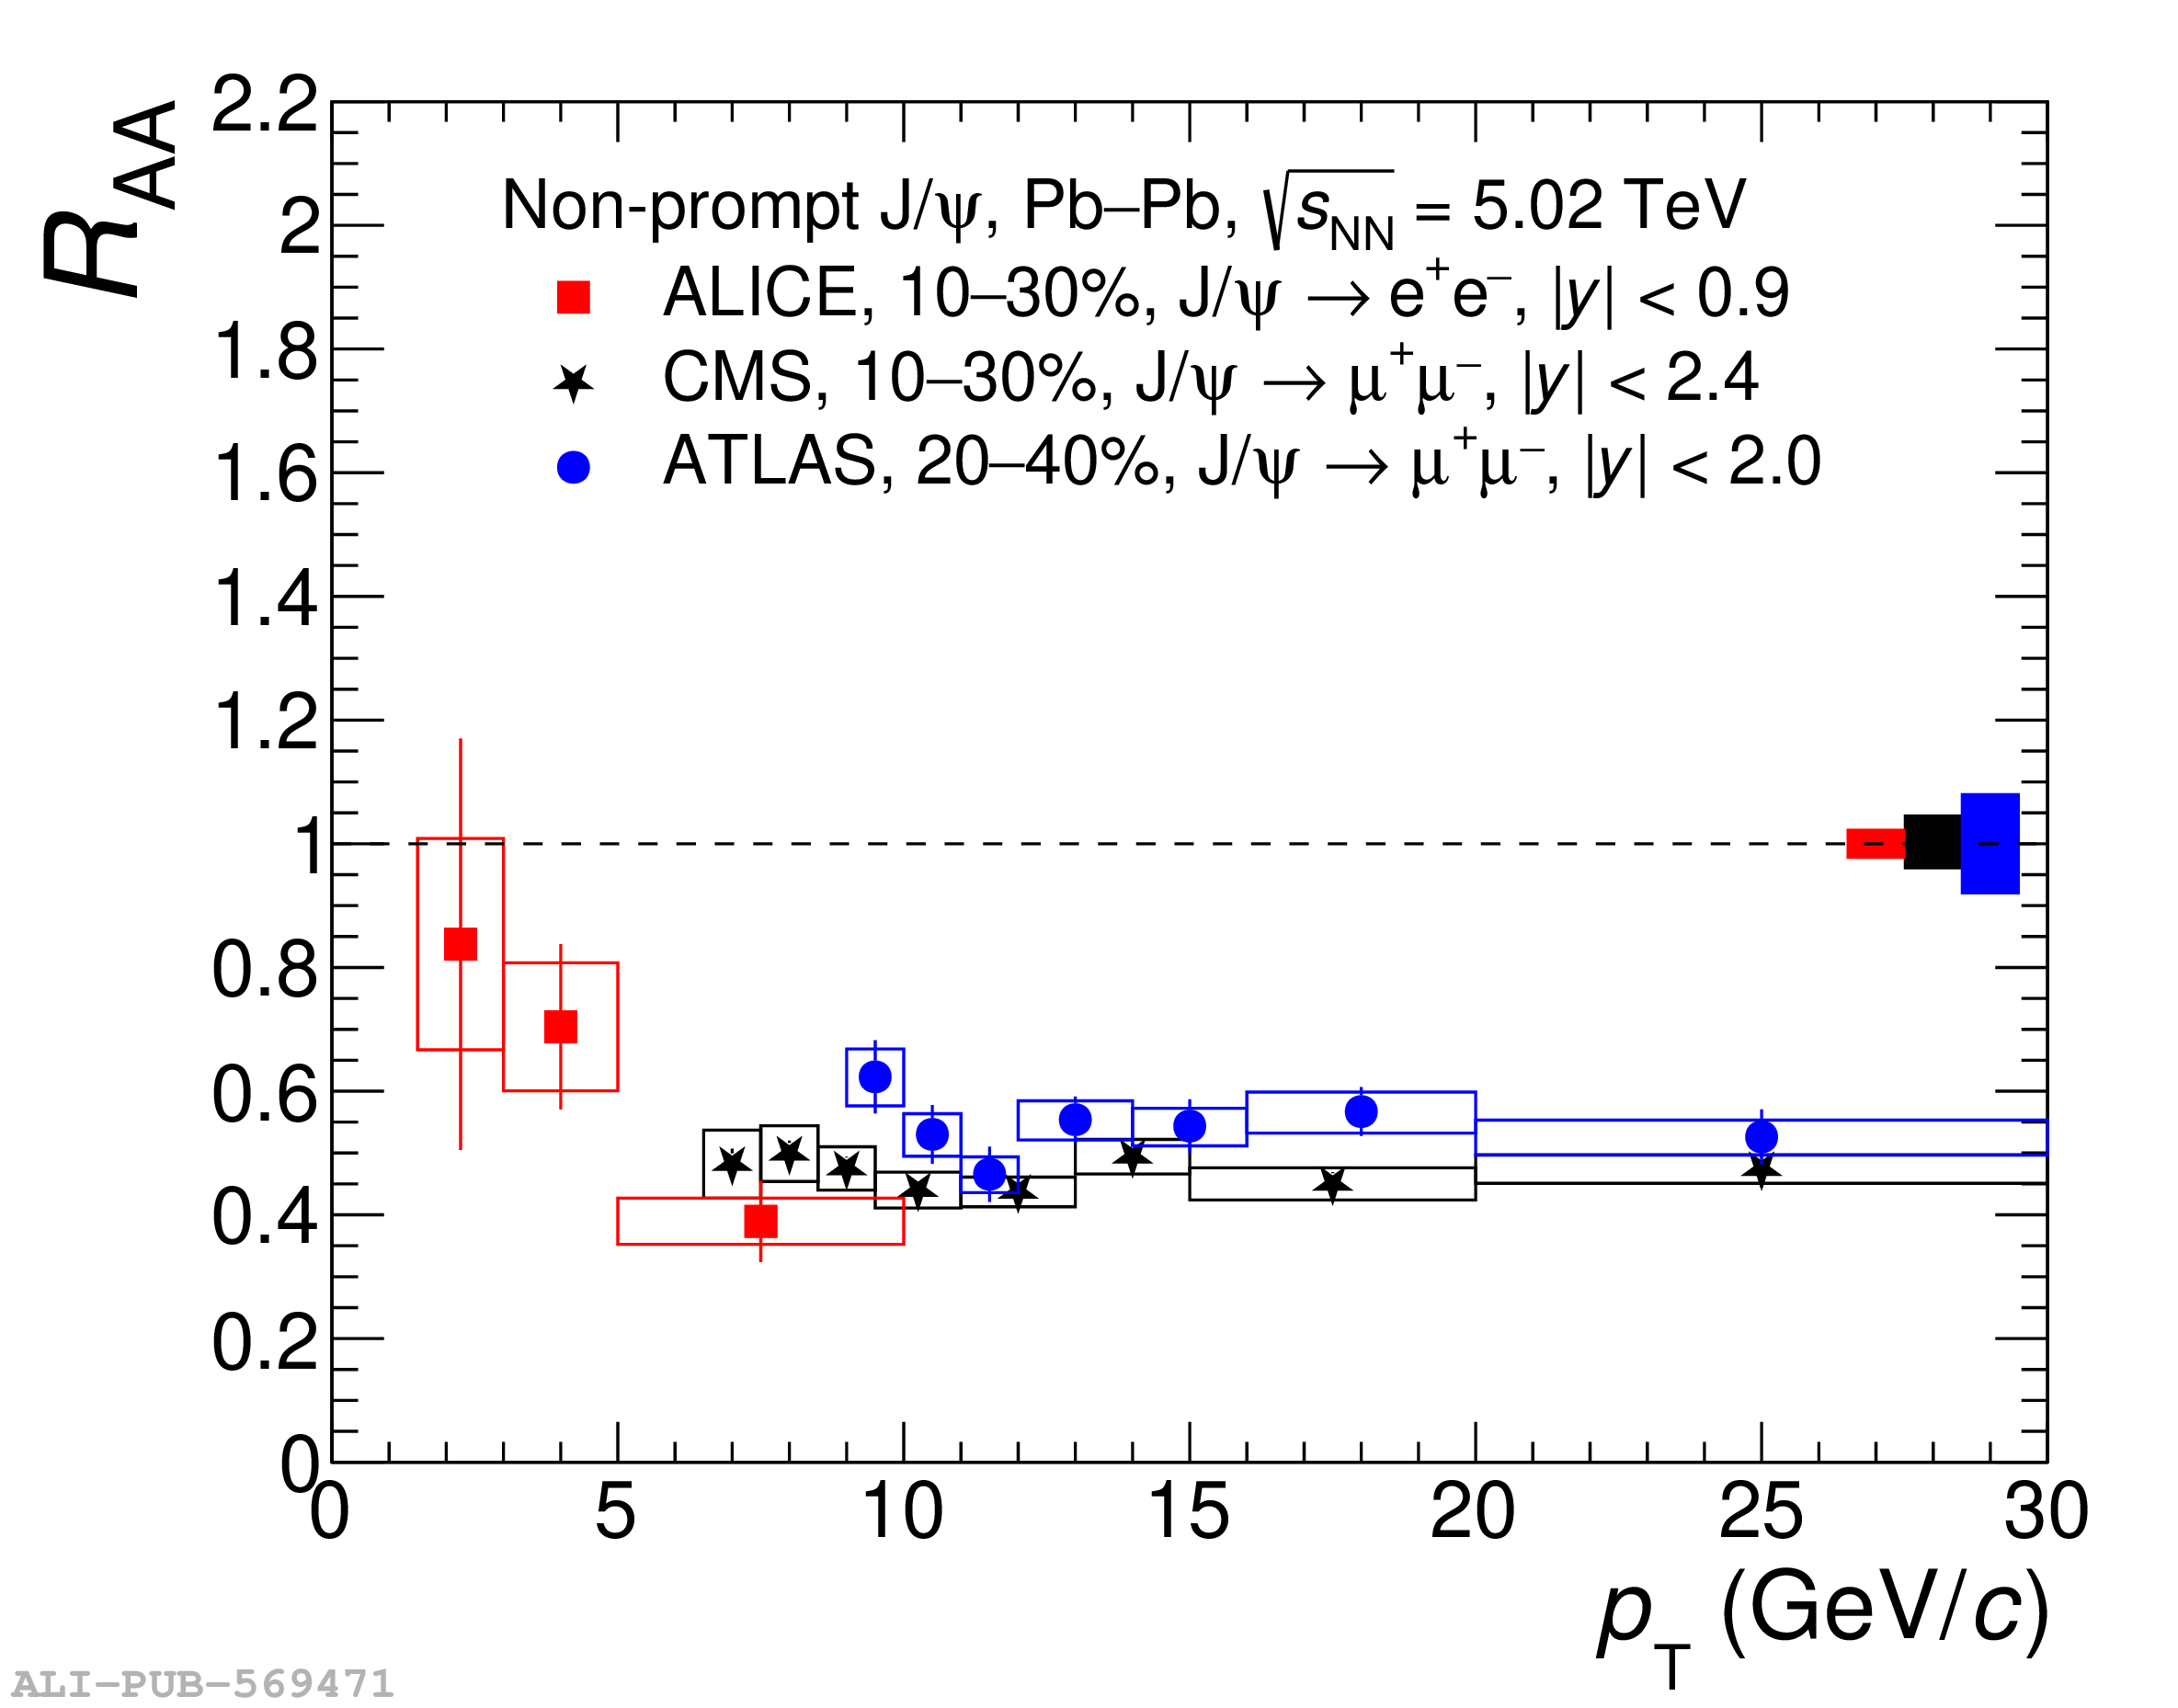
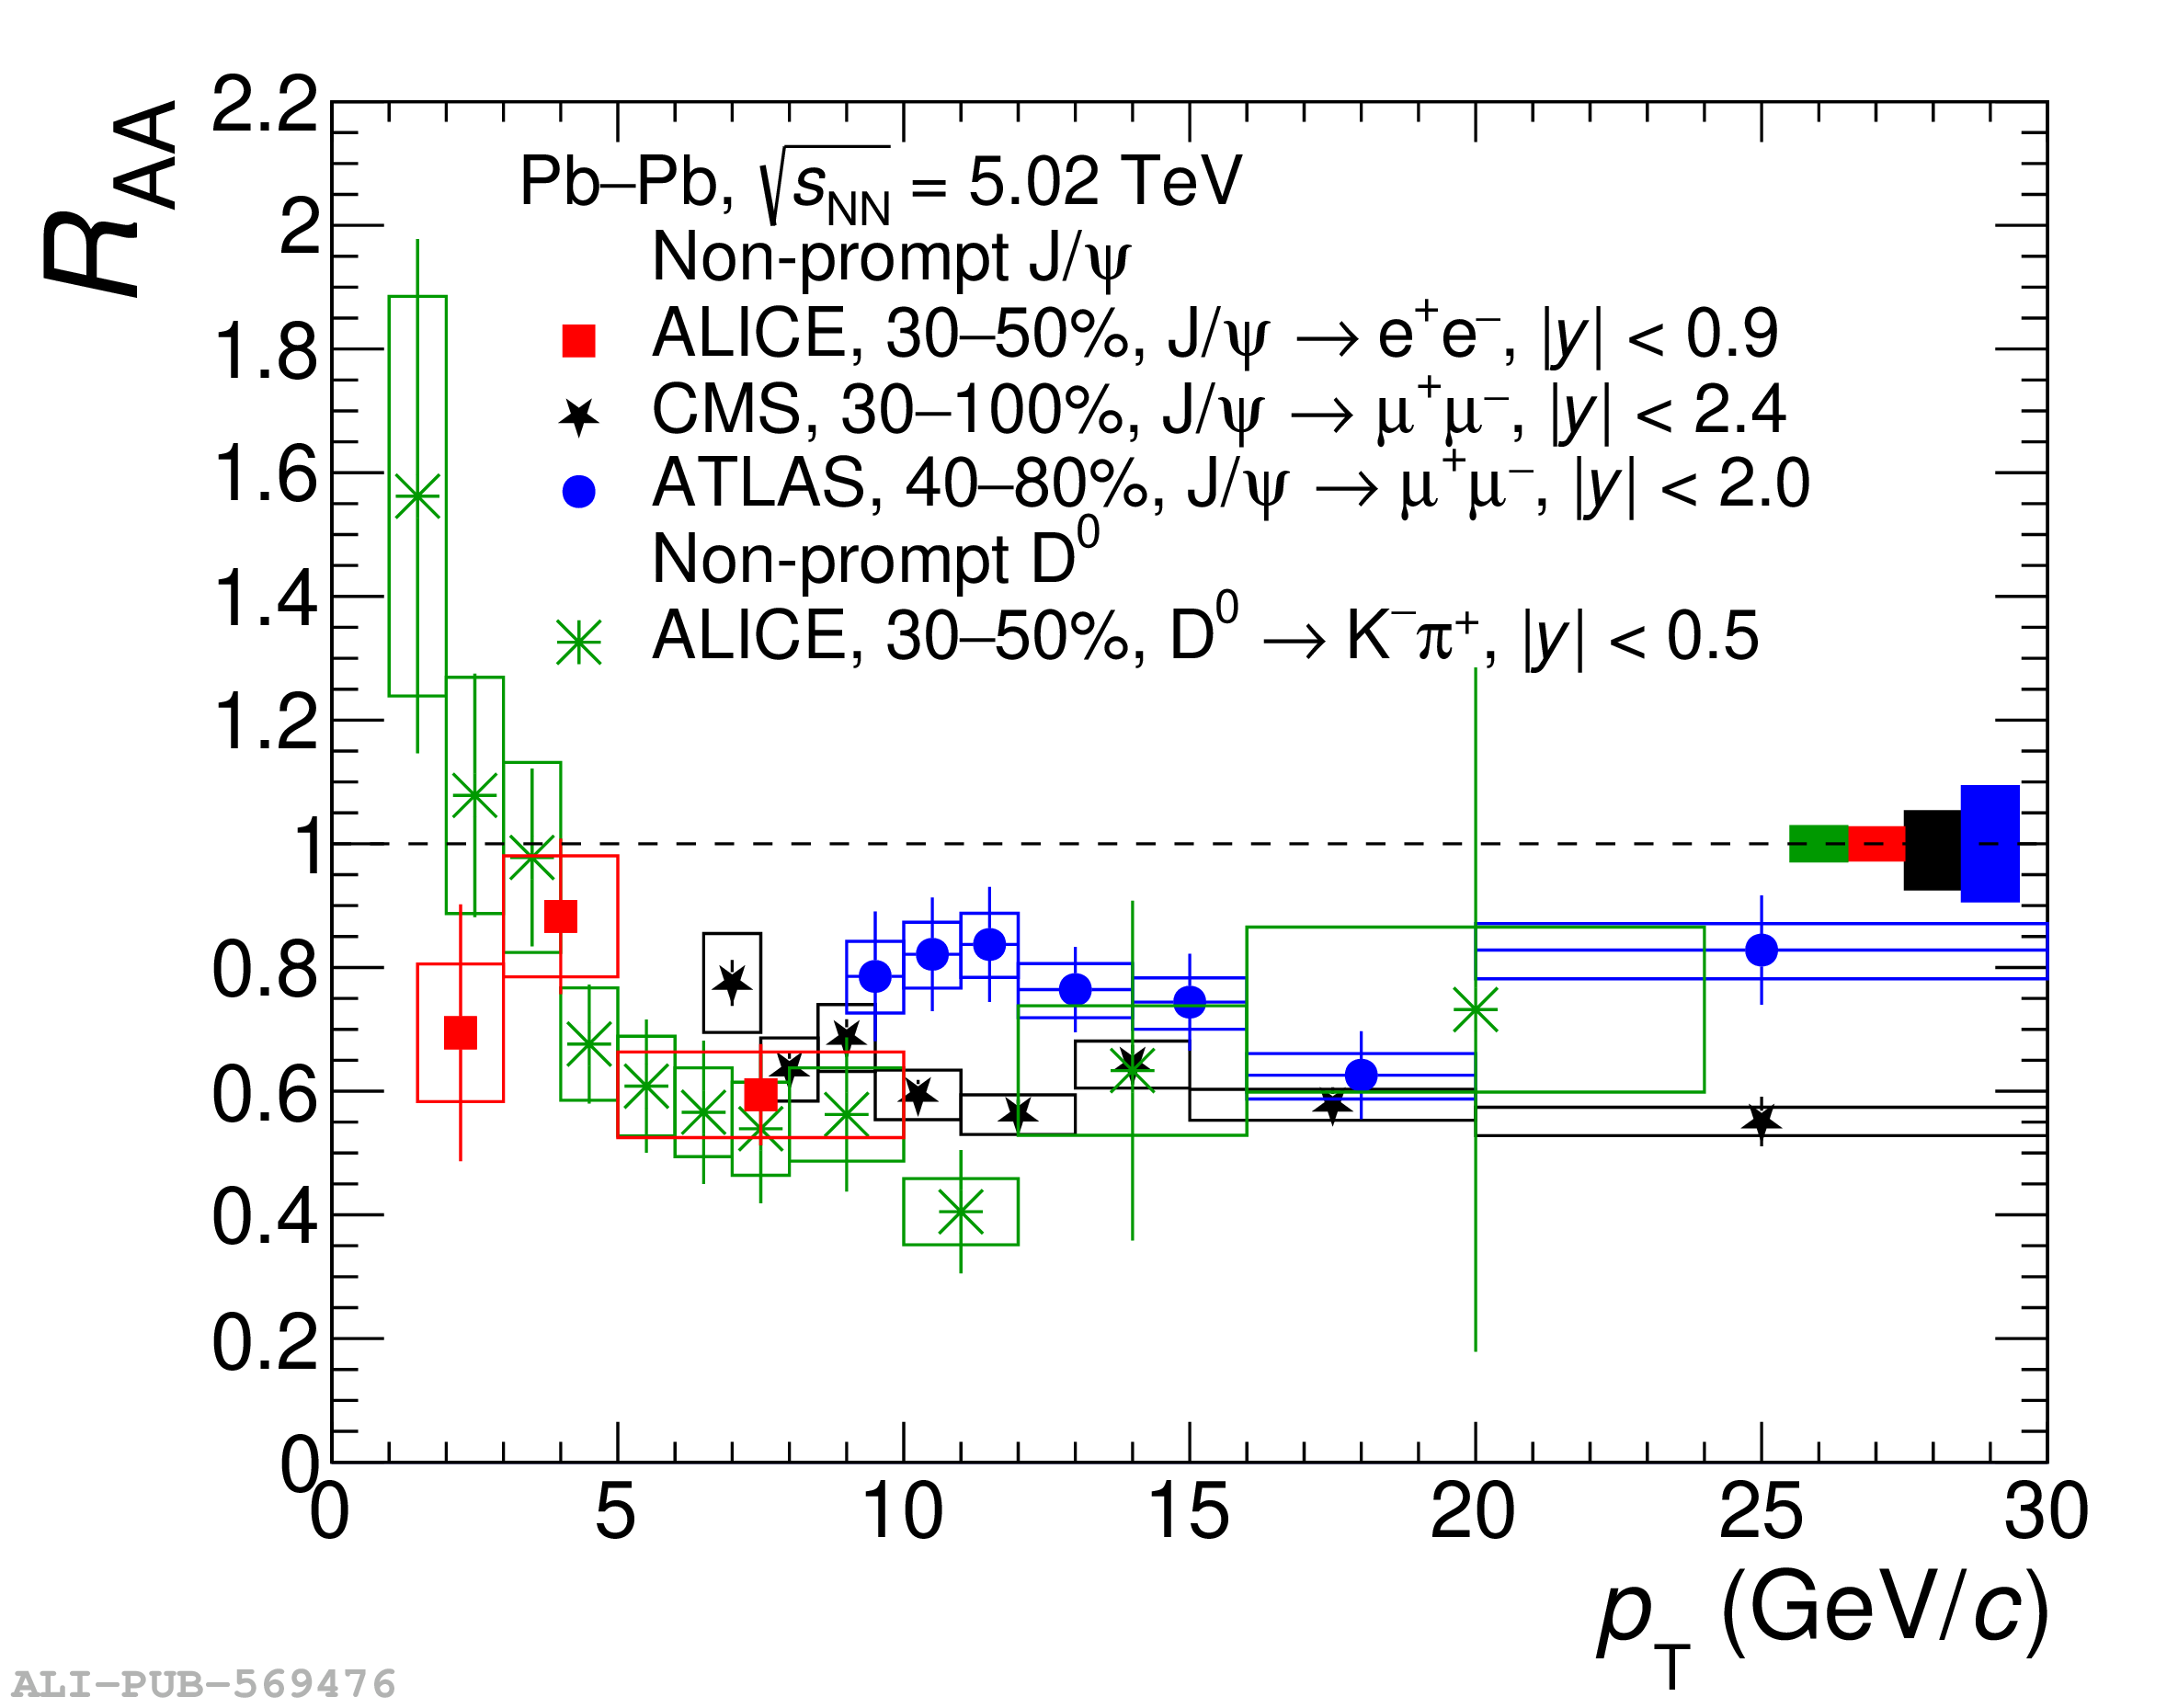
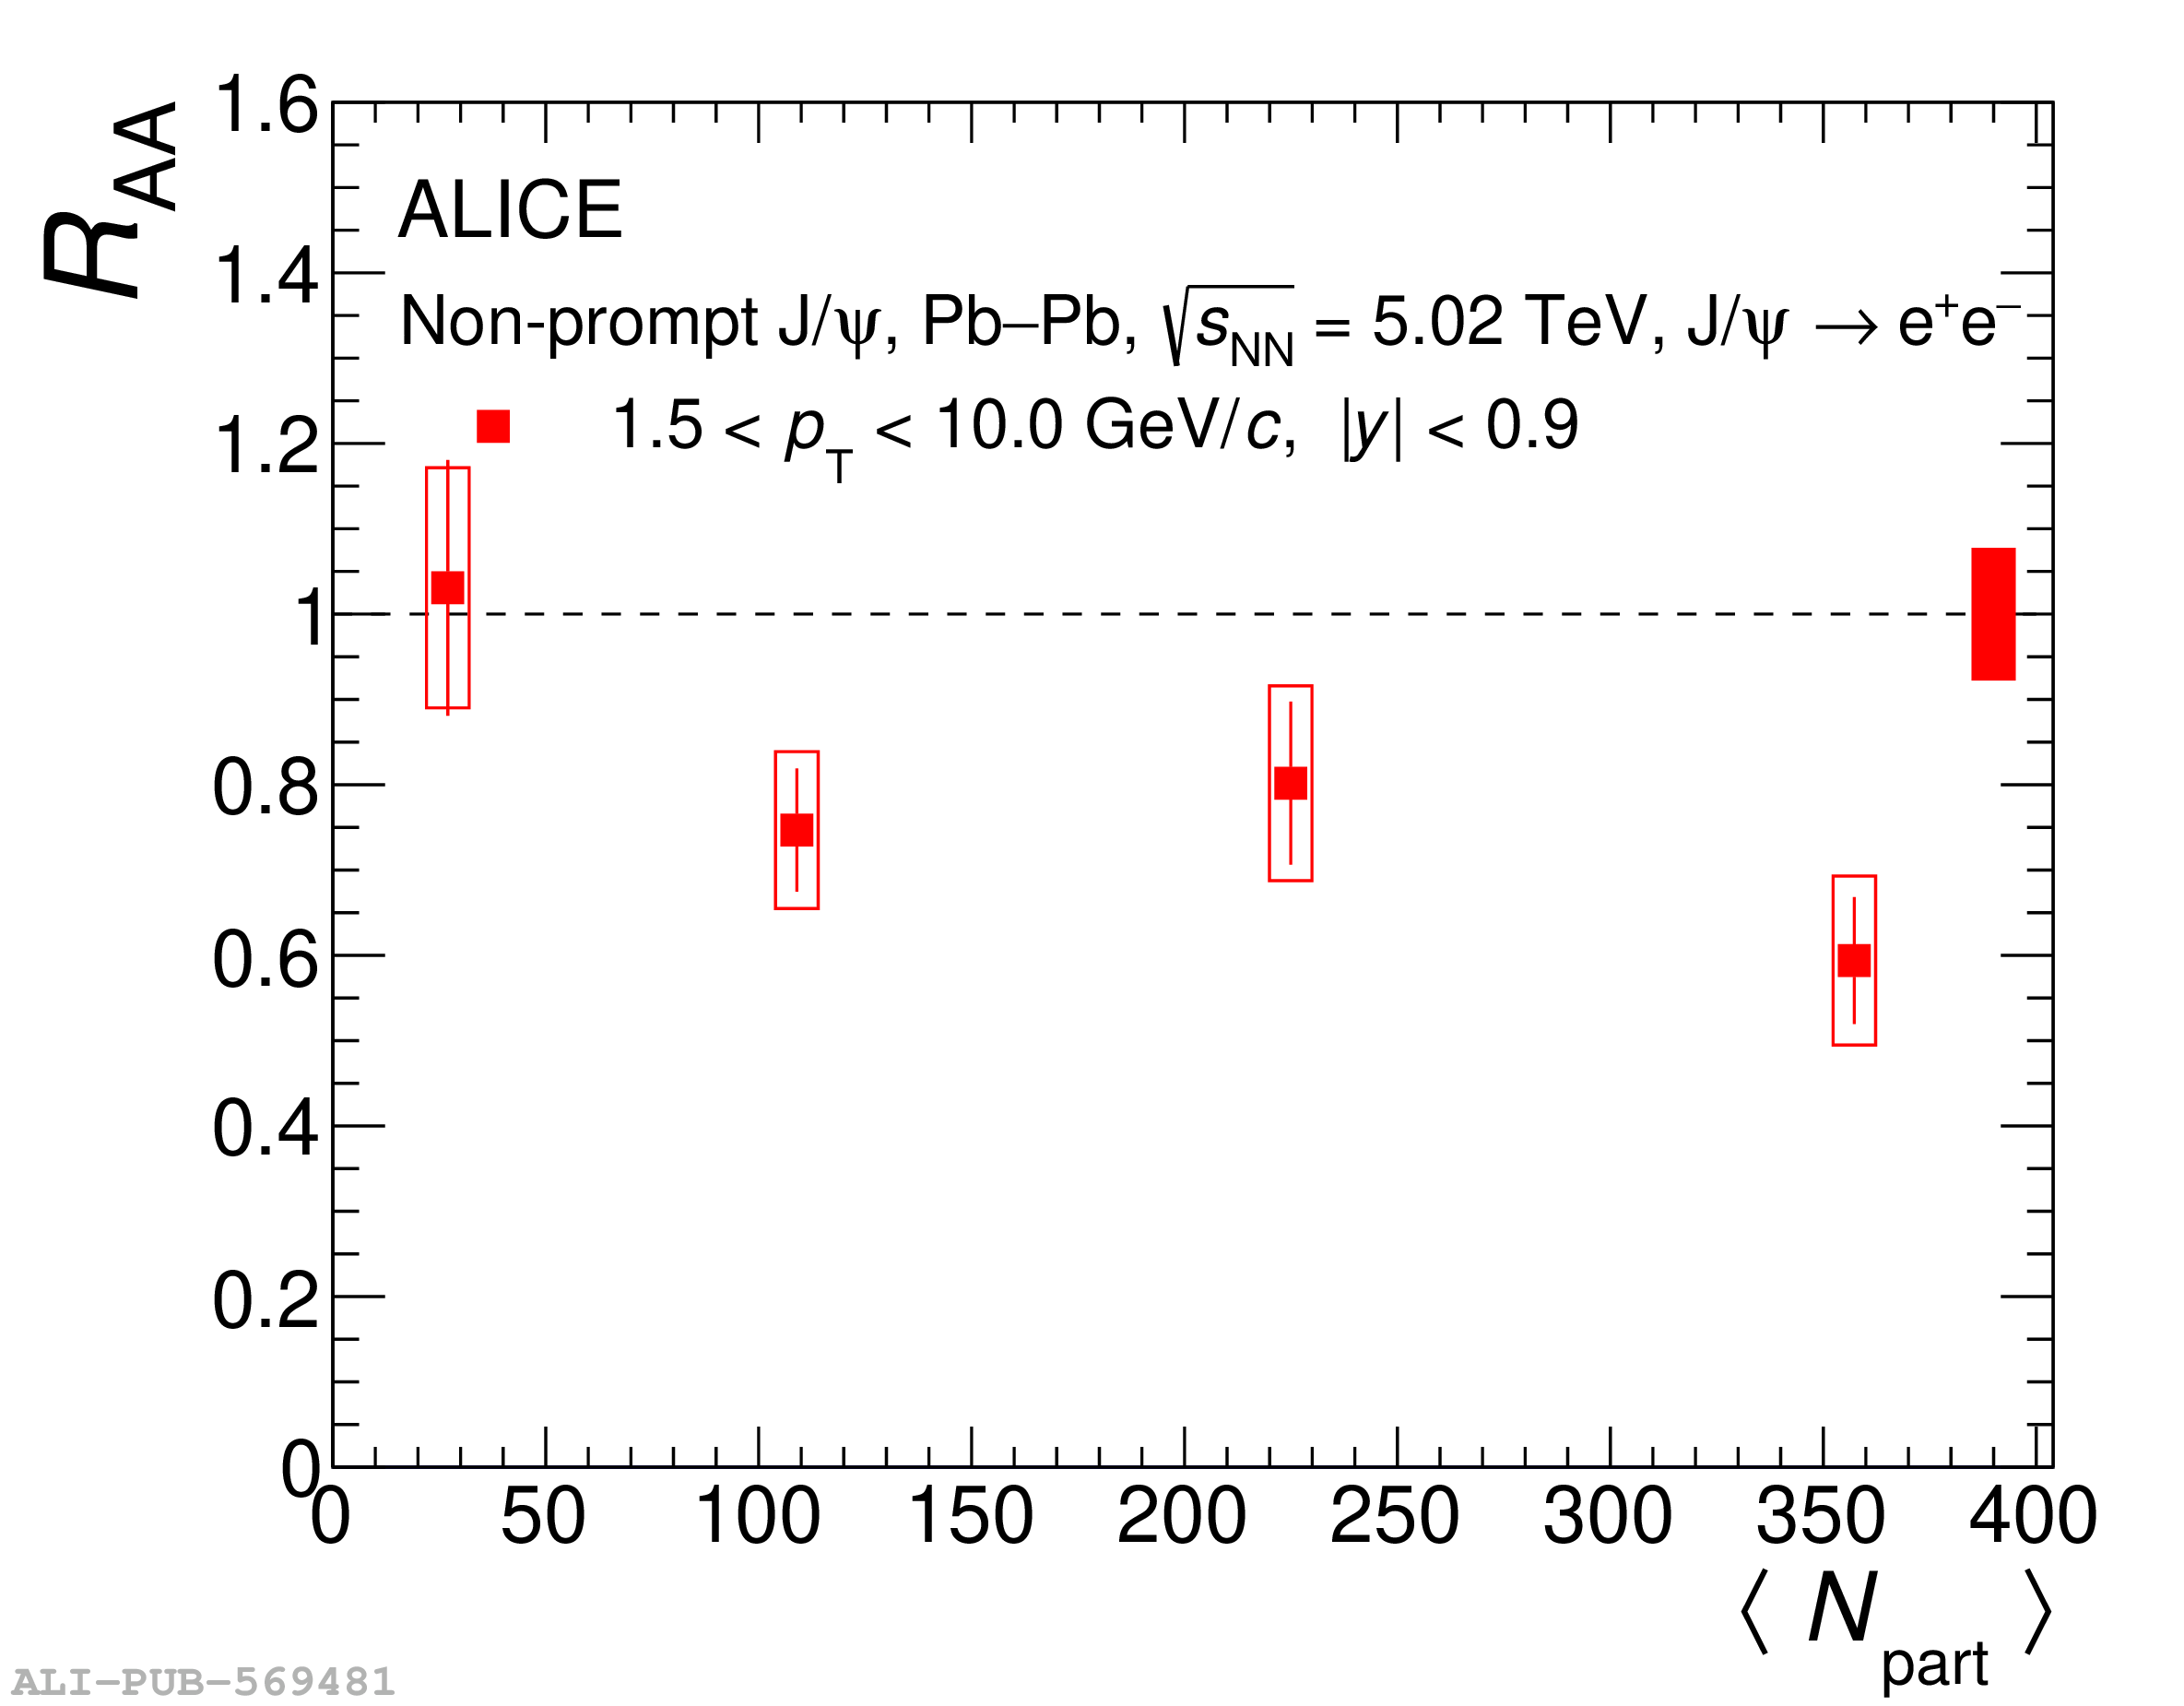
Nuclear modification factor of non-prompt $\jpsi$ as a function of $\pt$ in the 0--10\% (upper left panel), 10--30\% (top right panel) and 30--50\% (bottom left panel). Results are compared with similar measurements from the ATLAS  and CMS  collaborations. Results in 0--10\% and 30--50\% are also compared to non-prompt D$^{0}$ $\RAA$ measurements  in the same centrality classes. The centrality dependent non-prompt $\jpsi$ $\RAA$ in 1.5 $< \pt <$ 10 \GeVc is shown in the bottom right panel (centrality is expressed in terms of average number of participants). Error bars and boxes represent statistical and systematic uncertainties uncorrelated with $\pt$ (centrality, for the bottom right panel). Global uncertainties are shown as boxes around unity.

Figure 7

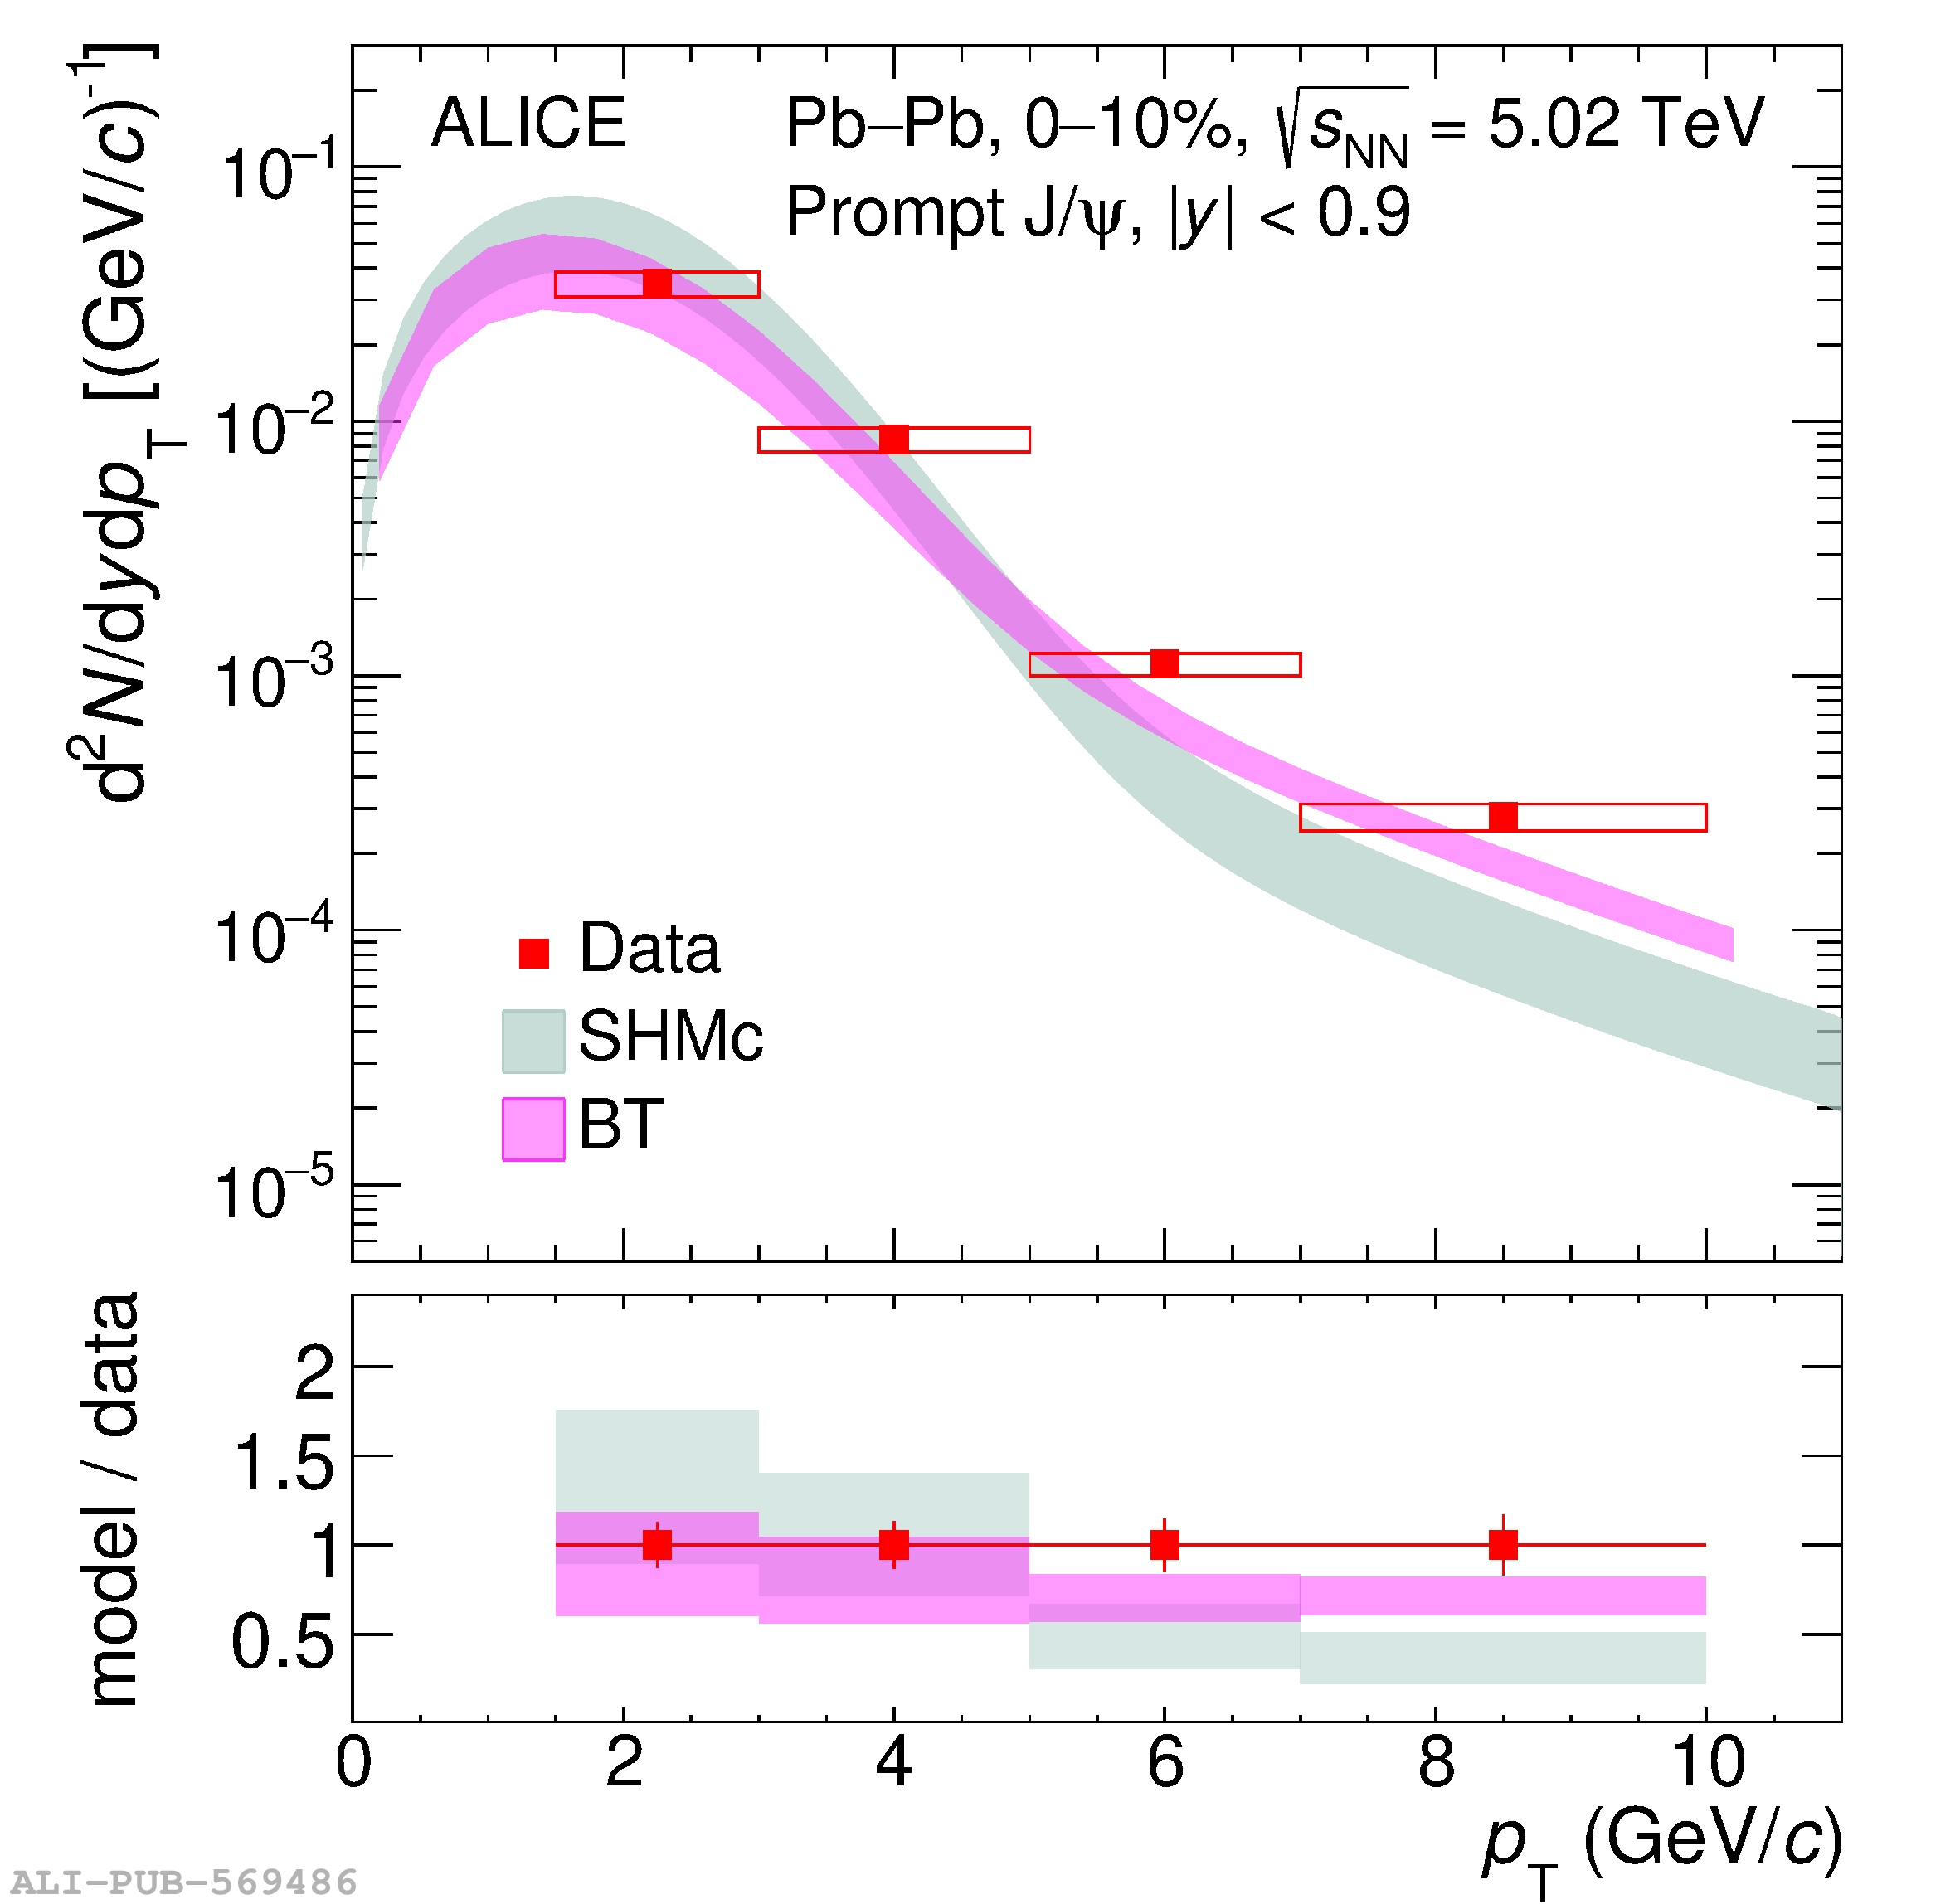
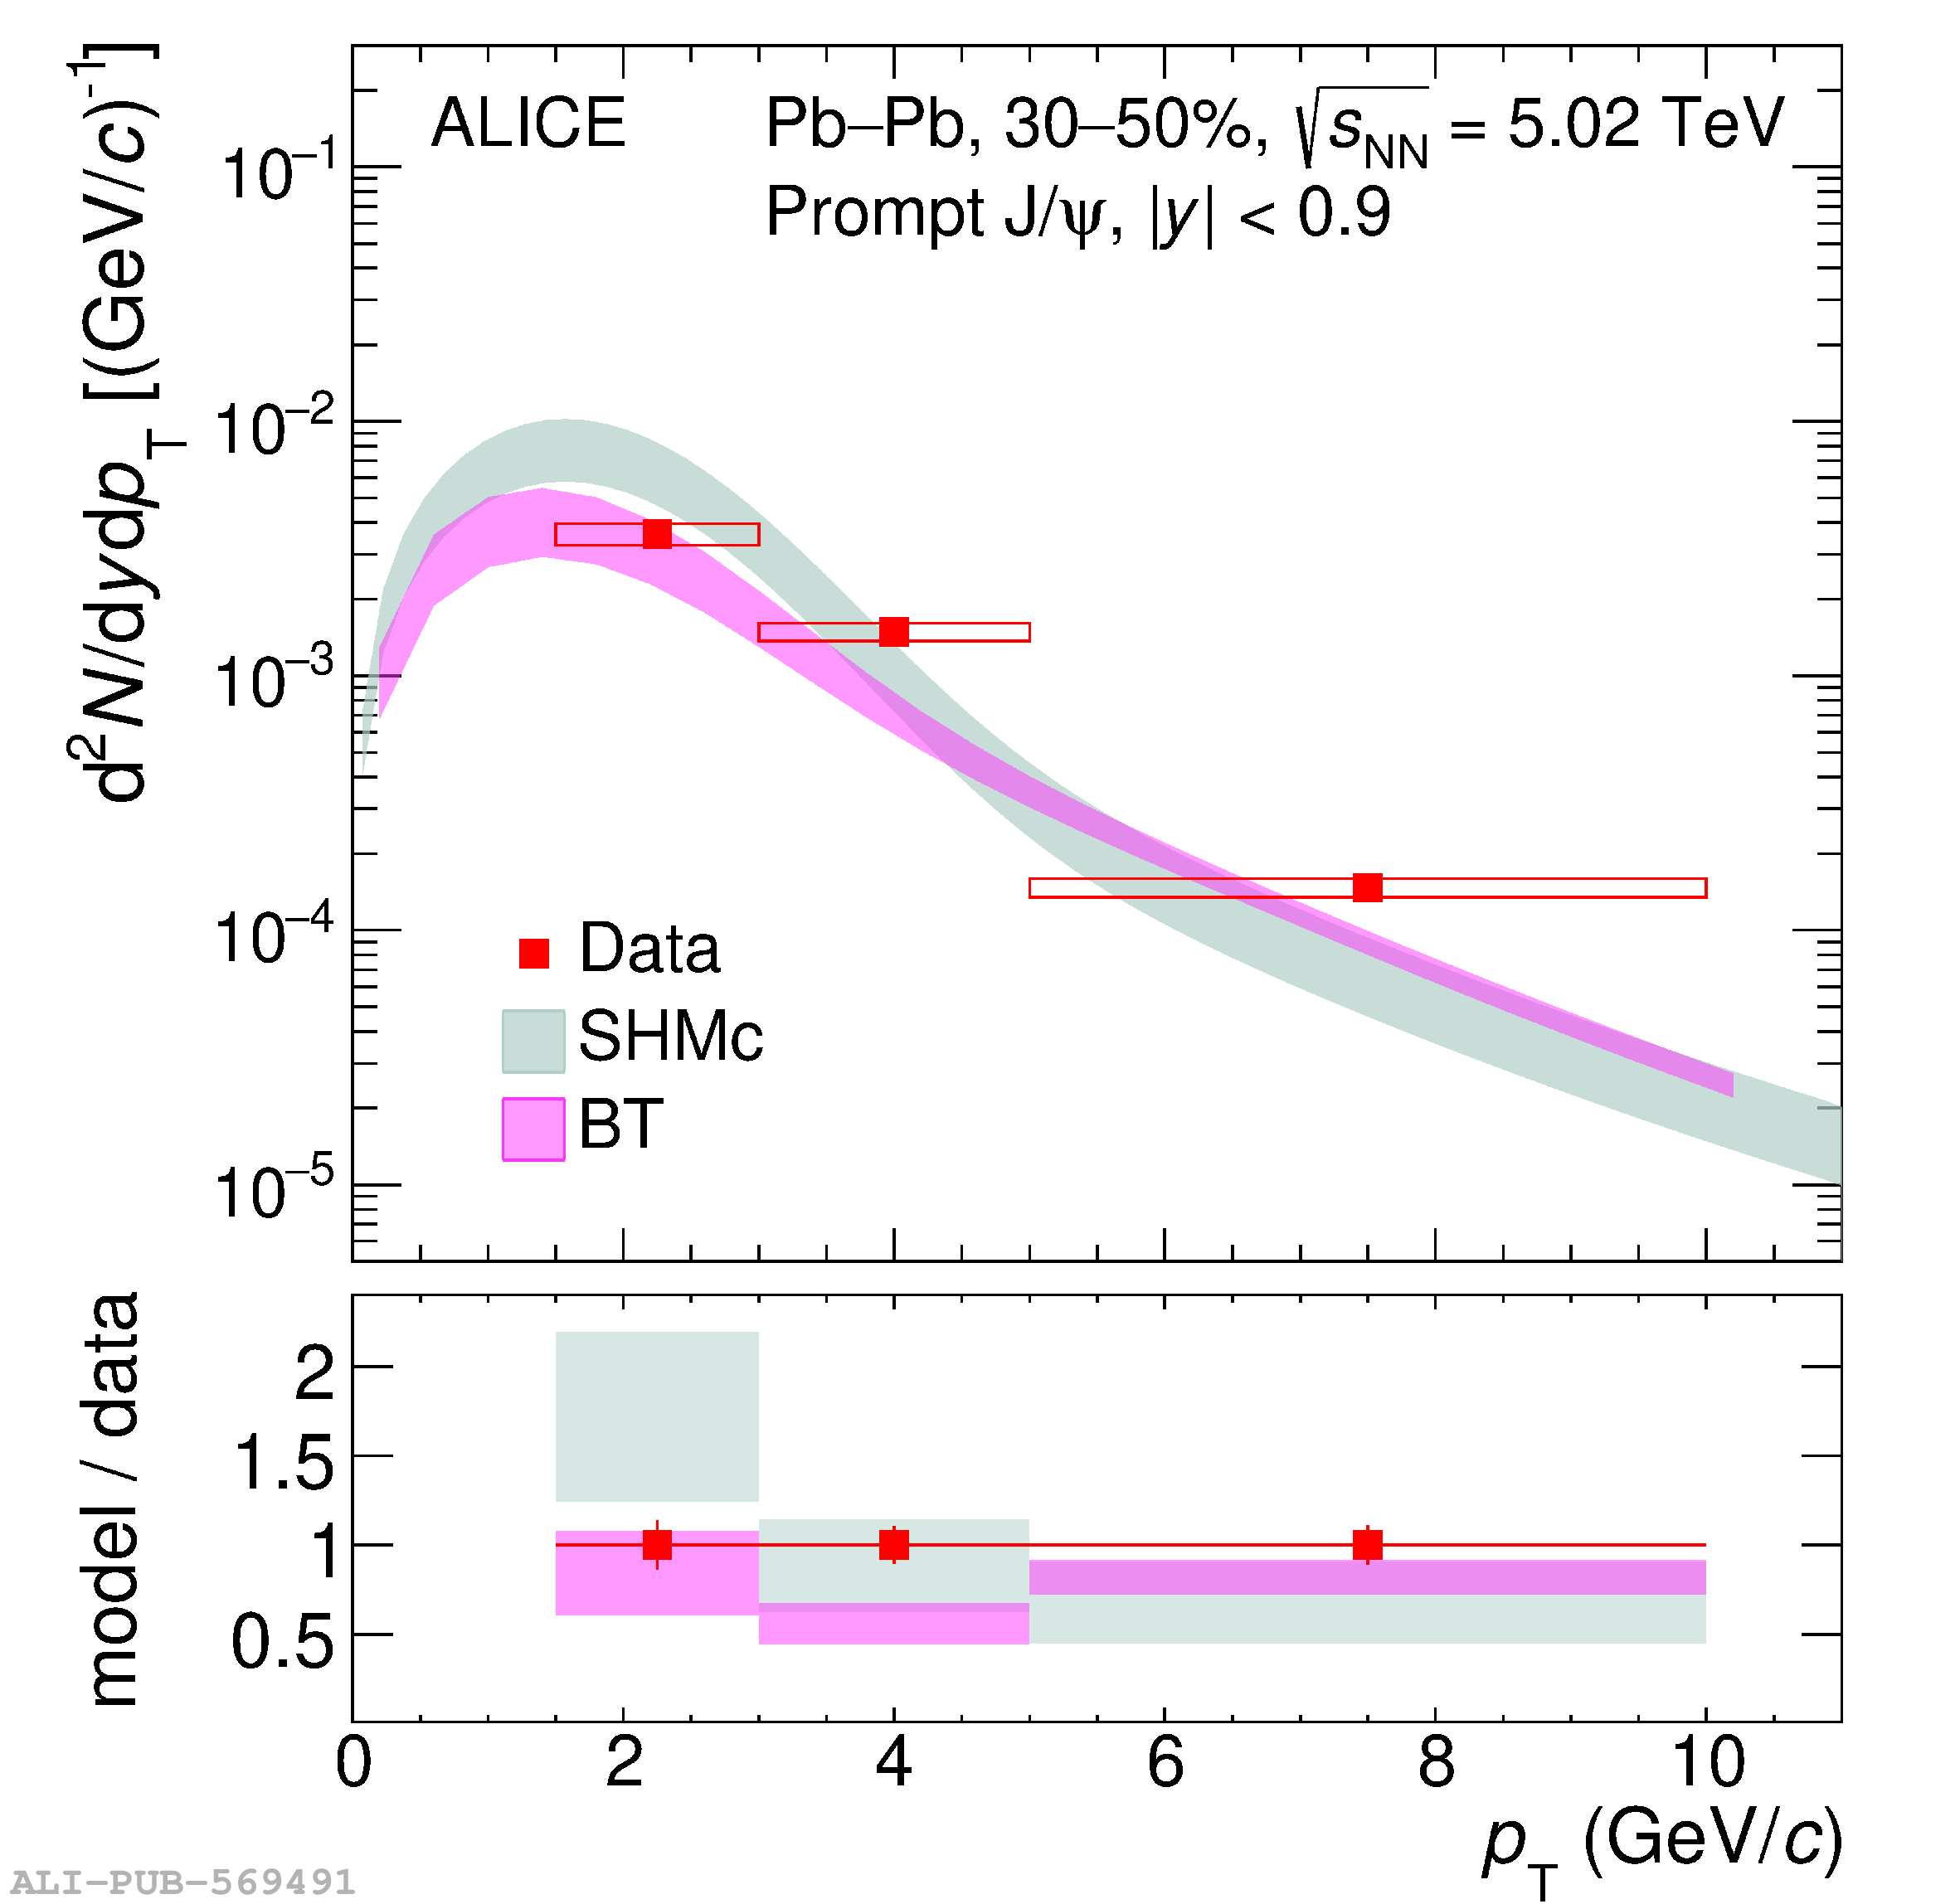
Prompt $\jpsi$ yields as a function of $\pt$ in the 0--10\% (left panel) and 30--50\% (right panel) centrality classes compared with models . Vertical error bars and boxes represent statistical and systematic uncertainties, respectively. Shaded bands in the top panels represent model uncertainties. Bottom panels show the ratios between models and data, with the bands representing the relative uncertainties of the models. Error bars around unity are the quadratic sum of statistical and systematic uncertainties on the measured yields.

Figure 8

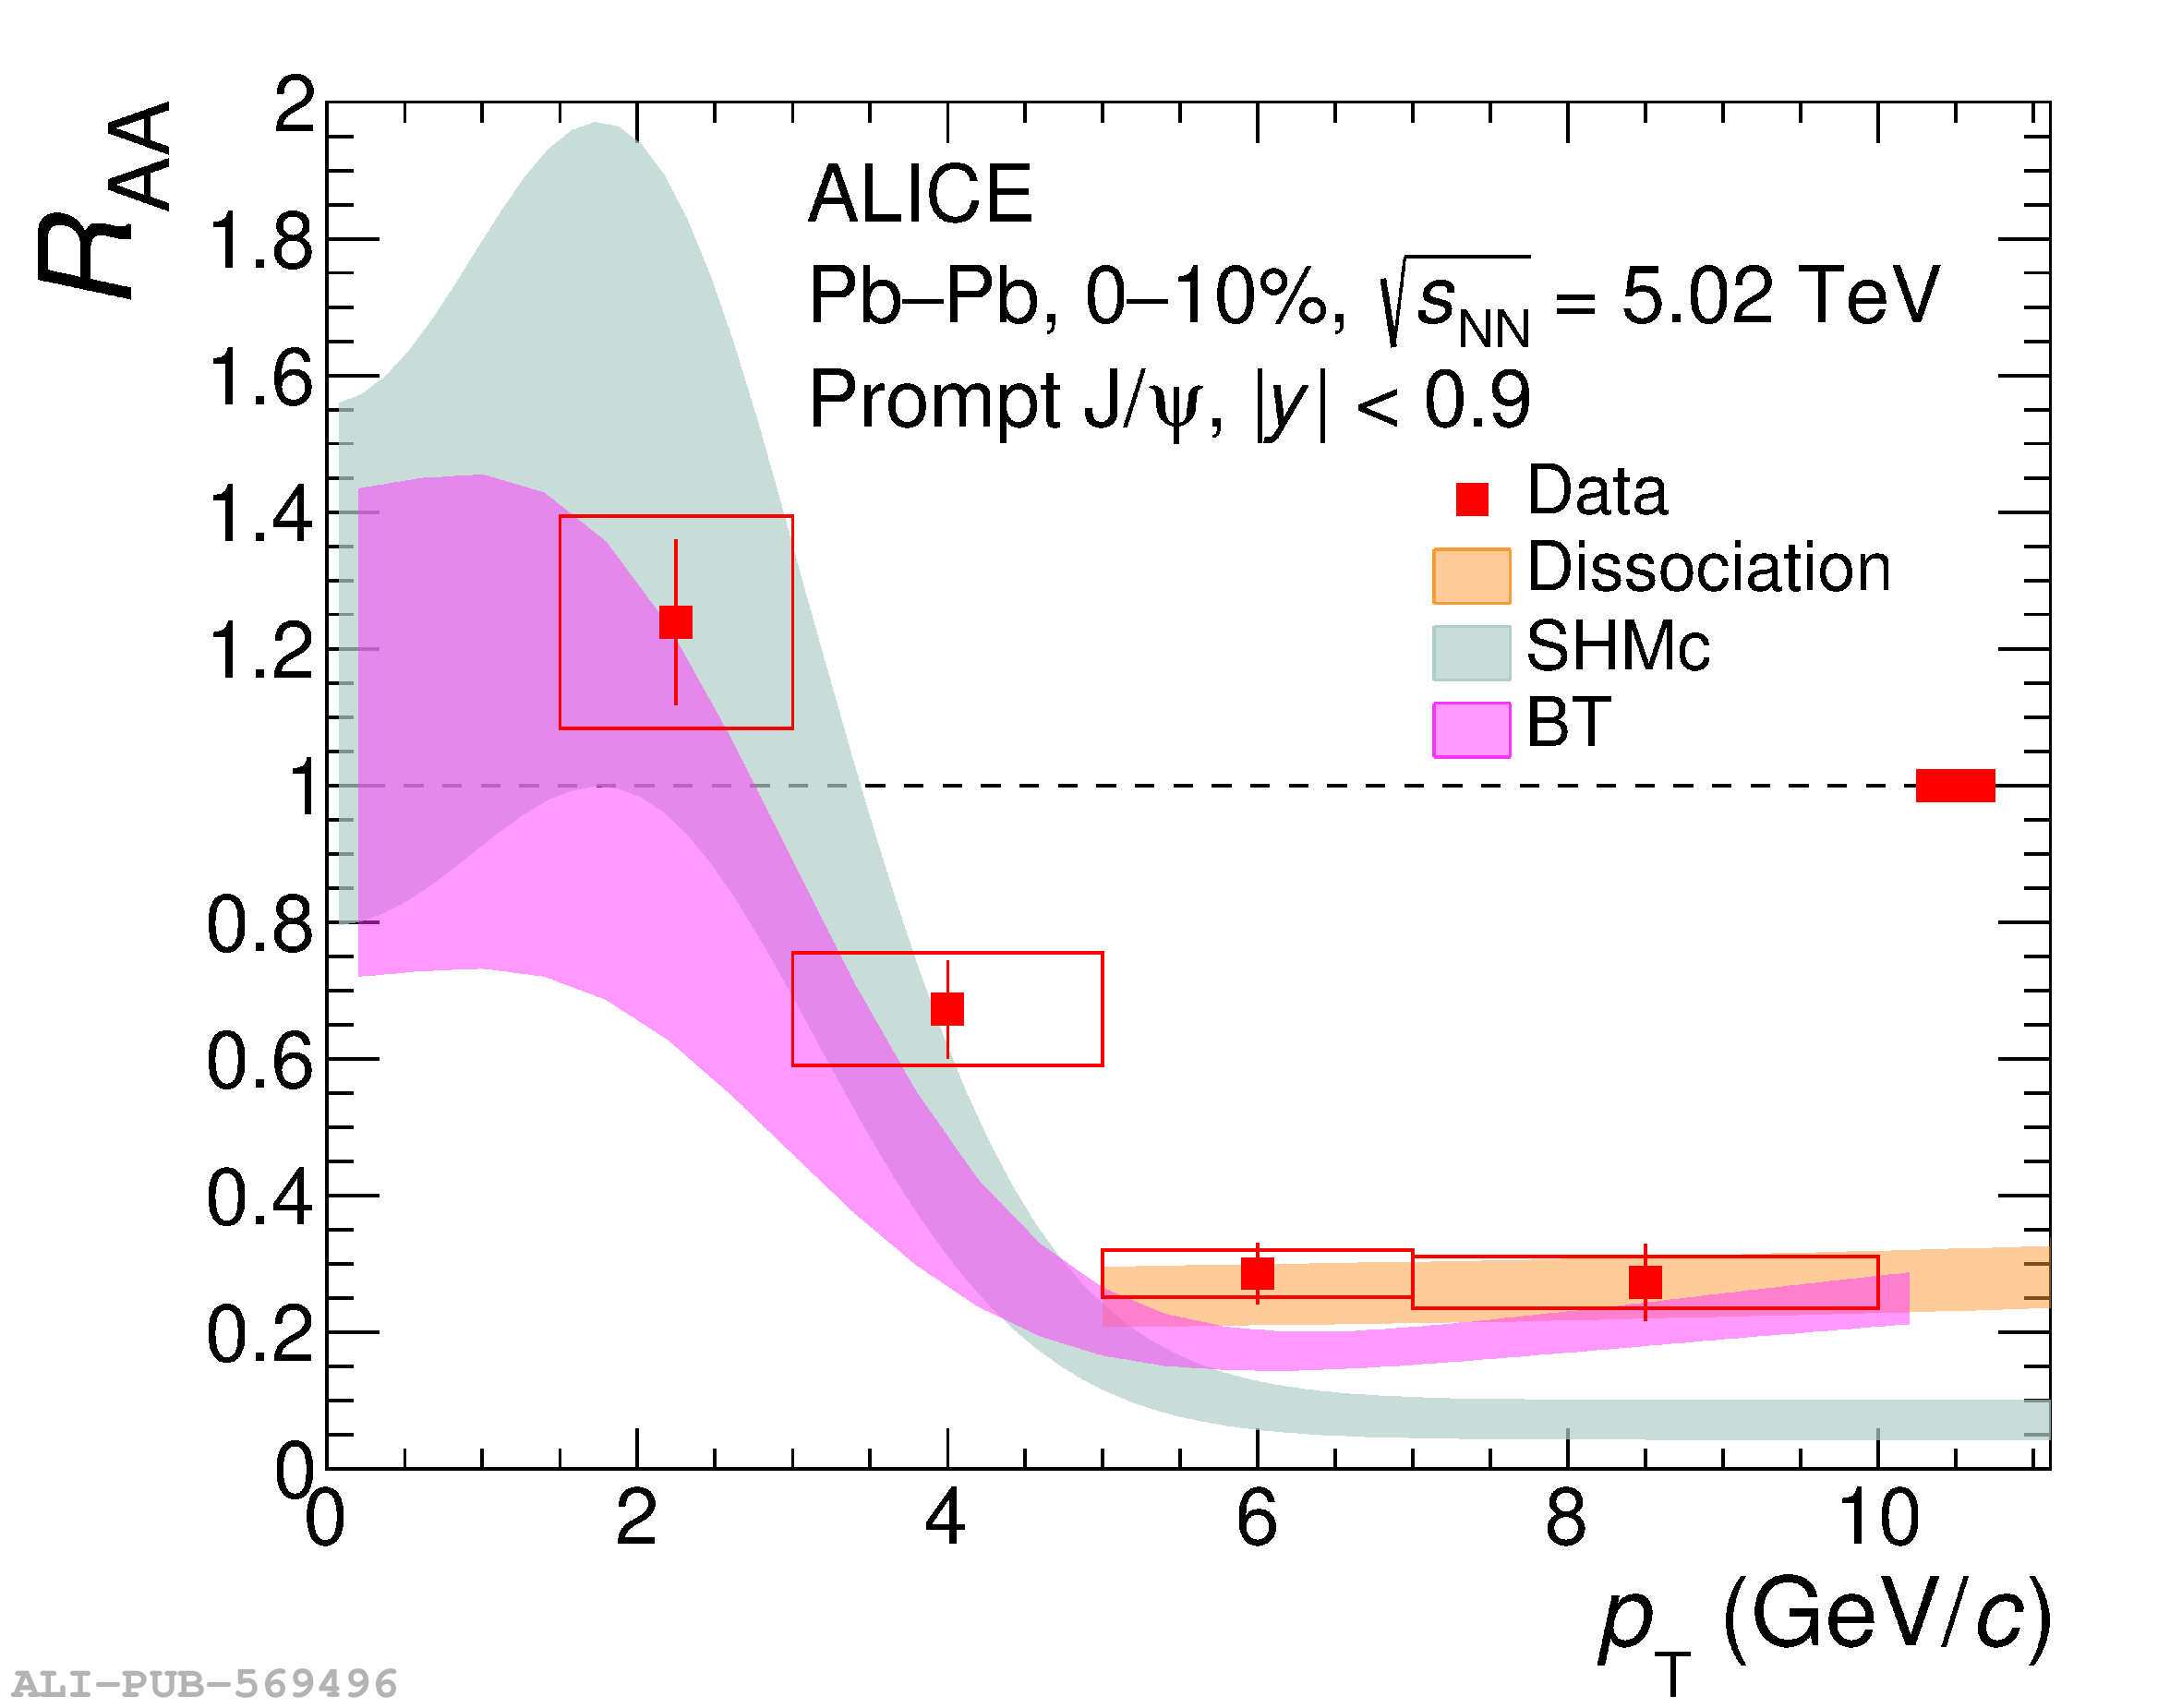
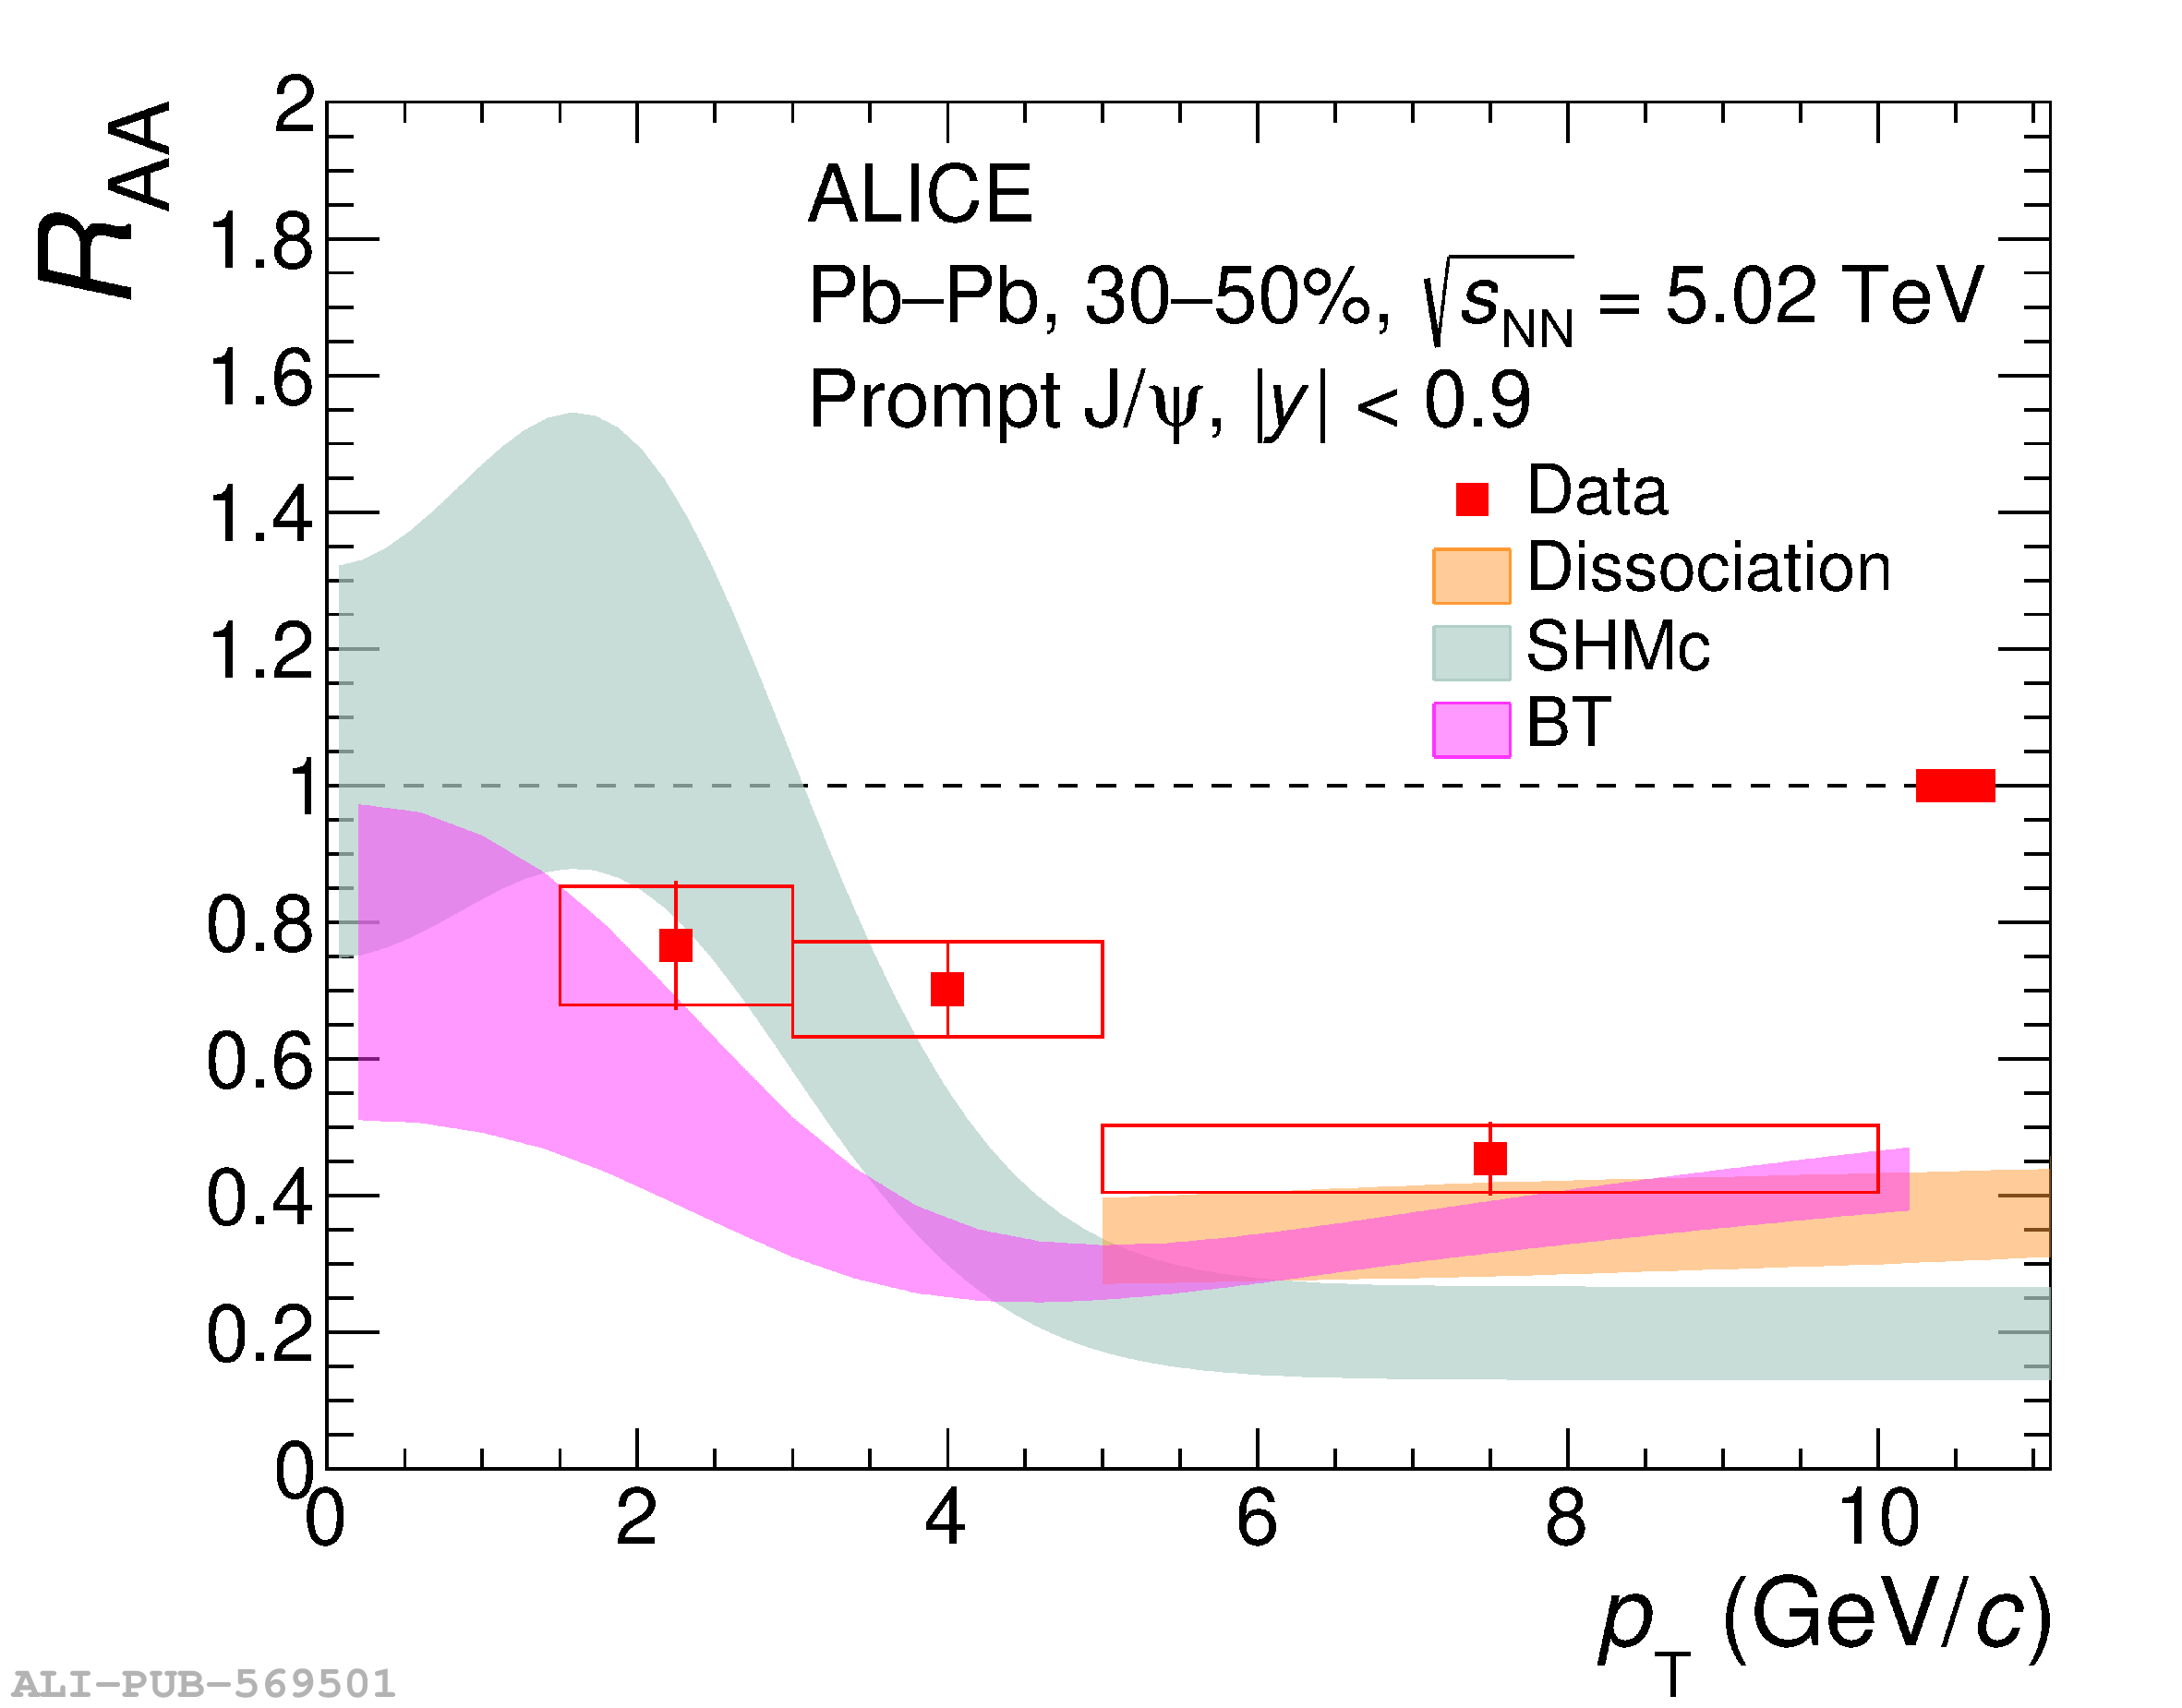
Prompt $\jpsi$ $\RAA$ as a function of $\pt$ in the 0--10\% (left panel) and 30--50\% (right panel) centrality classes compared with models . Error bars and boxes represent statistical and uncorrelated systematic uncertainties, respectively. Shaded bands represent model uncertainties. The global uncertainty is shown around unity.

Figure 9

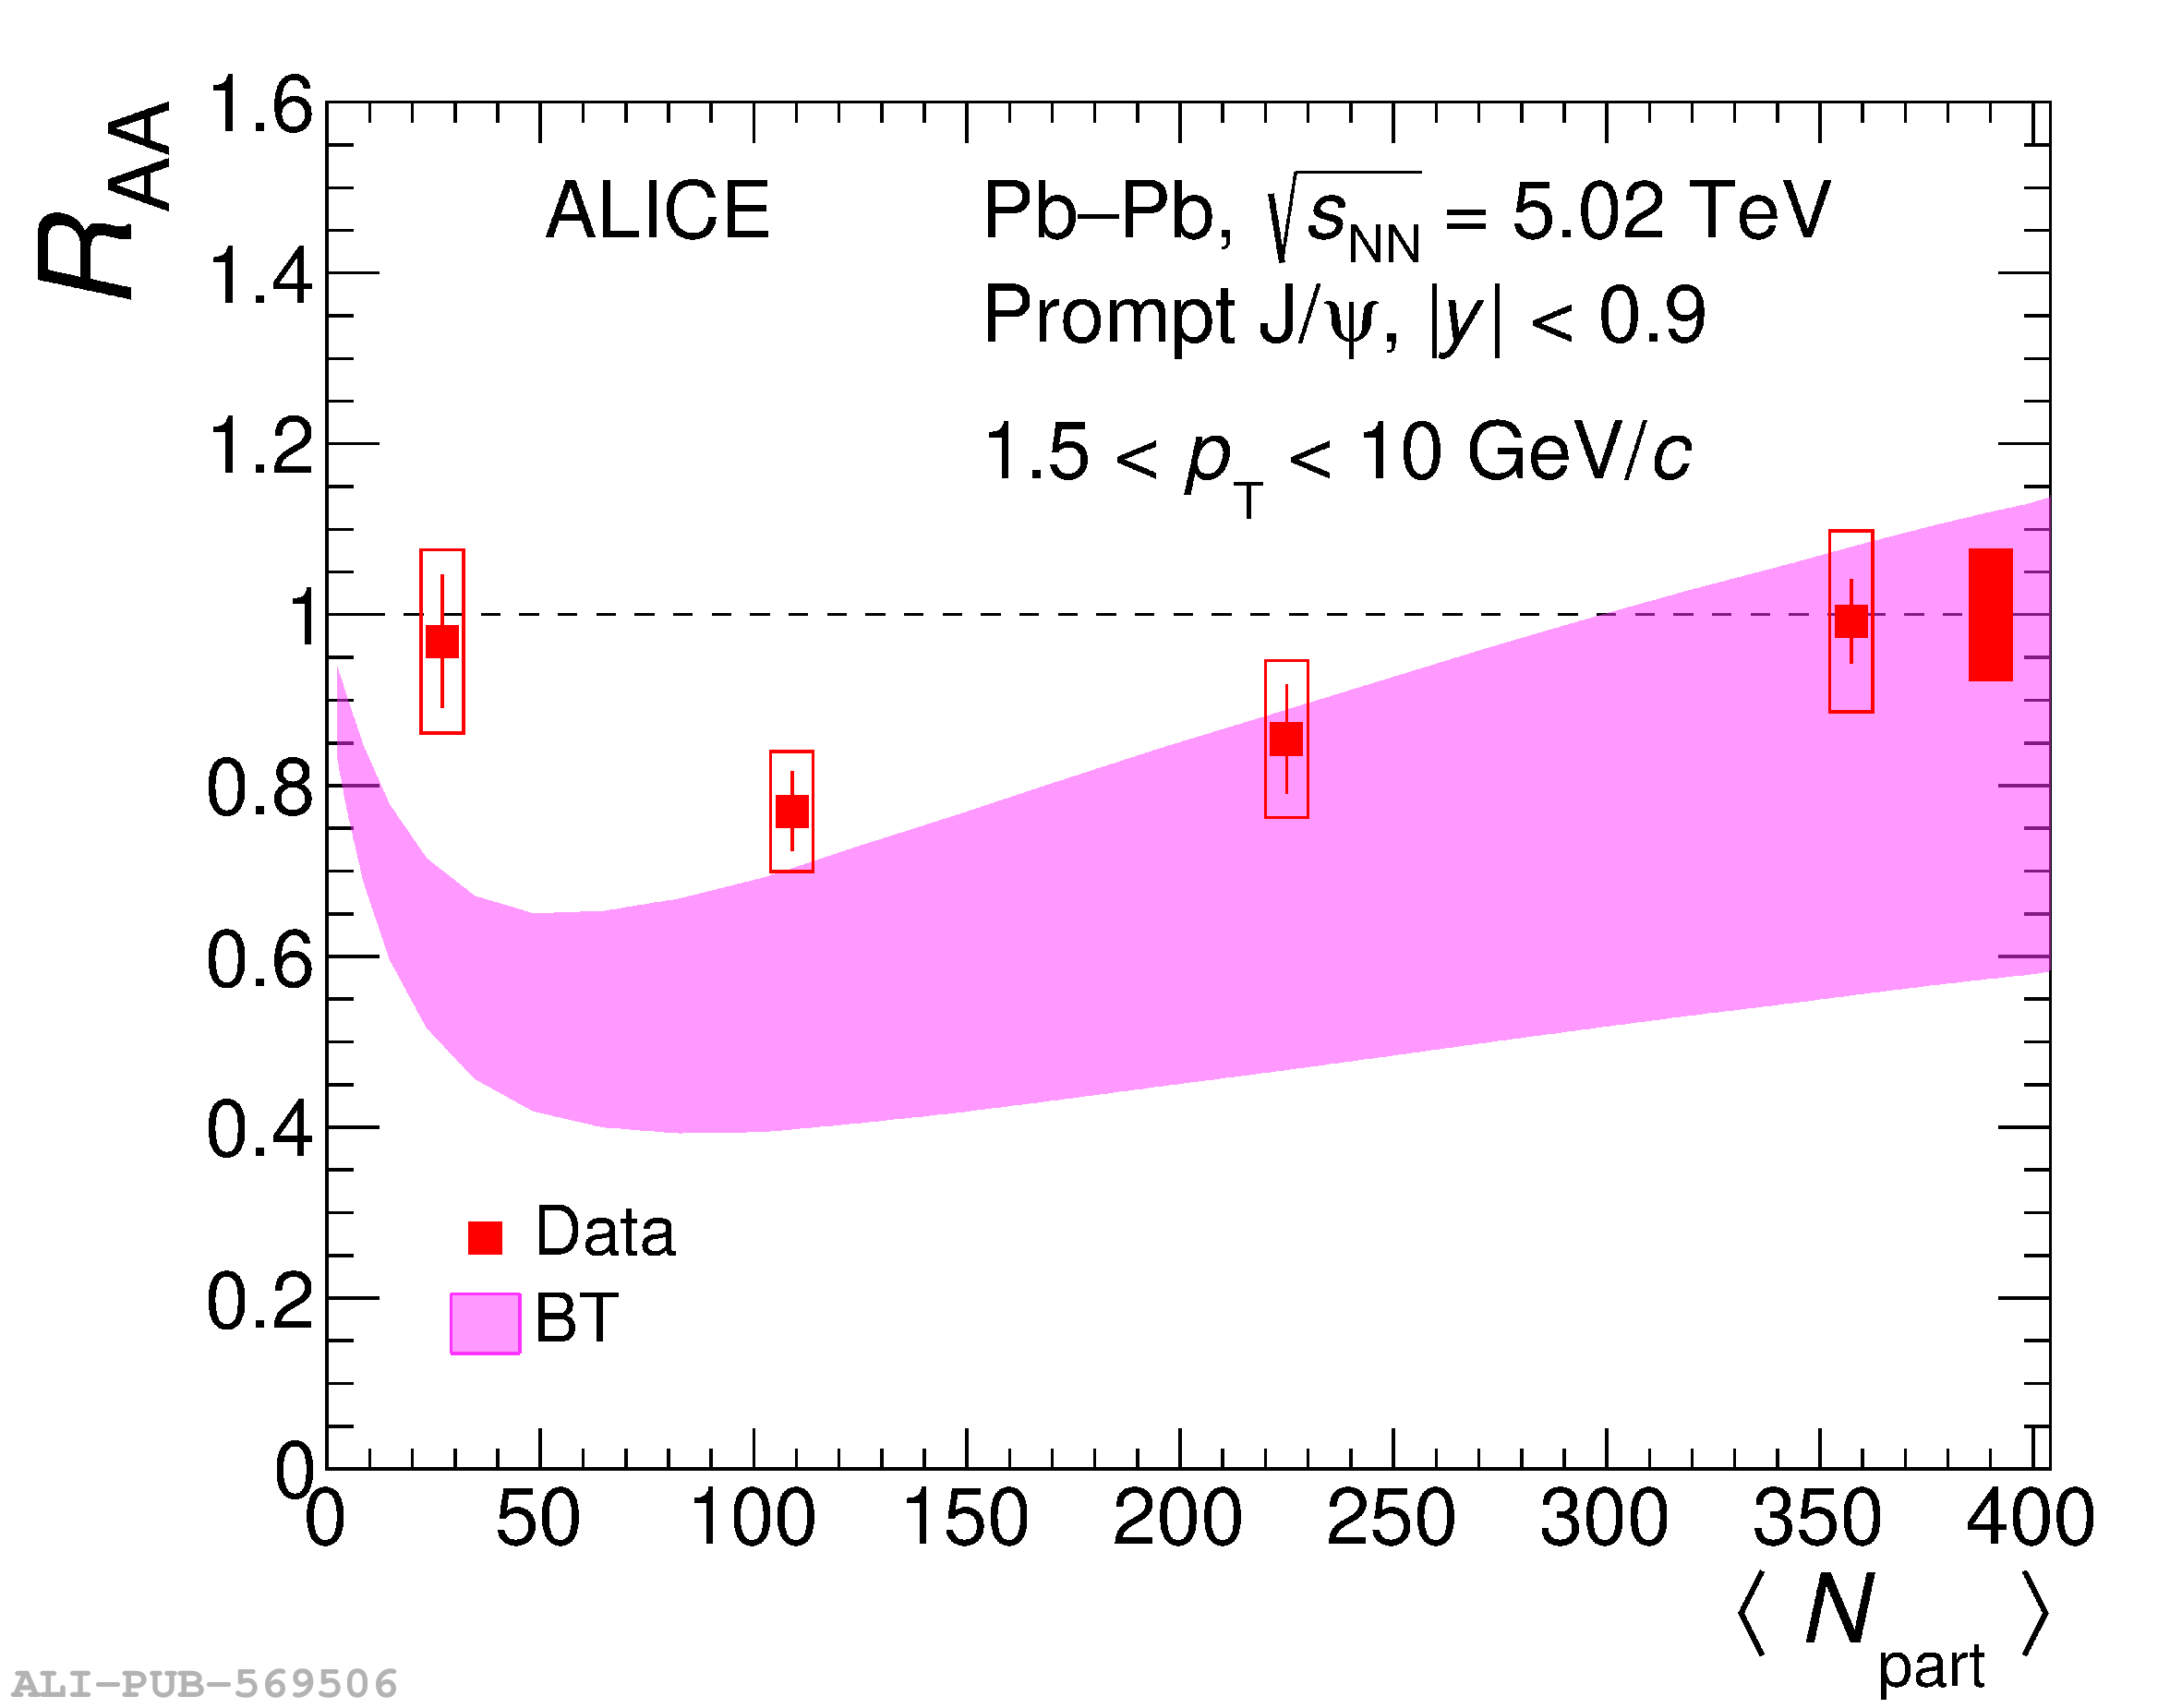
Centrality dependence (expressed in terms of average number of participants) of prompt $\jpsi$ $\RAA$ measured by ALICE in Pb-Pb collisions at $\snn$ = 5.02 TeV in the transverse momentum interval 1.5 $< \pt <$ 10 GeV/$c$. Results are compared with the BT model by Zhuang {\it et al.} . Error bars and boxes represent statistical and uncorrelated systematic uncertainties, respectively. Shaded bands represent model uncertainties. The global uncertainty is shown around unity.

Figure 10

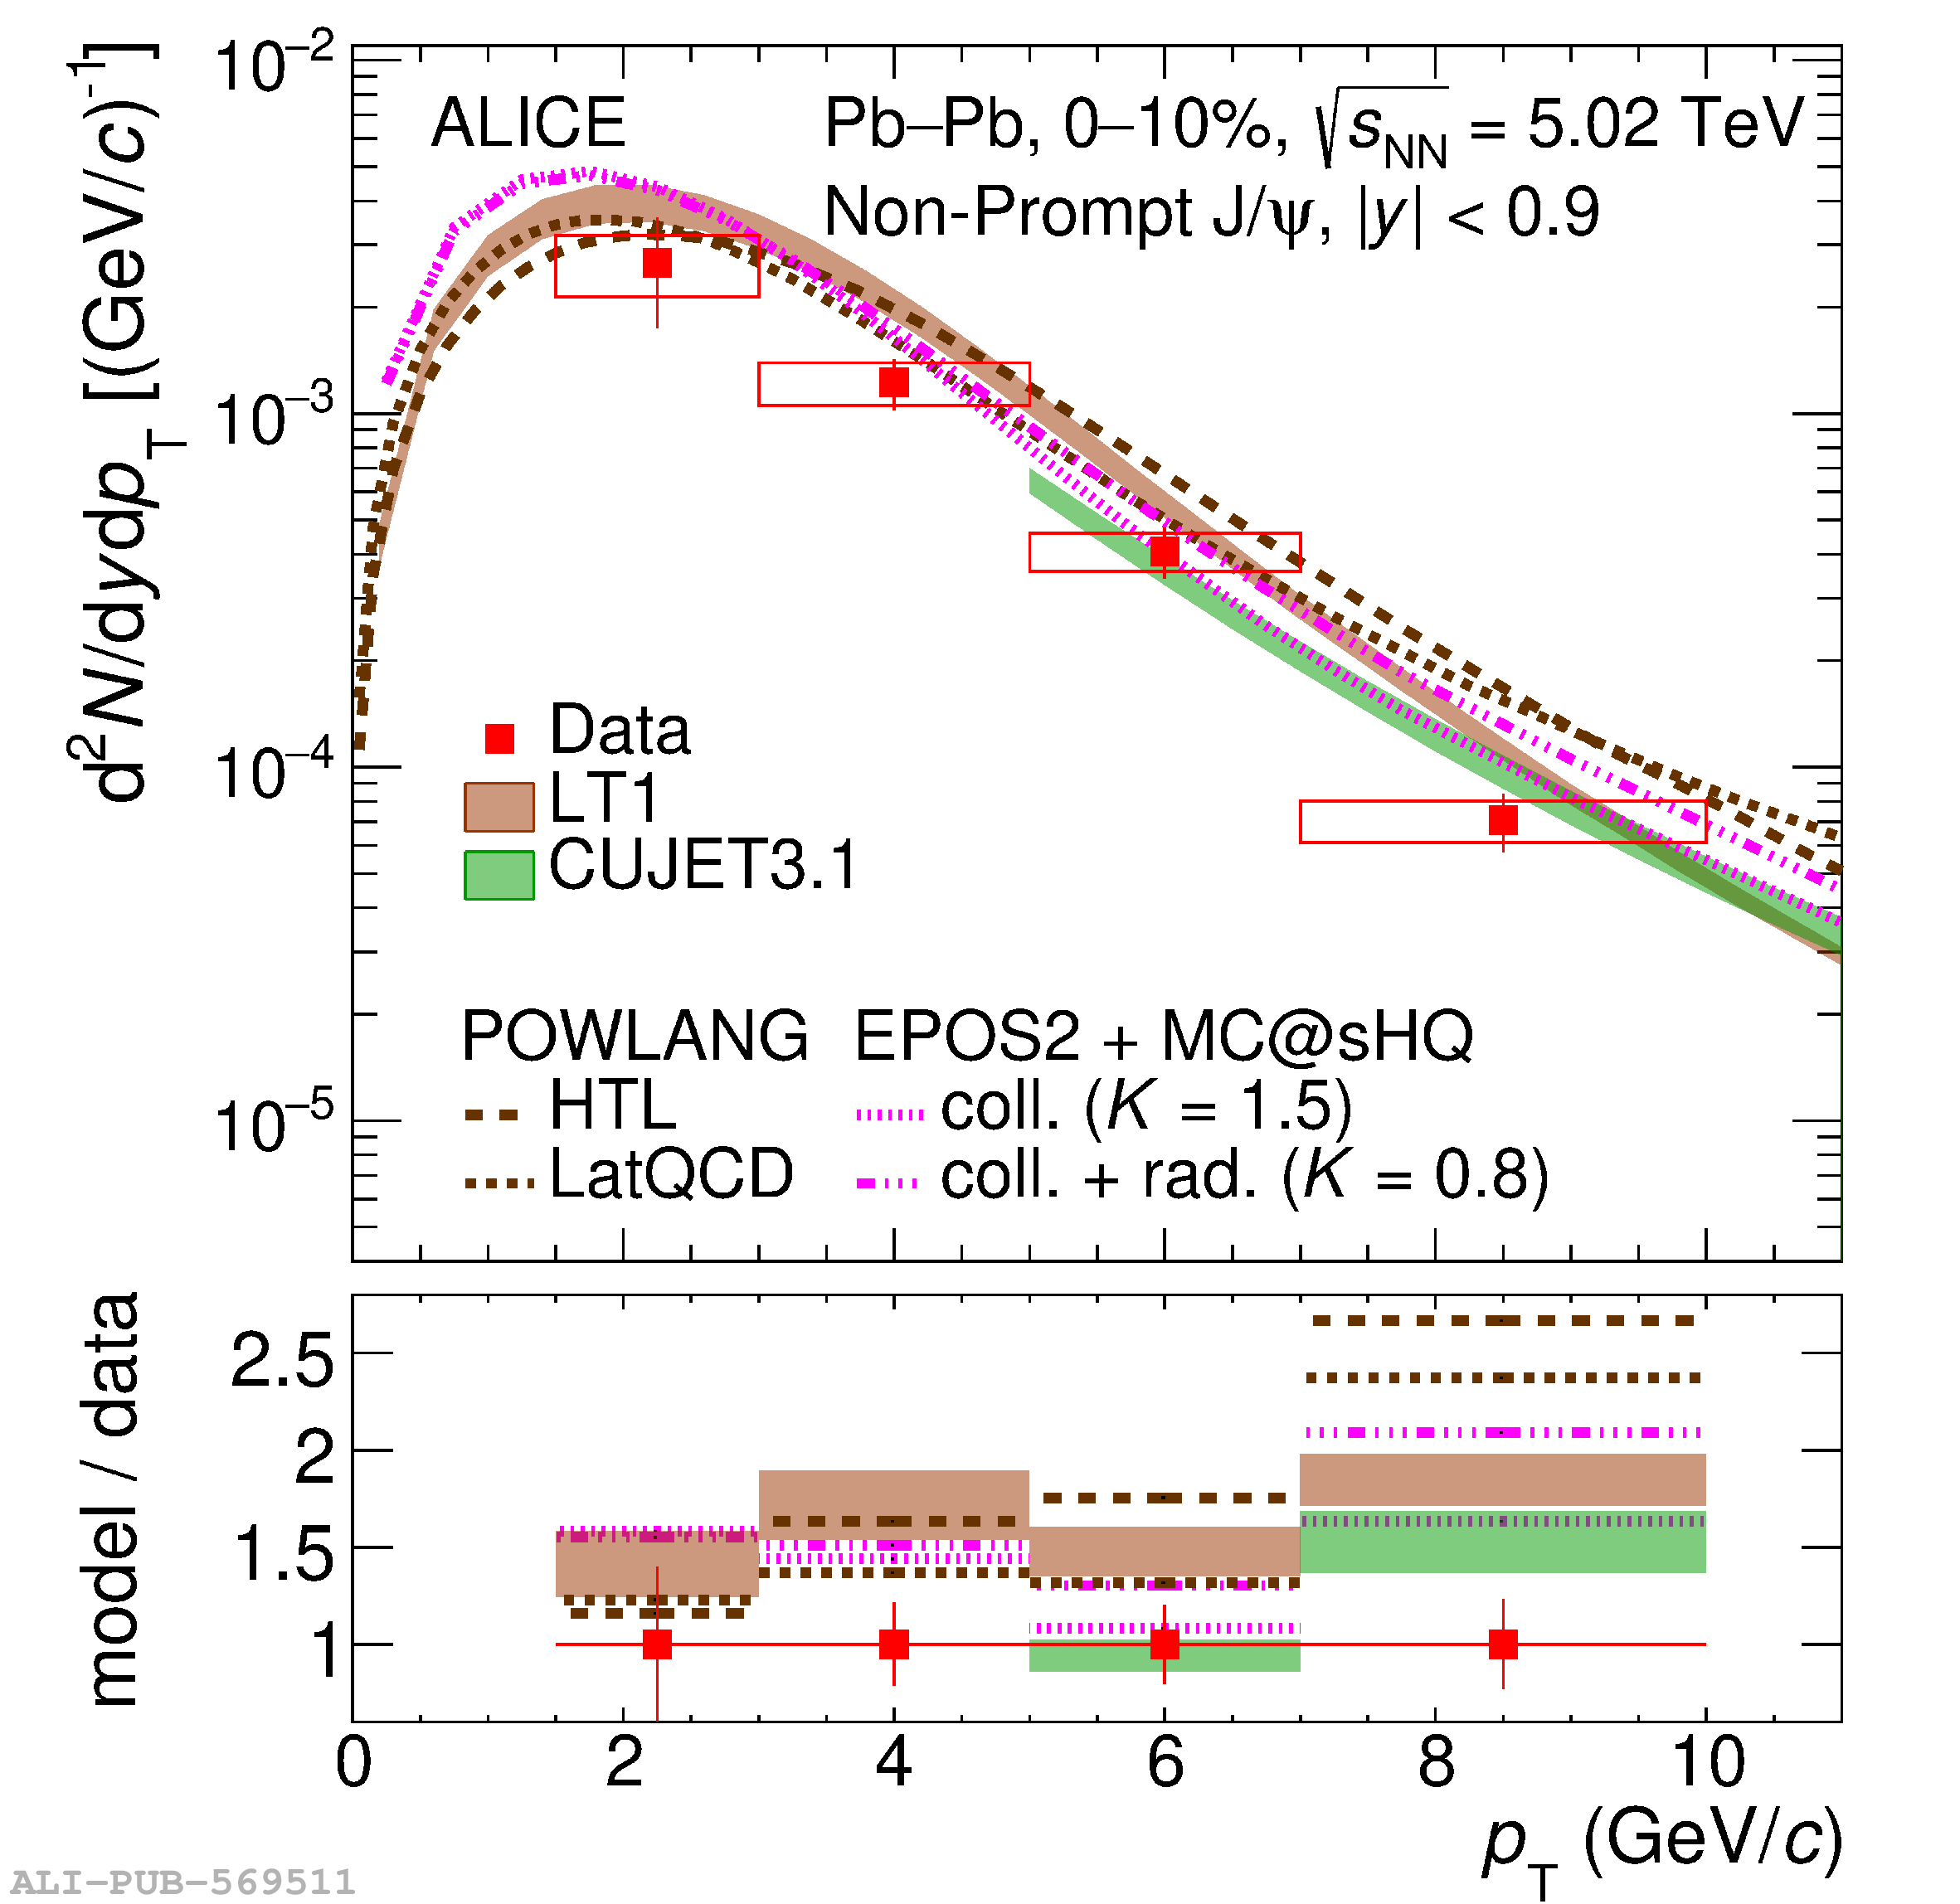
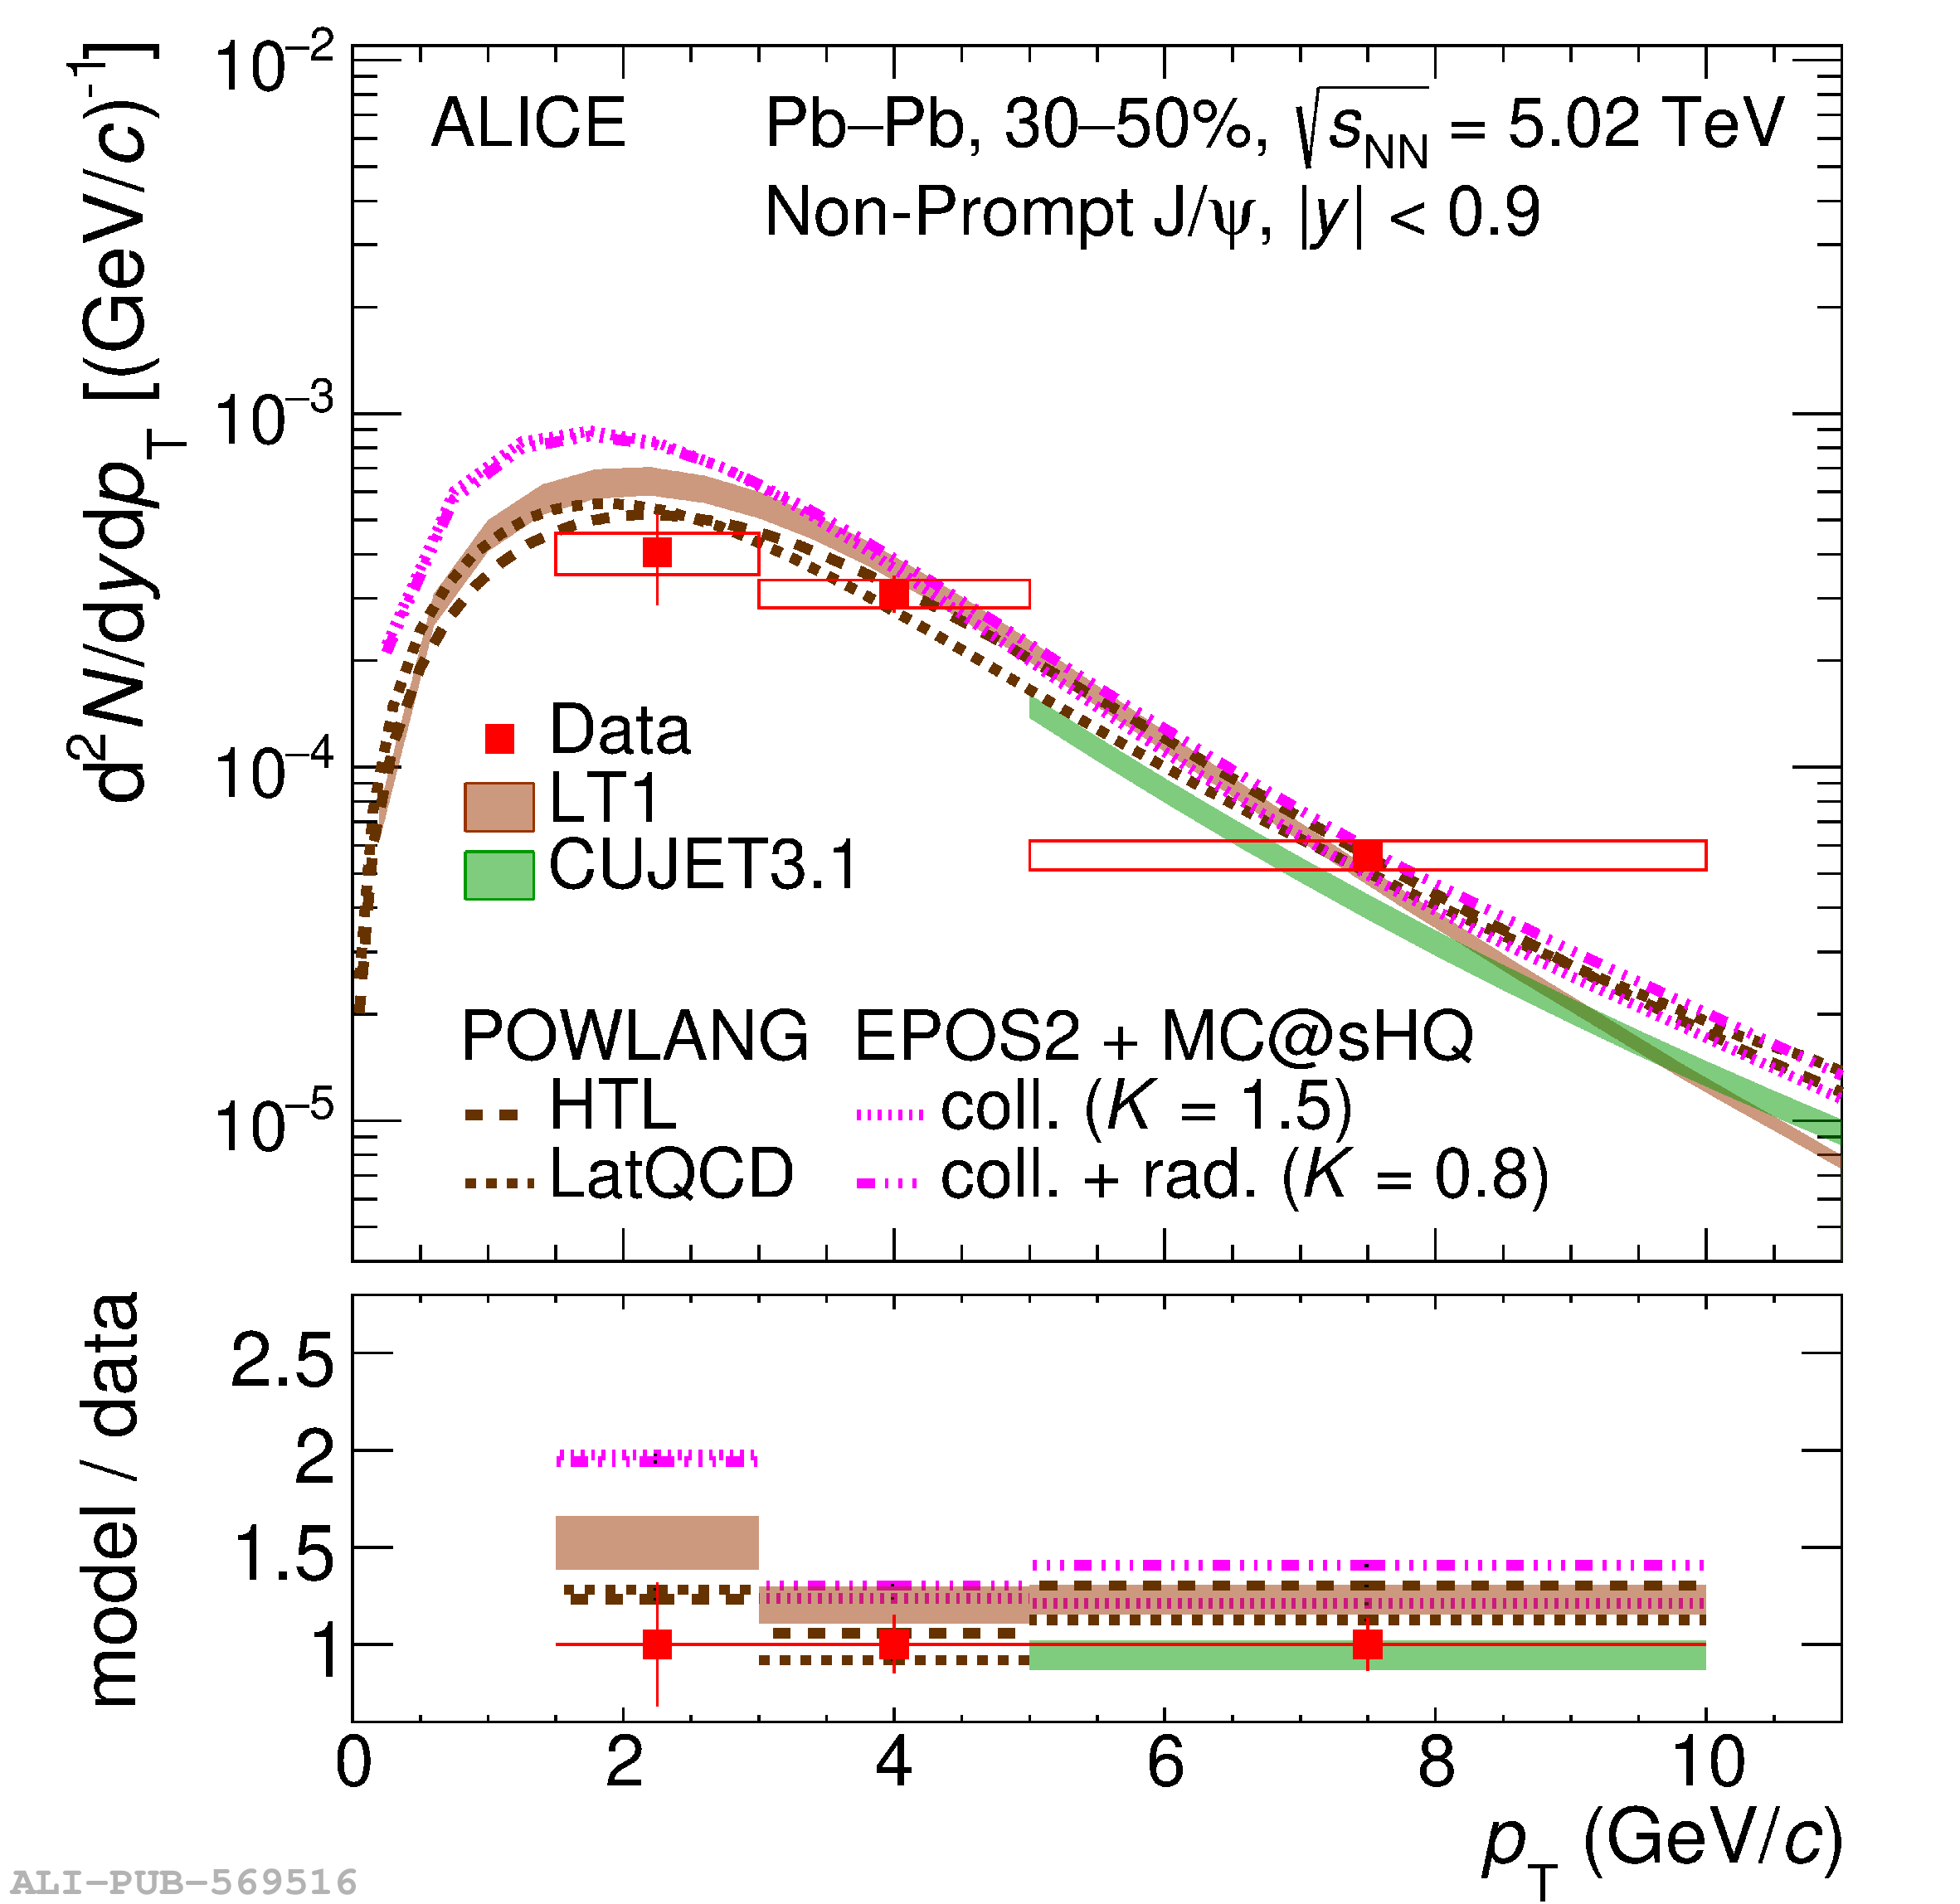
Non-prompt $\jpsi$ yields as a function of $\pt$ in the 0--10\% (left panel) and 30--50\% (right panel) centrality classes compared with models . Vertical error bars and boxes represent statistical and systematic uncertainties, respectively. Shaded bands in the top panels represent model uncertainties where applicable. Bottom panels show the ratios between models and data, with the bands representing the relative uncertainties from the models. Error bars around unity are the quadratic sum of statistical and systematic uncertainties on the measured yields.

Figure 11

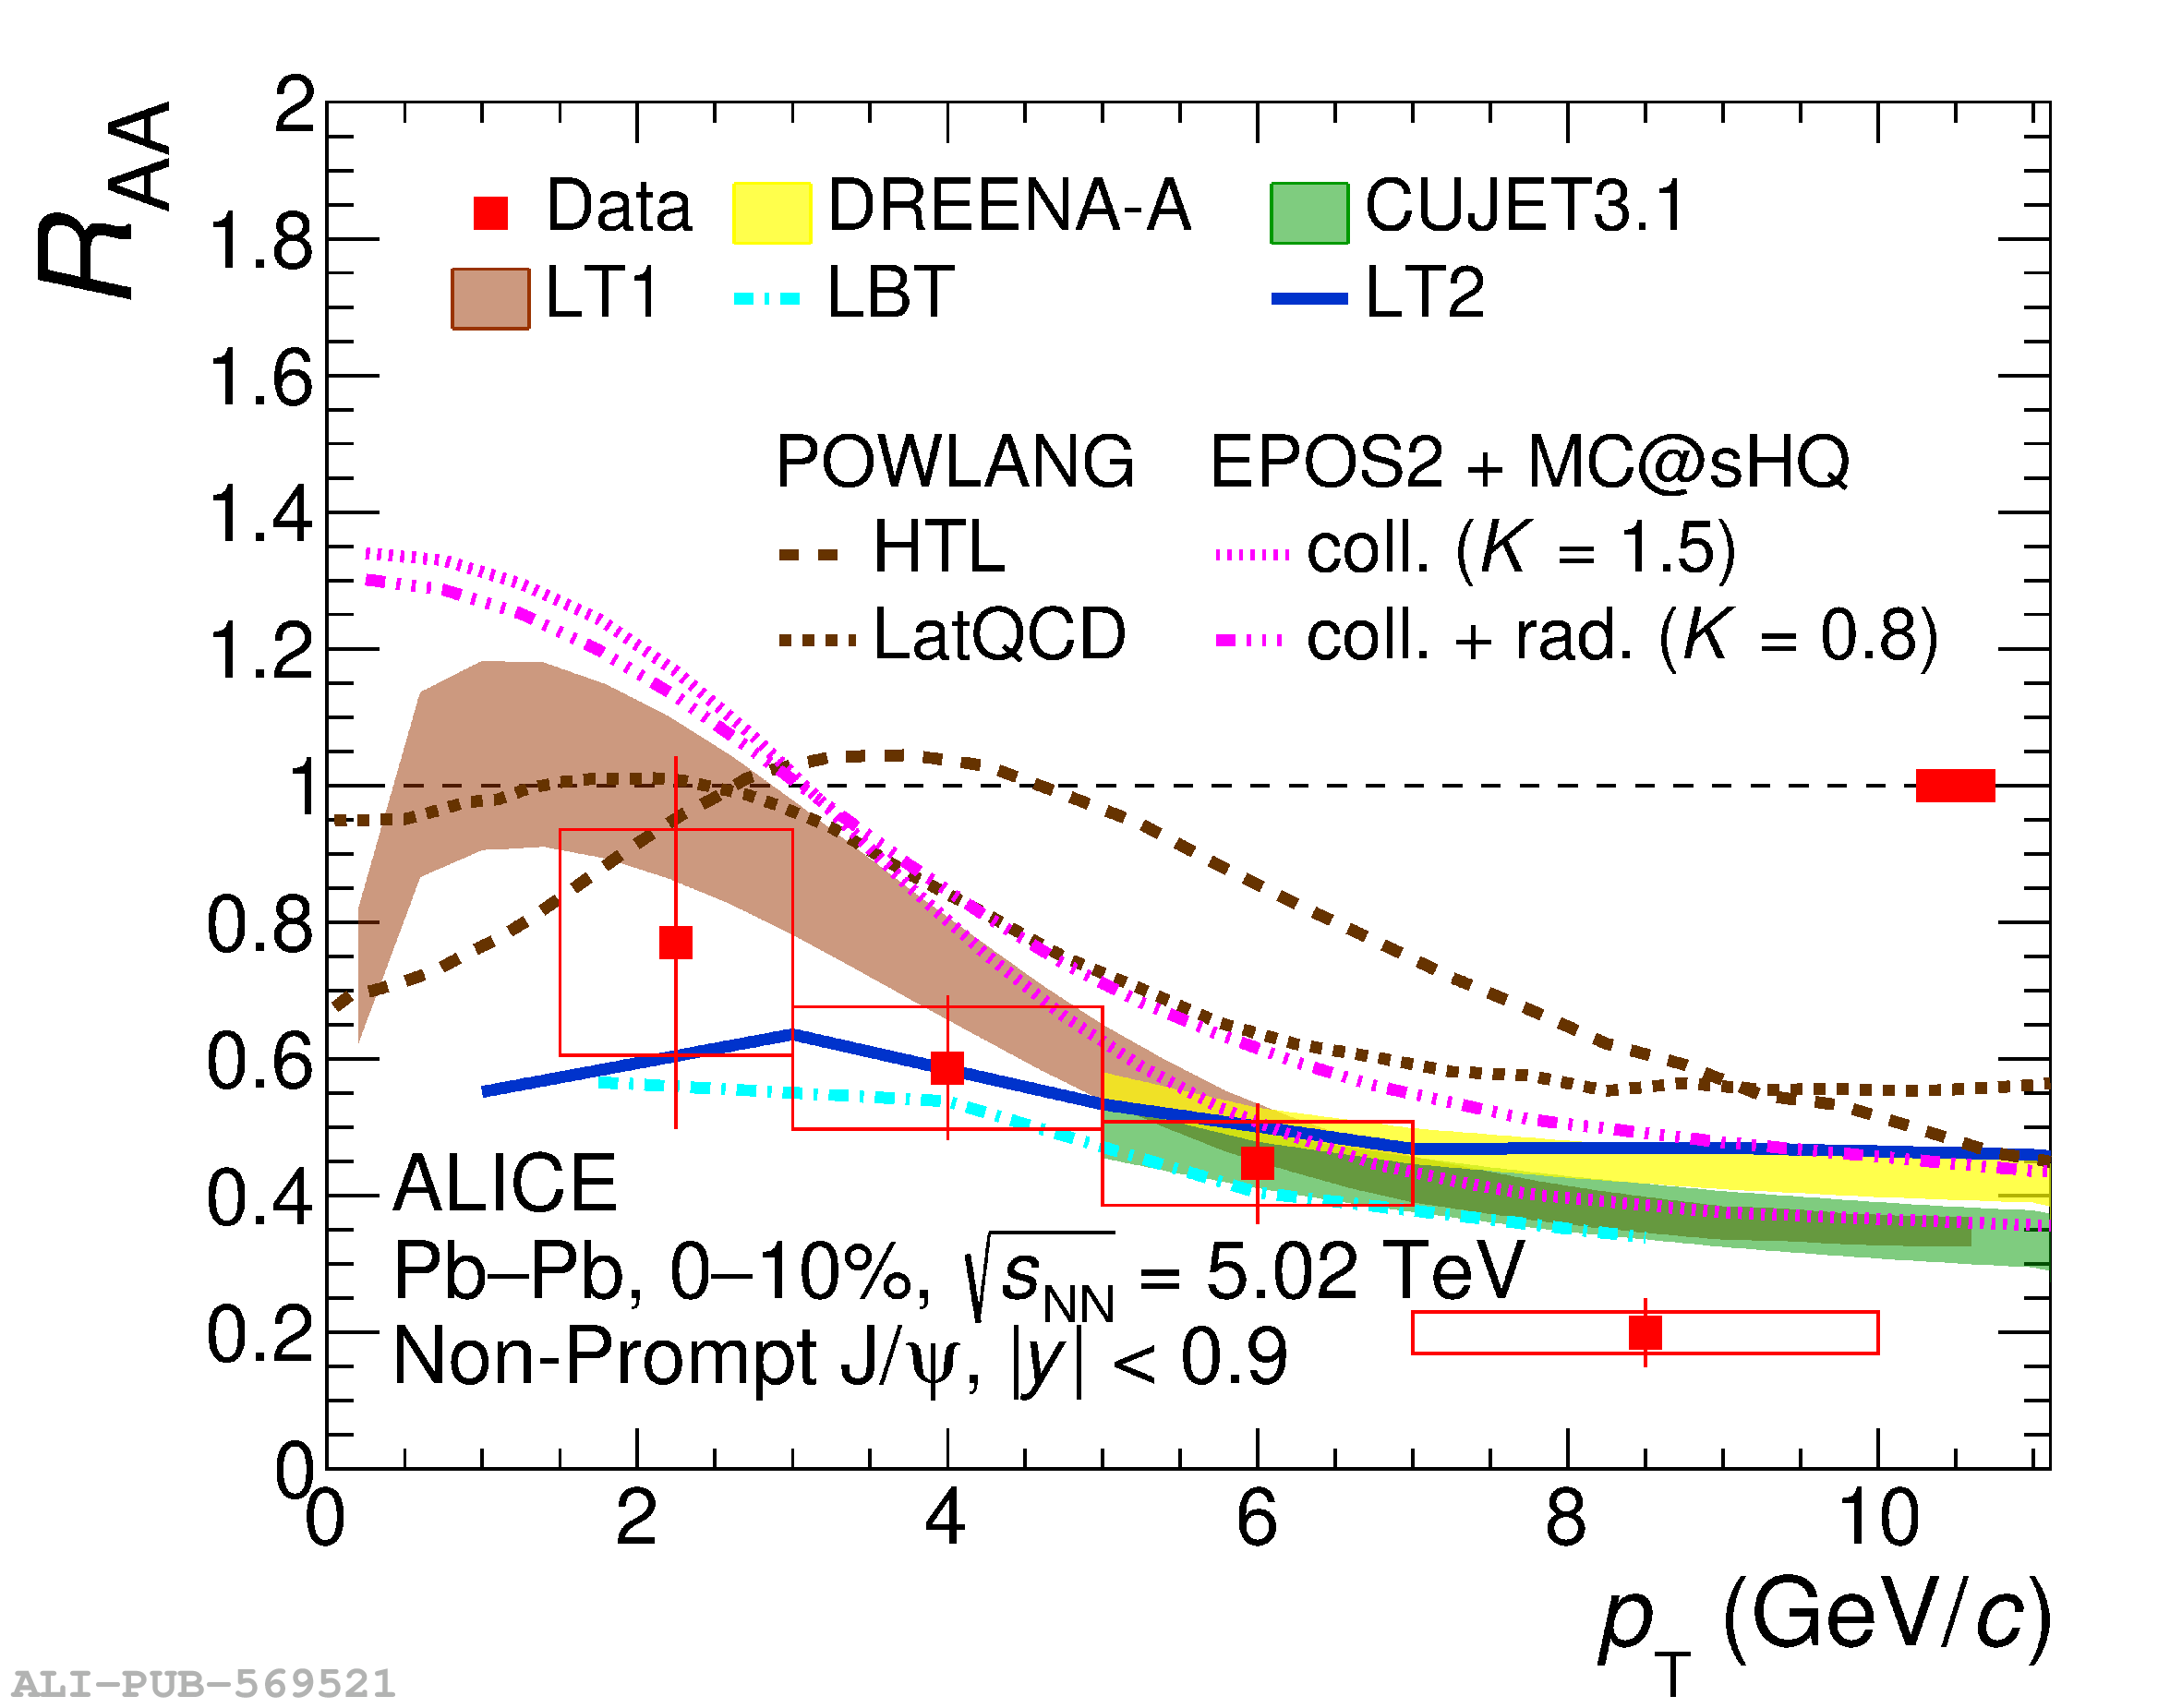
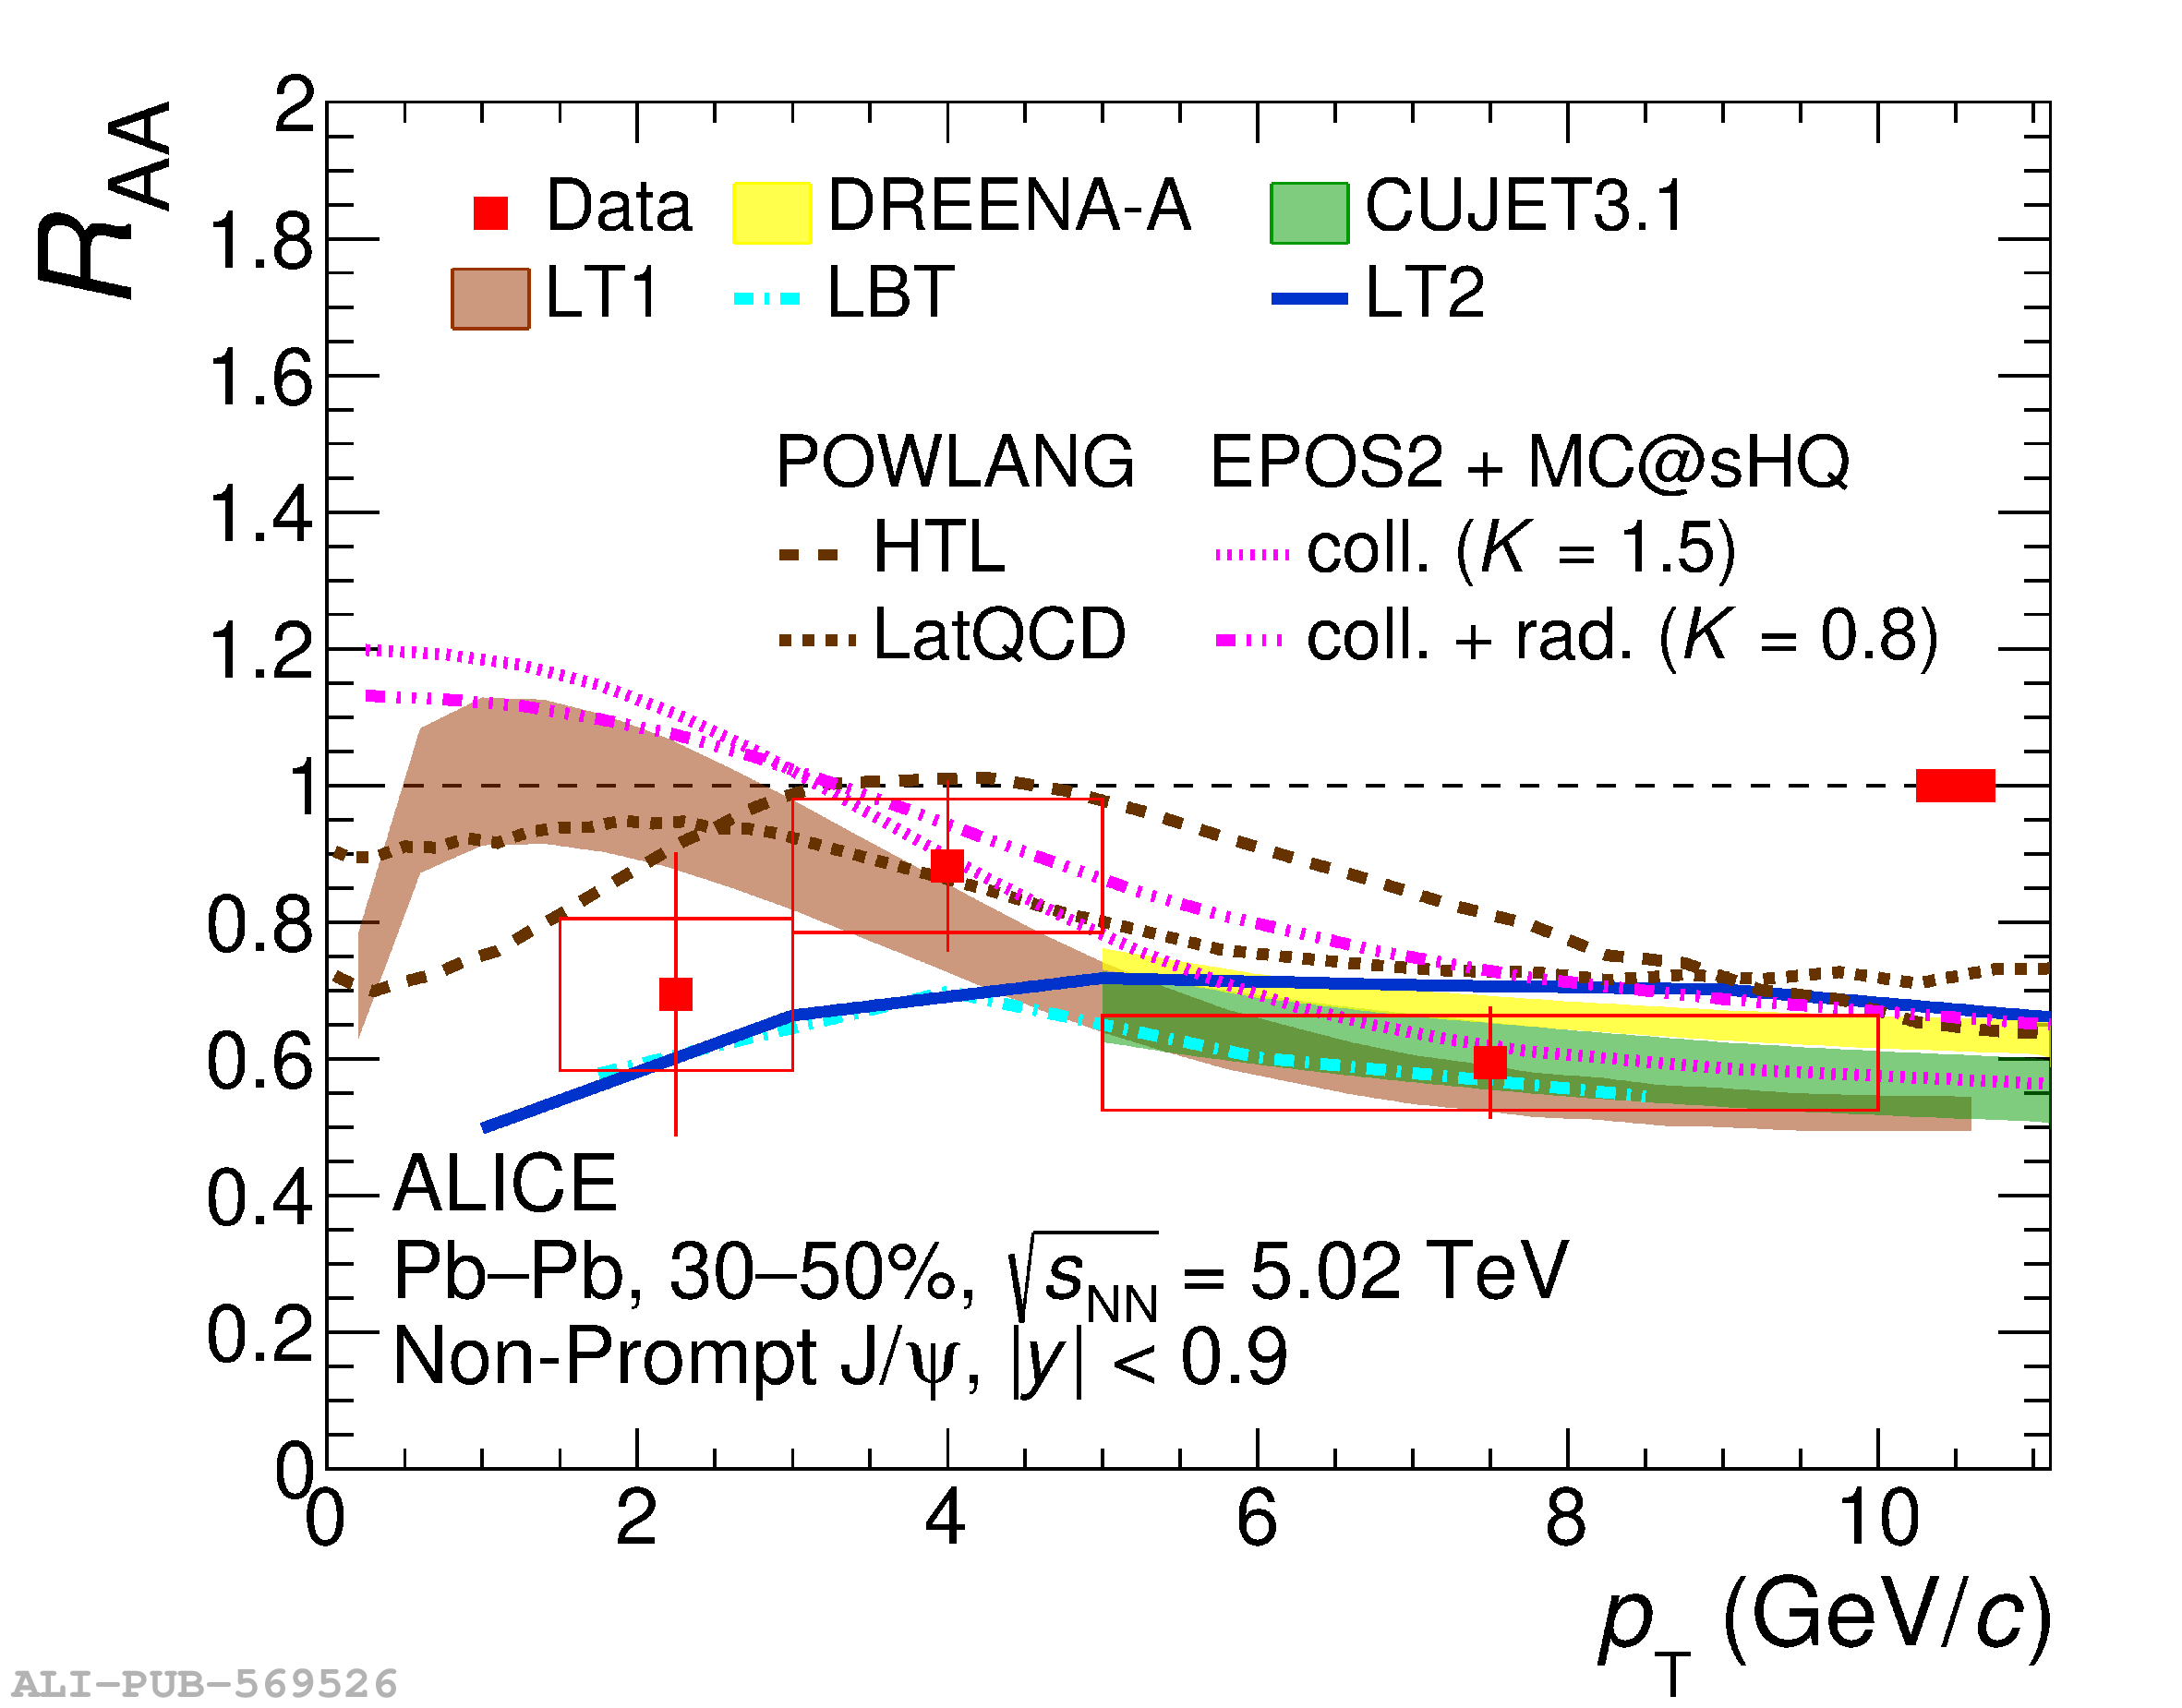
Non-prompt $\jpsi$ $\RAA$ as a function of $\pt$ in the 0--10\% (left panel) and 30--50\% (right panel) centrality classes compared with models . Error bars and boxes represent statistical and uncorrelated systematic uncertainties, respectively. Shaded bands represent model uncertainties where applicable. The global uncertainty is shown around unity.

Figure 12

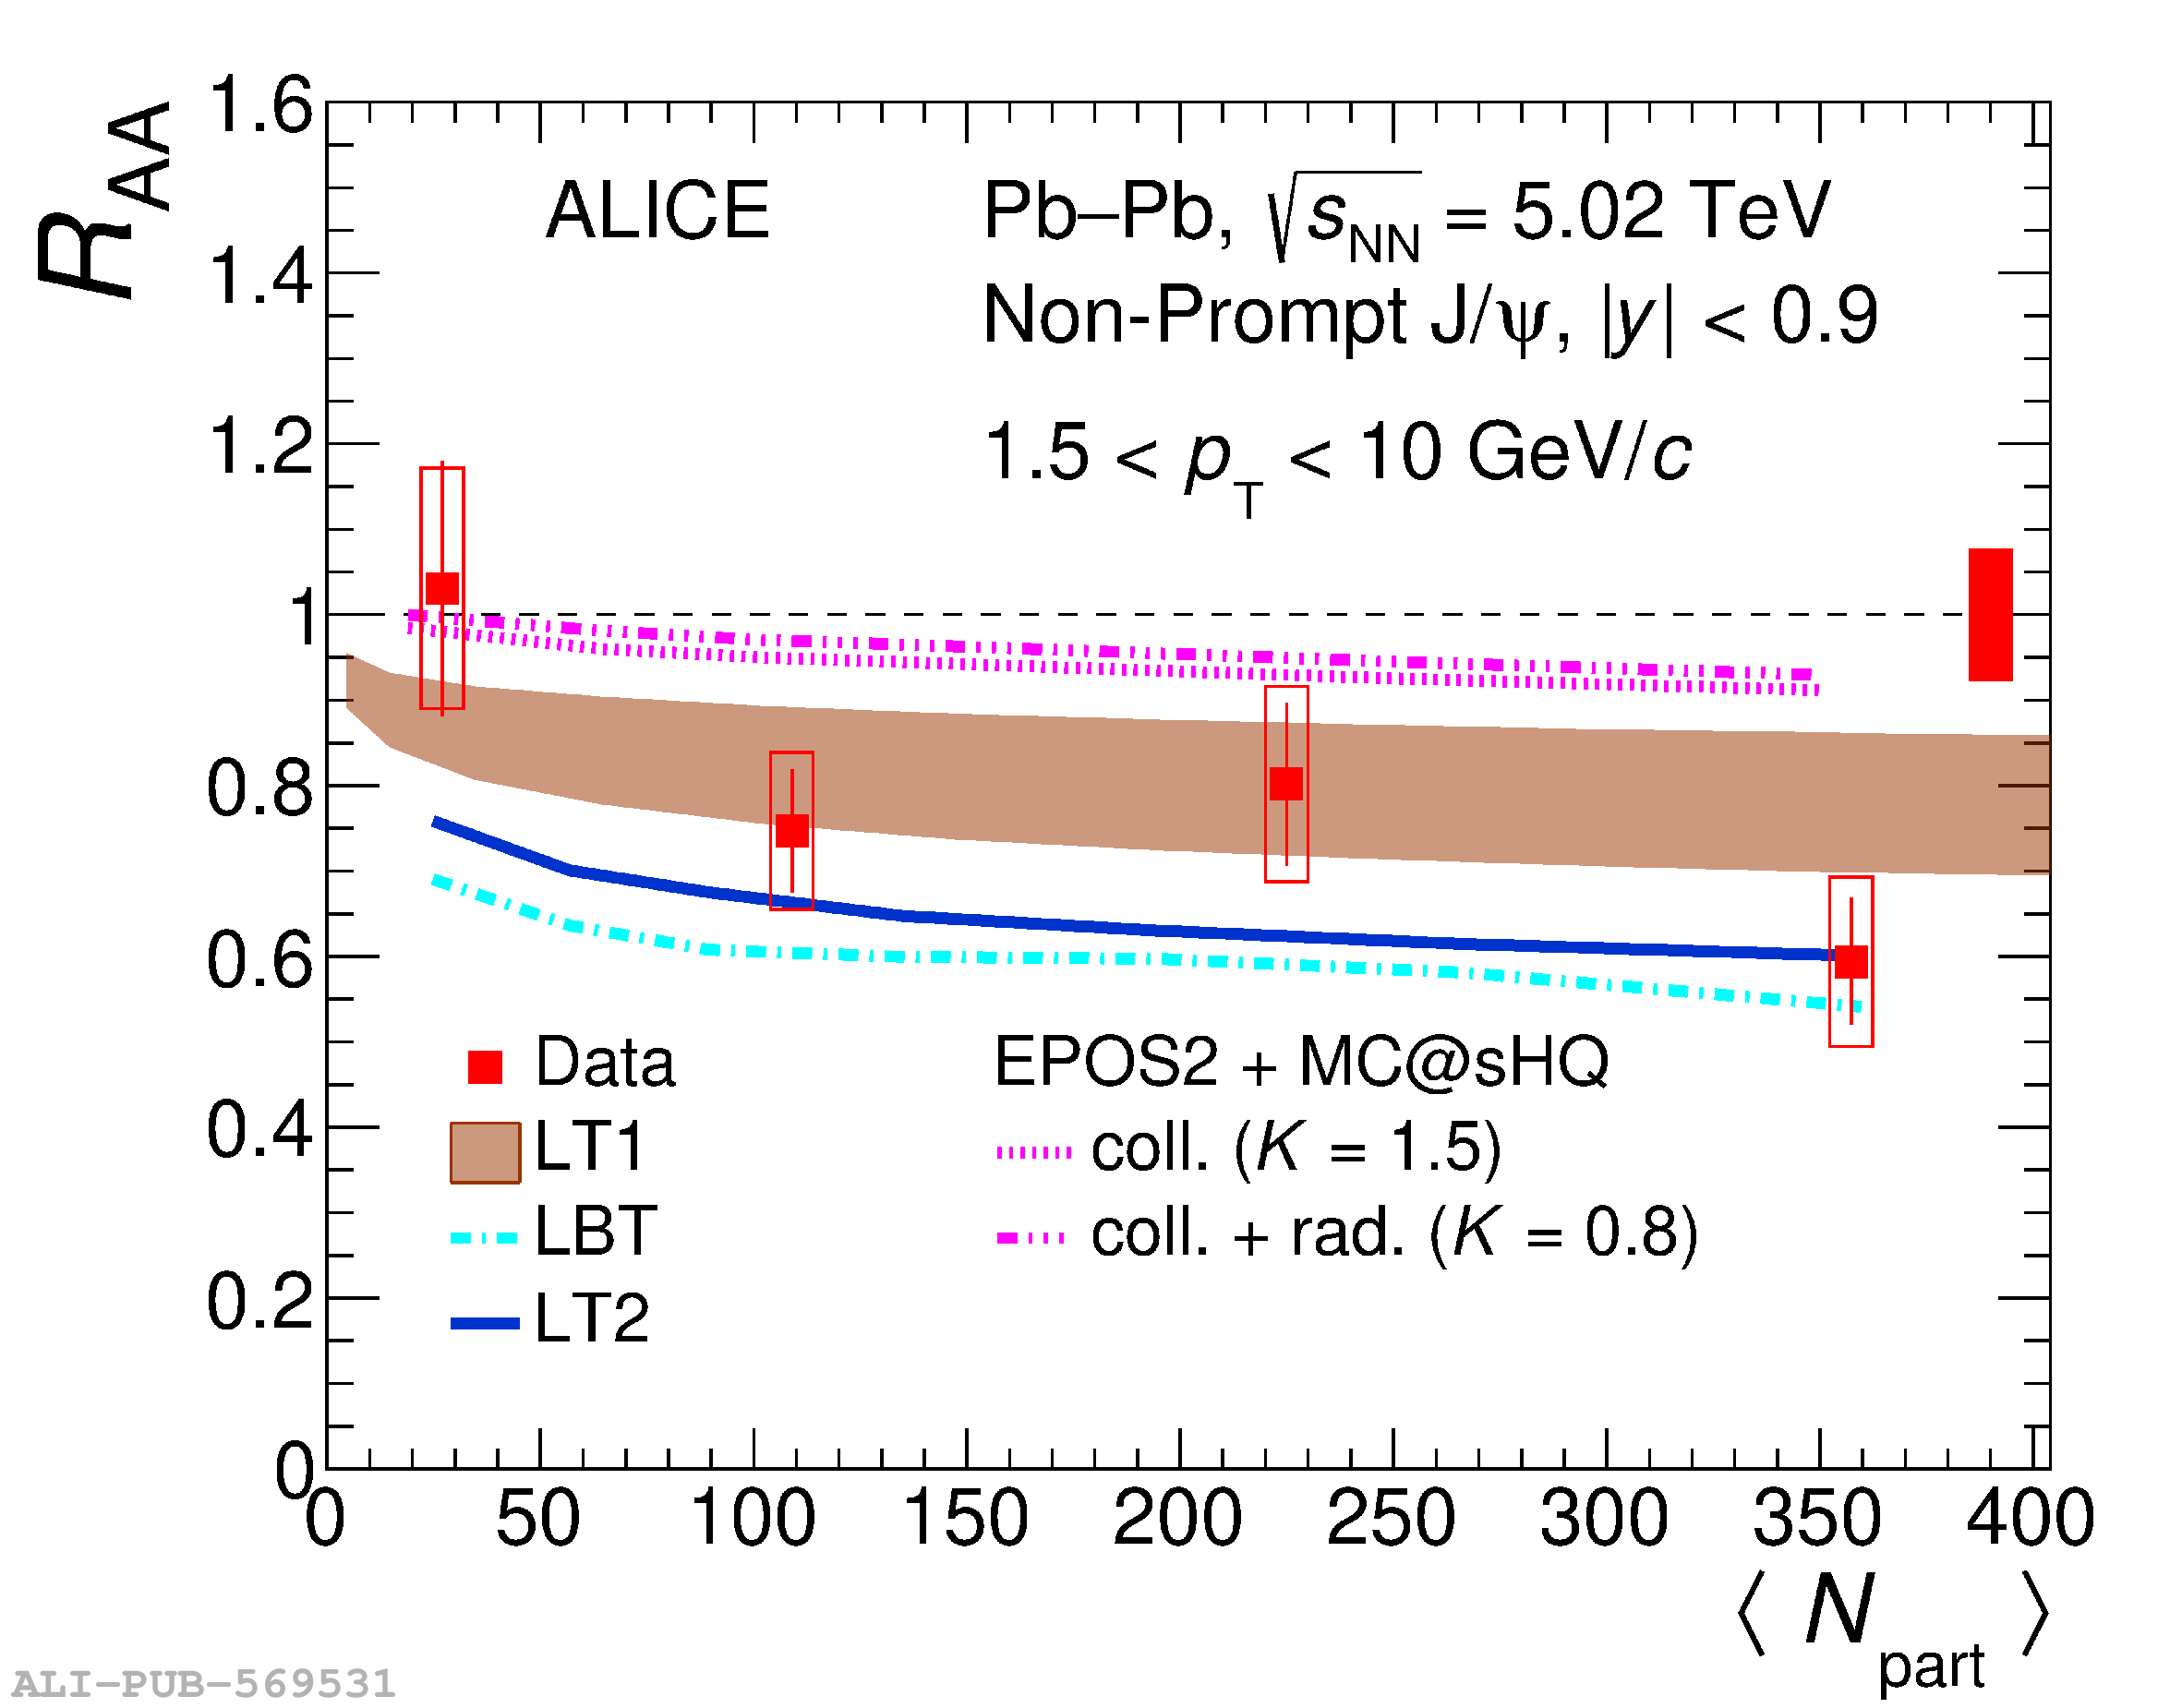
Centrality dependence (expressed in terms of average number of participants) of non-prompt $\jpsi$ $\RAA$ measured by ALICE in Pb-Pb collisions at $\snn$ = 5.02 TeV in the transverse momentum interval 1.5 $< \pt <$ 10 GeV/$c$. Results are compared with several partonic transport models . Error bars and boxes represent statistical and uncorrelated systematic uncertainties, respectively. Shaded bands represent model uncertainties where applicable. The global uncertainty is shown around unity.