Nuclear modification factor of non-prompt $\jpsi$ as a function of $\pt$ in the 0--10\% (upper left panel), 10--30\% (top right panel) and 30--50\% (bottom left panel). Results are compared with similar measurements from the ATLAS and CMS collaborations. Results in 0--10\% and 30--50\% are also compared to non-prompt D$^{0}$ $\RAA$ measurements in the same centrality classes. The centrality dependent non-prompt $\jpsi$ $\RAA$ in 1.5 $< \pt <$ 10 \GeVc is shown in the bottom right panel (centrality is expressed in terms of average number of participants). Error bars and boxes represent statistical and systematic uncertainties uncorrelated with $\pt$ (centrality, for the bottom right panel). Global uncertainties are shown as boxes around unity. | 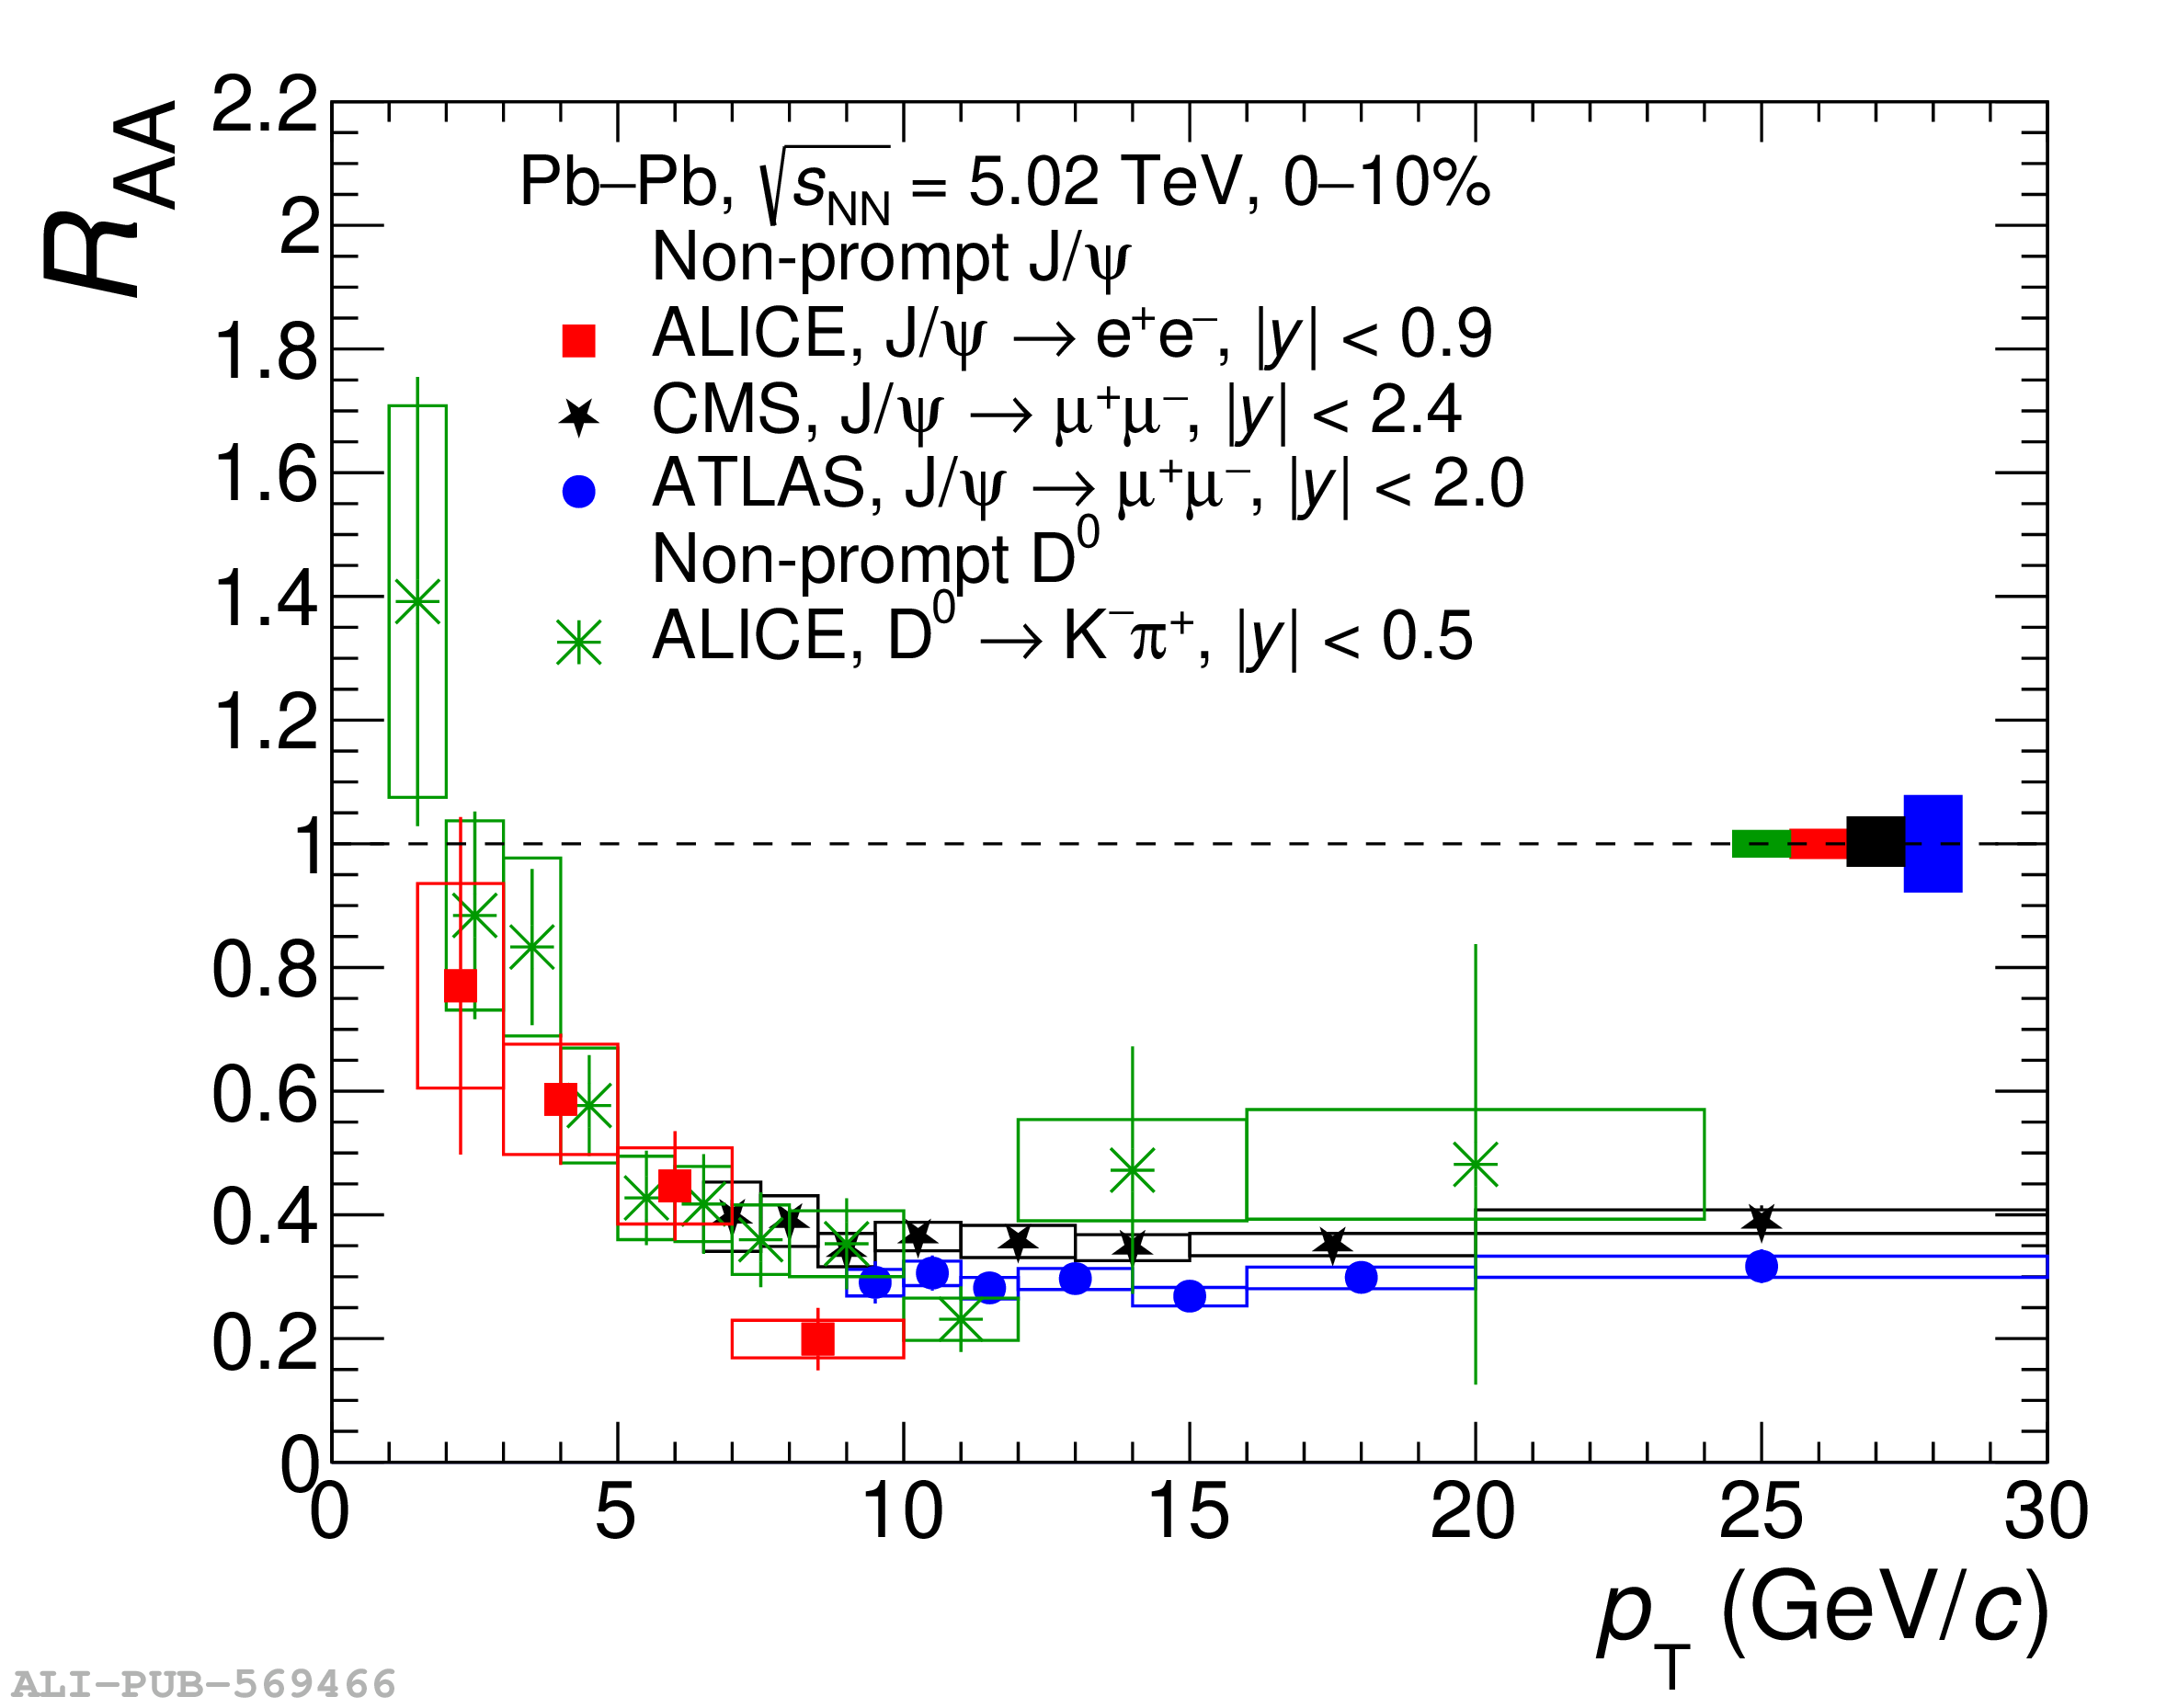 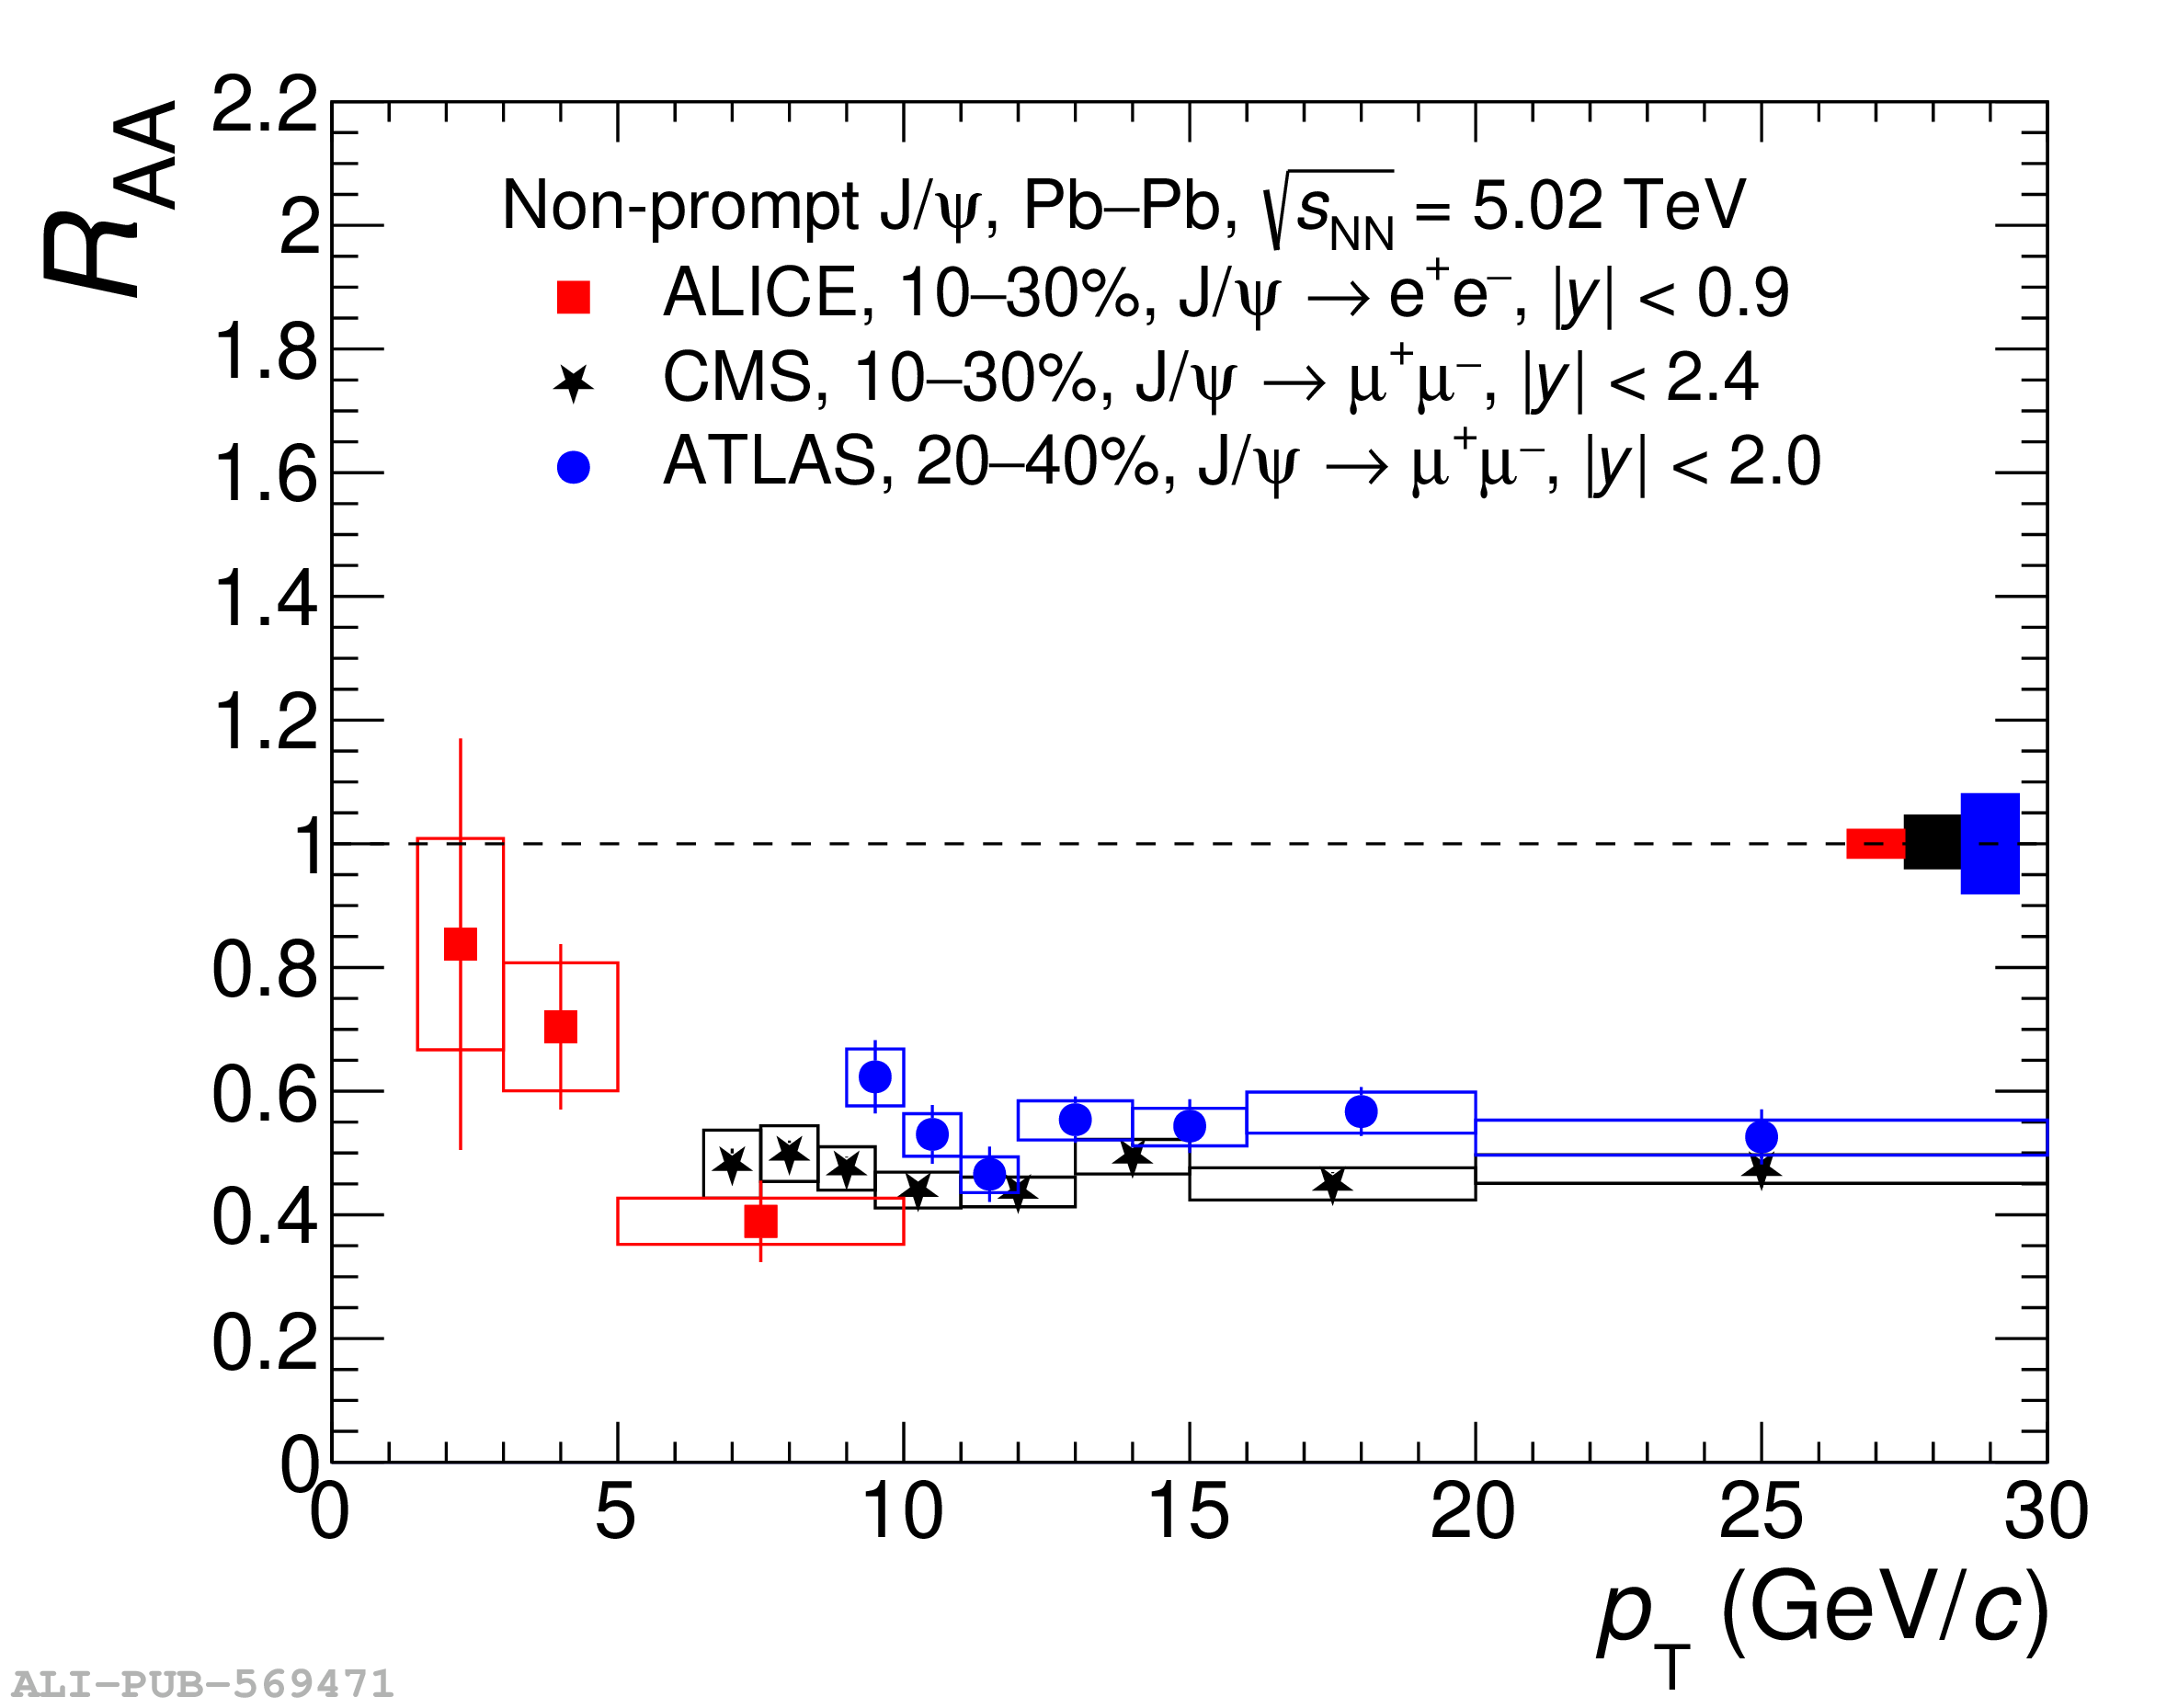 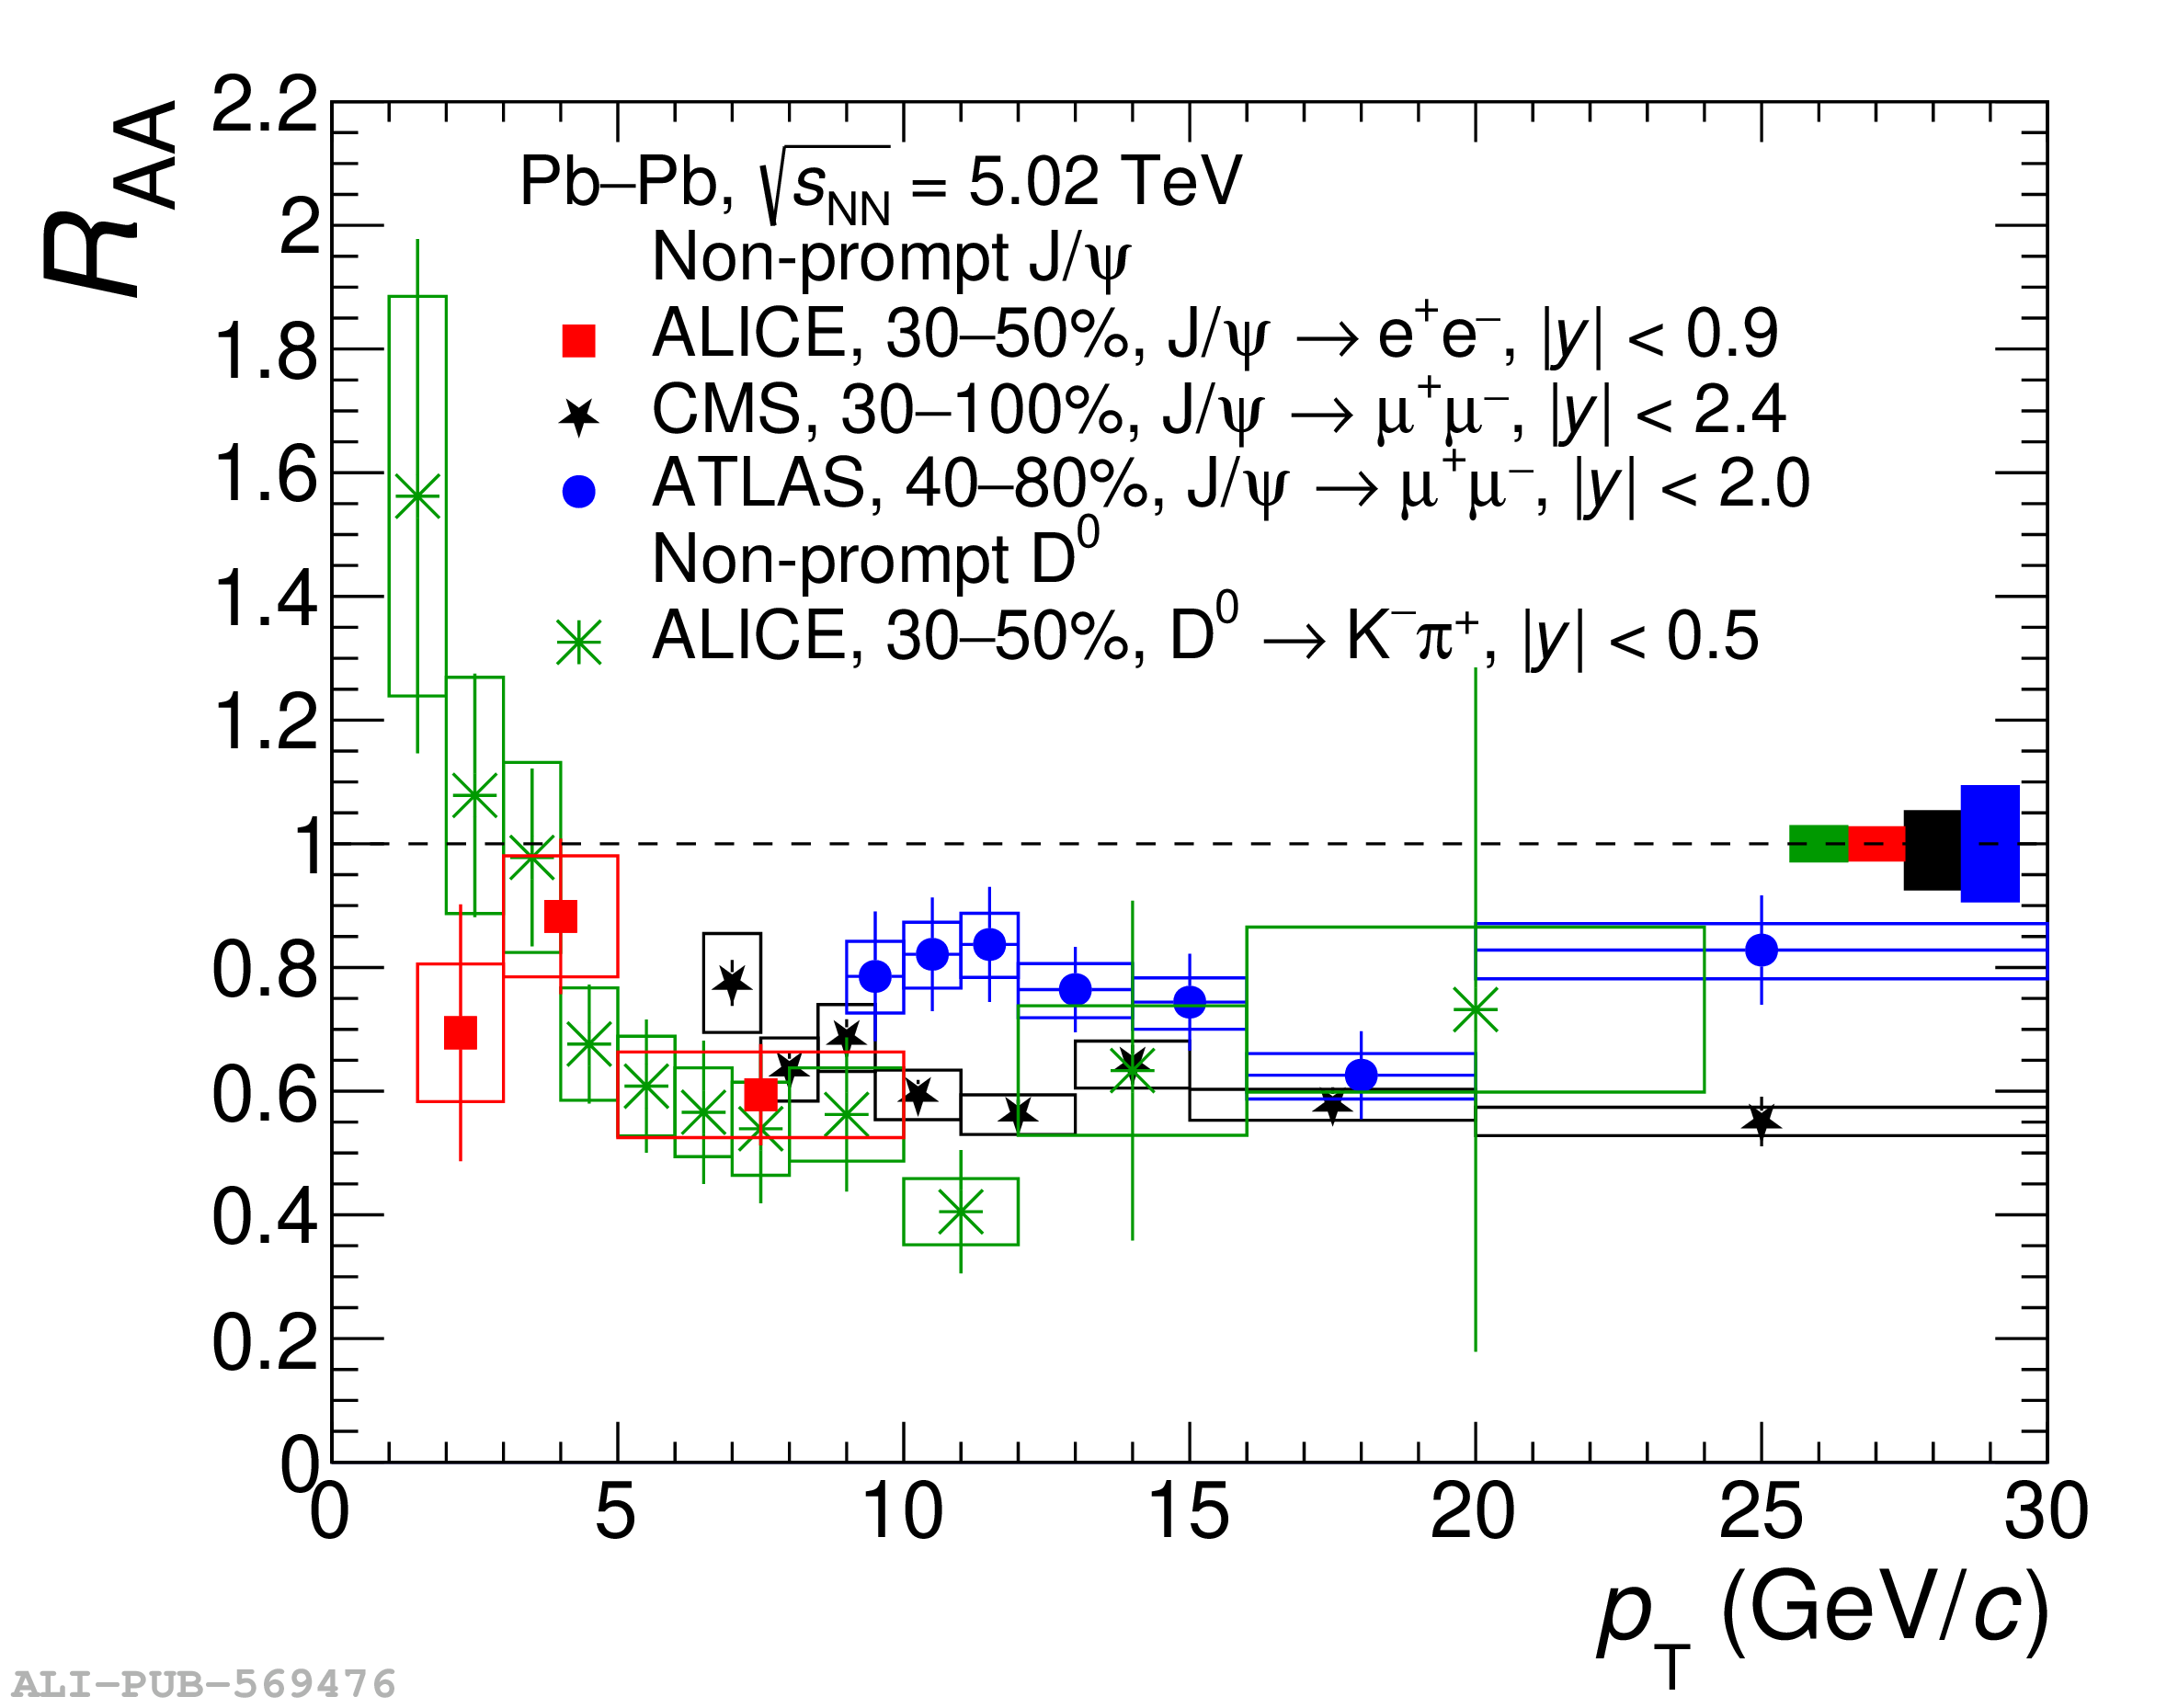 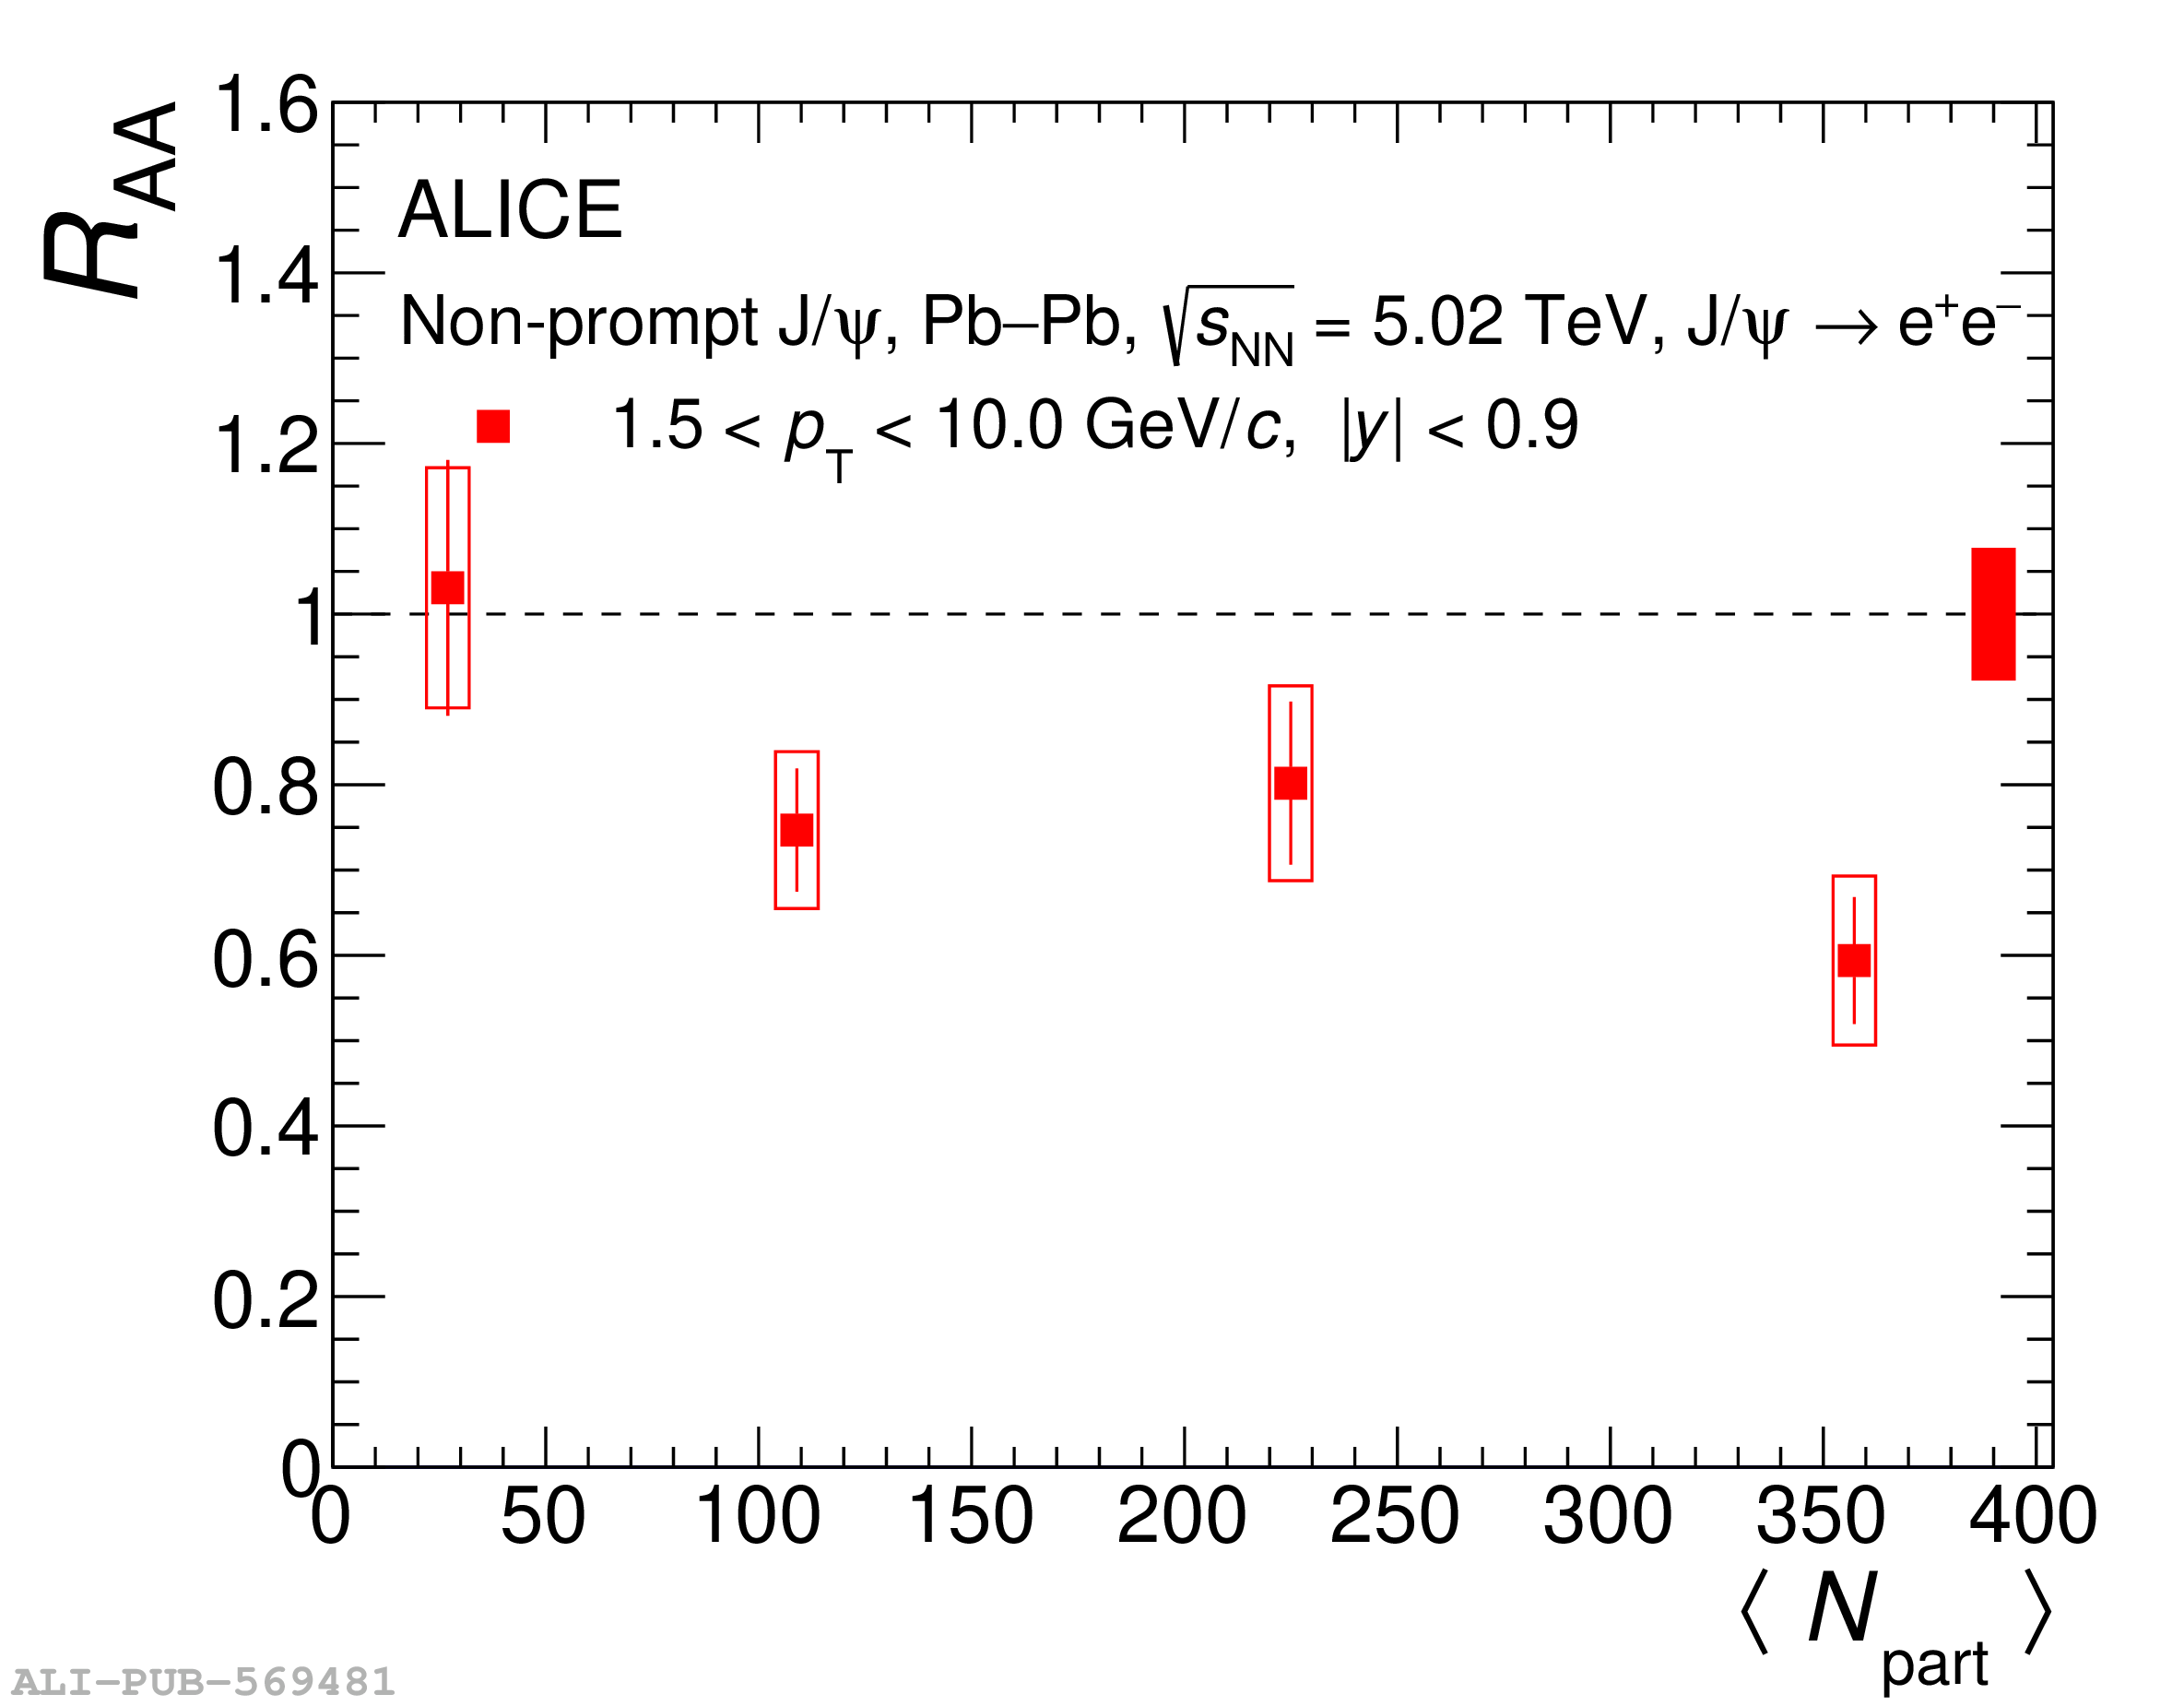 |