Invariant mass (left panel) and pseudoproper decay length (right panel) distributions of $\jpsi$ candidates with maximum likelihood fit projections superimposed. The distributions in the figures correspond to selected candidates with $1.5 < \pt < 3.0$ GeV/$c$ in the centrality class 30--50\%. The pseudoproper decay length distribution is shown for $\jpsi$ candidates reconstructed under the $\jpsi$ mass peak, i.e. for $2.92 < m_{\rm ee} < 3.16$ GeV/$c^{2}$, for display purposes only. The $\chi^{2}$ values, obtained by comparing the binned distributions of data points and the corresponding projections of the total fit function, are also reported. | 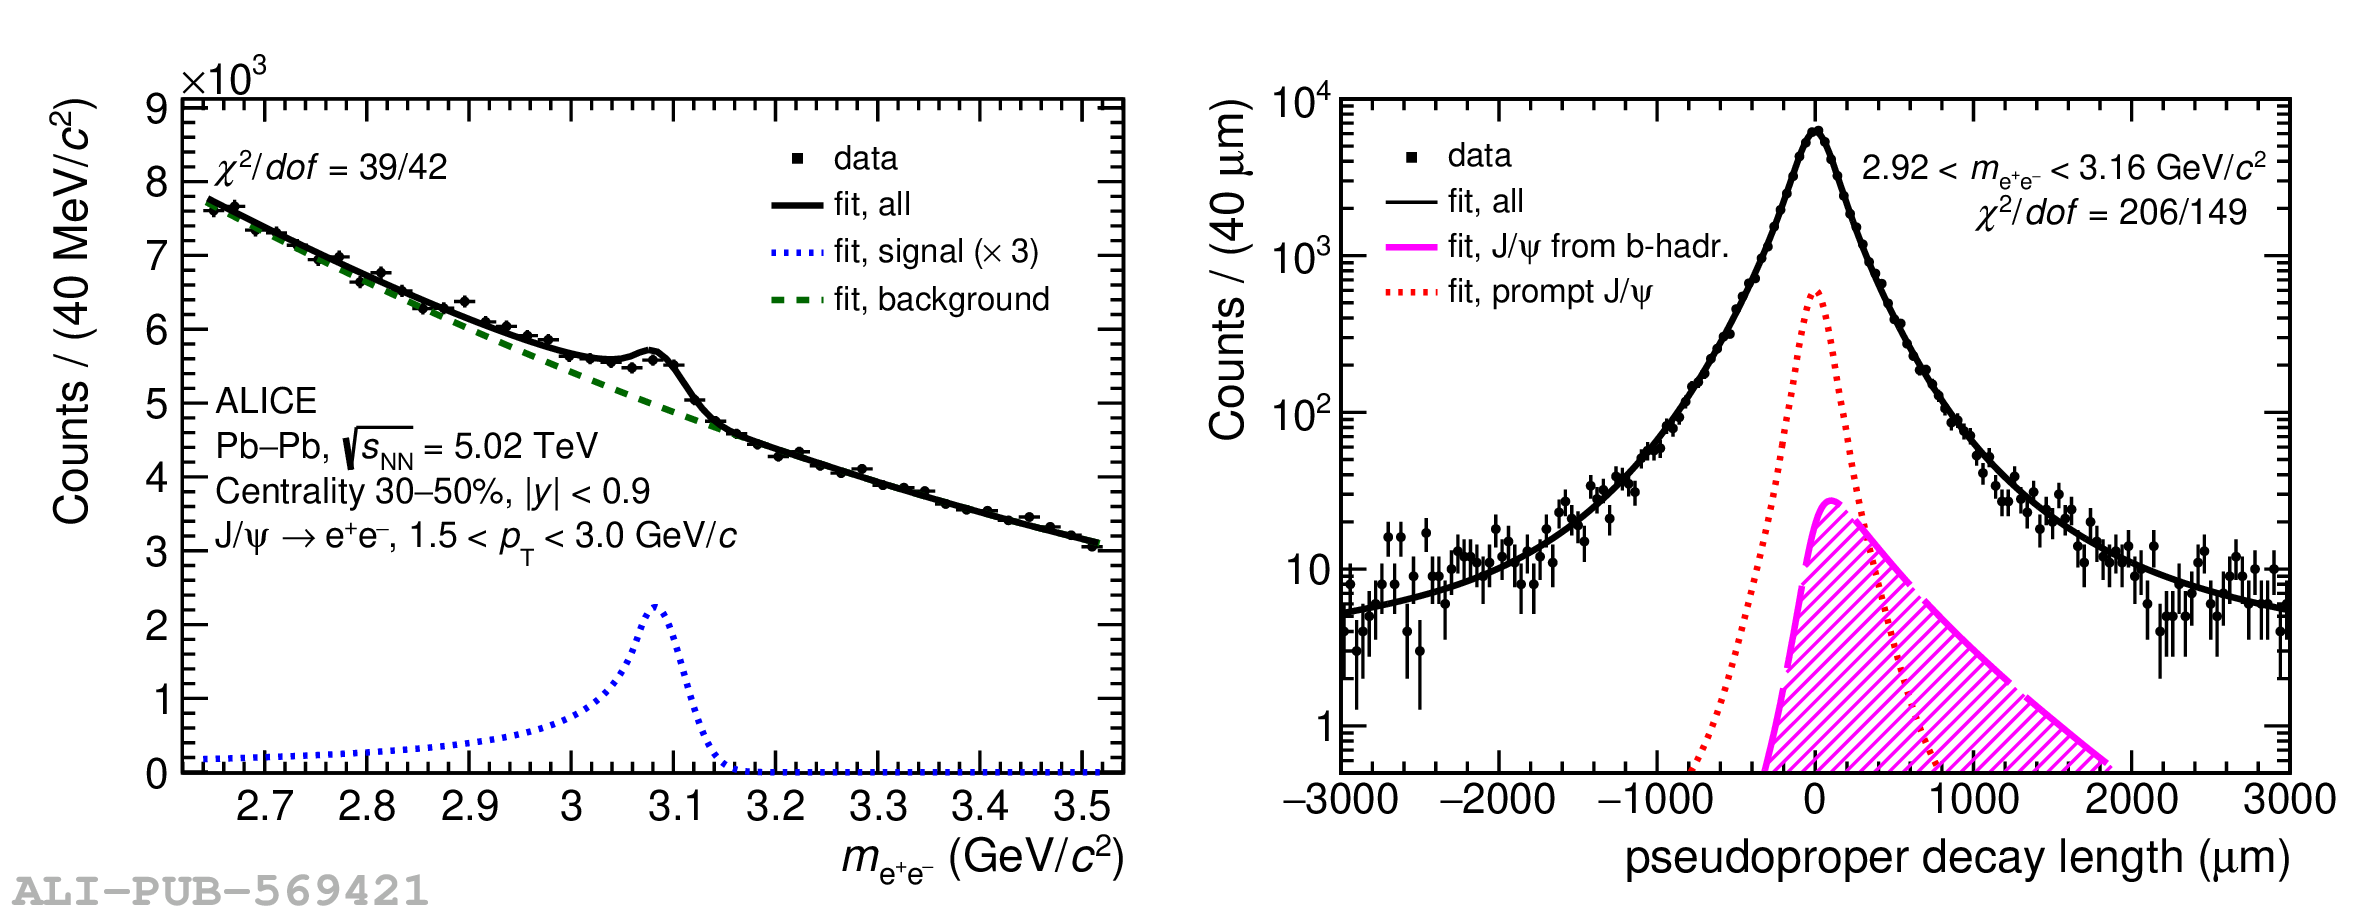 |