Non-prompt $\jpsi$ yields as a function of $\pt$ in the 0--10\% (left panel) and 30--50\% (right panel) centrality classes compared with models . Vertical error bars and boxes represent statistical and systematic uncertainties, respectively. Shaded bands in the top panels represent model uncertainties where applicable. Bottom panels show the ratios between models and data, with the bands representing the relative uncertainties from the models. Error bars around unity are the quadratic sum of statistical and systematic uncertainties on the measured yields. | 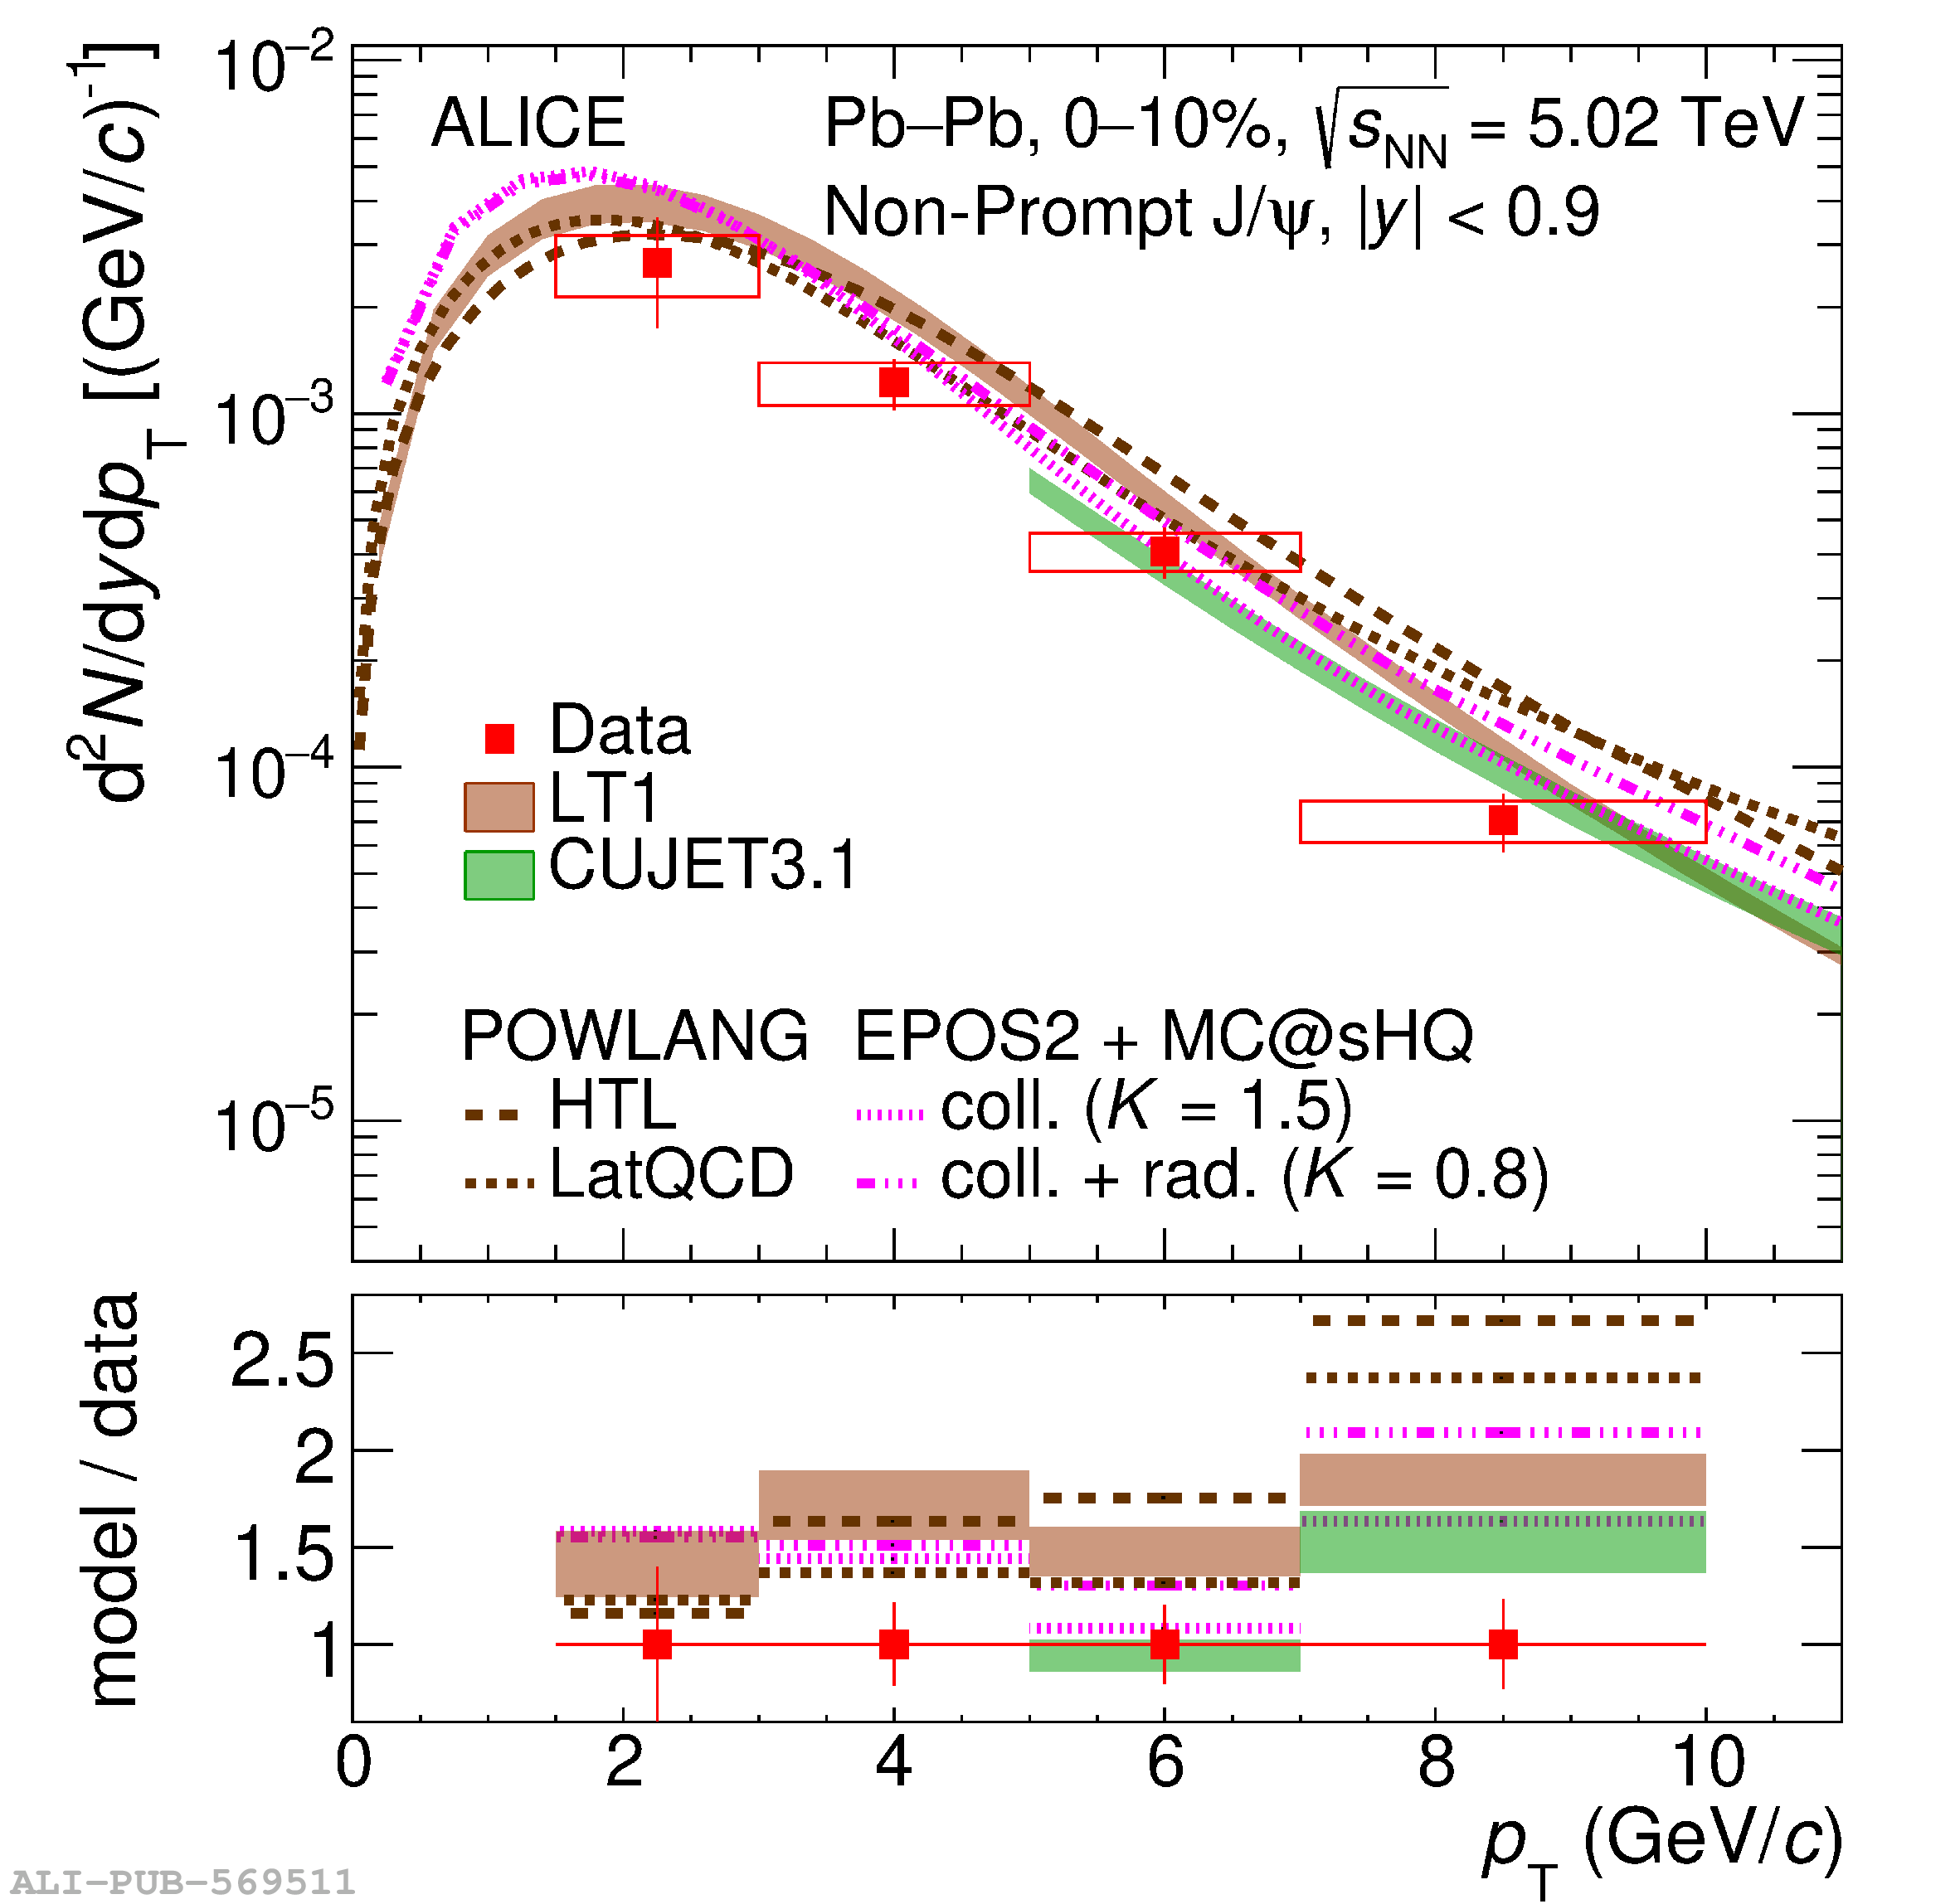 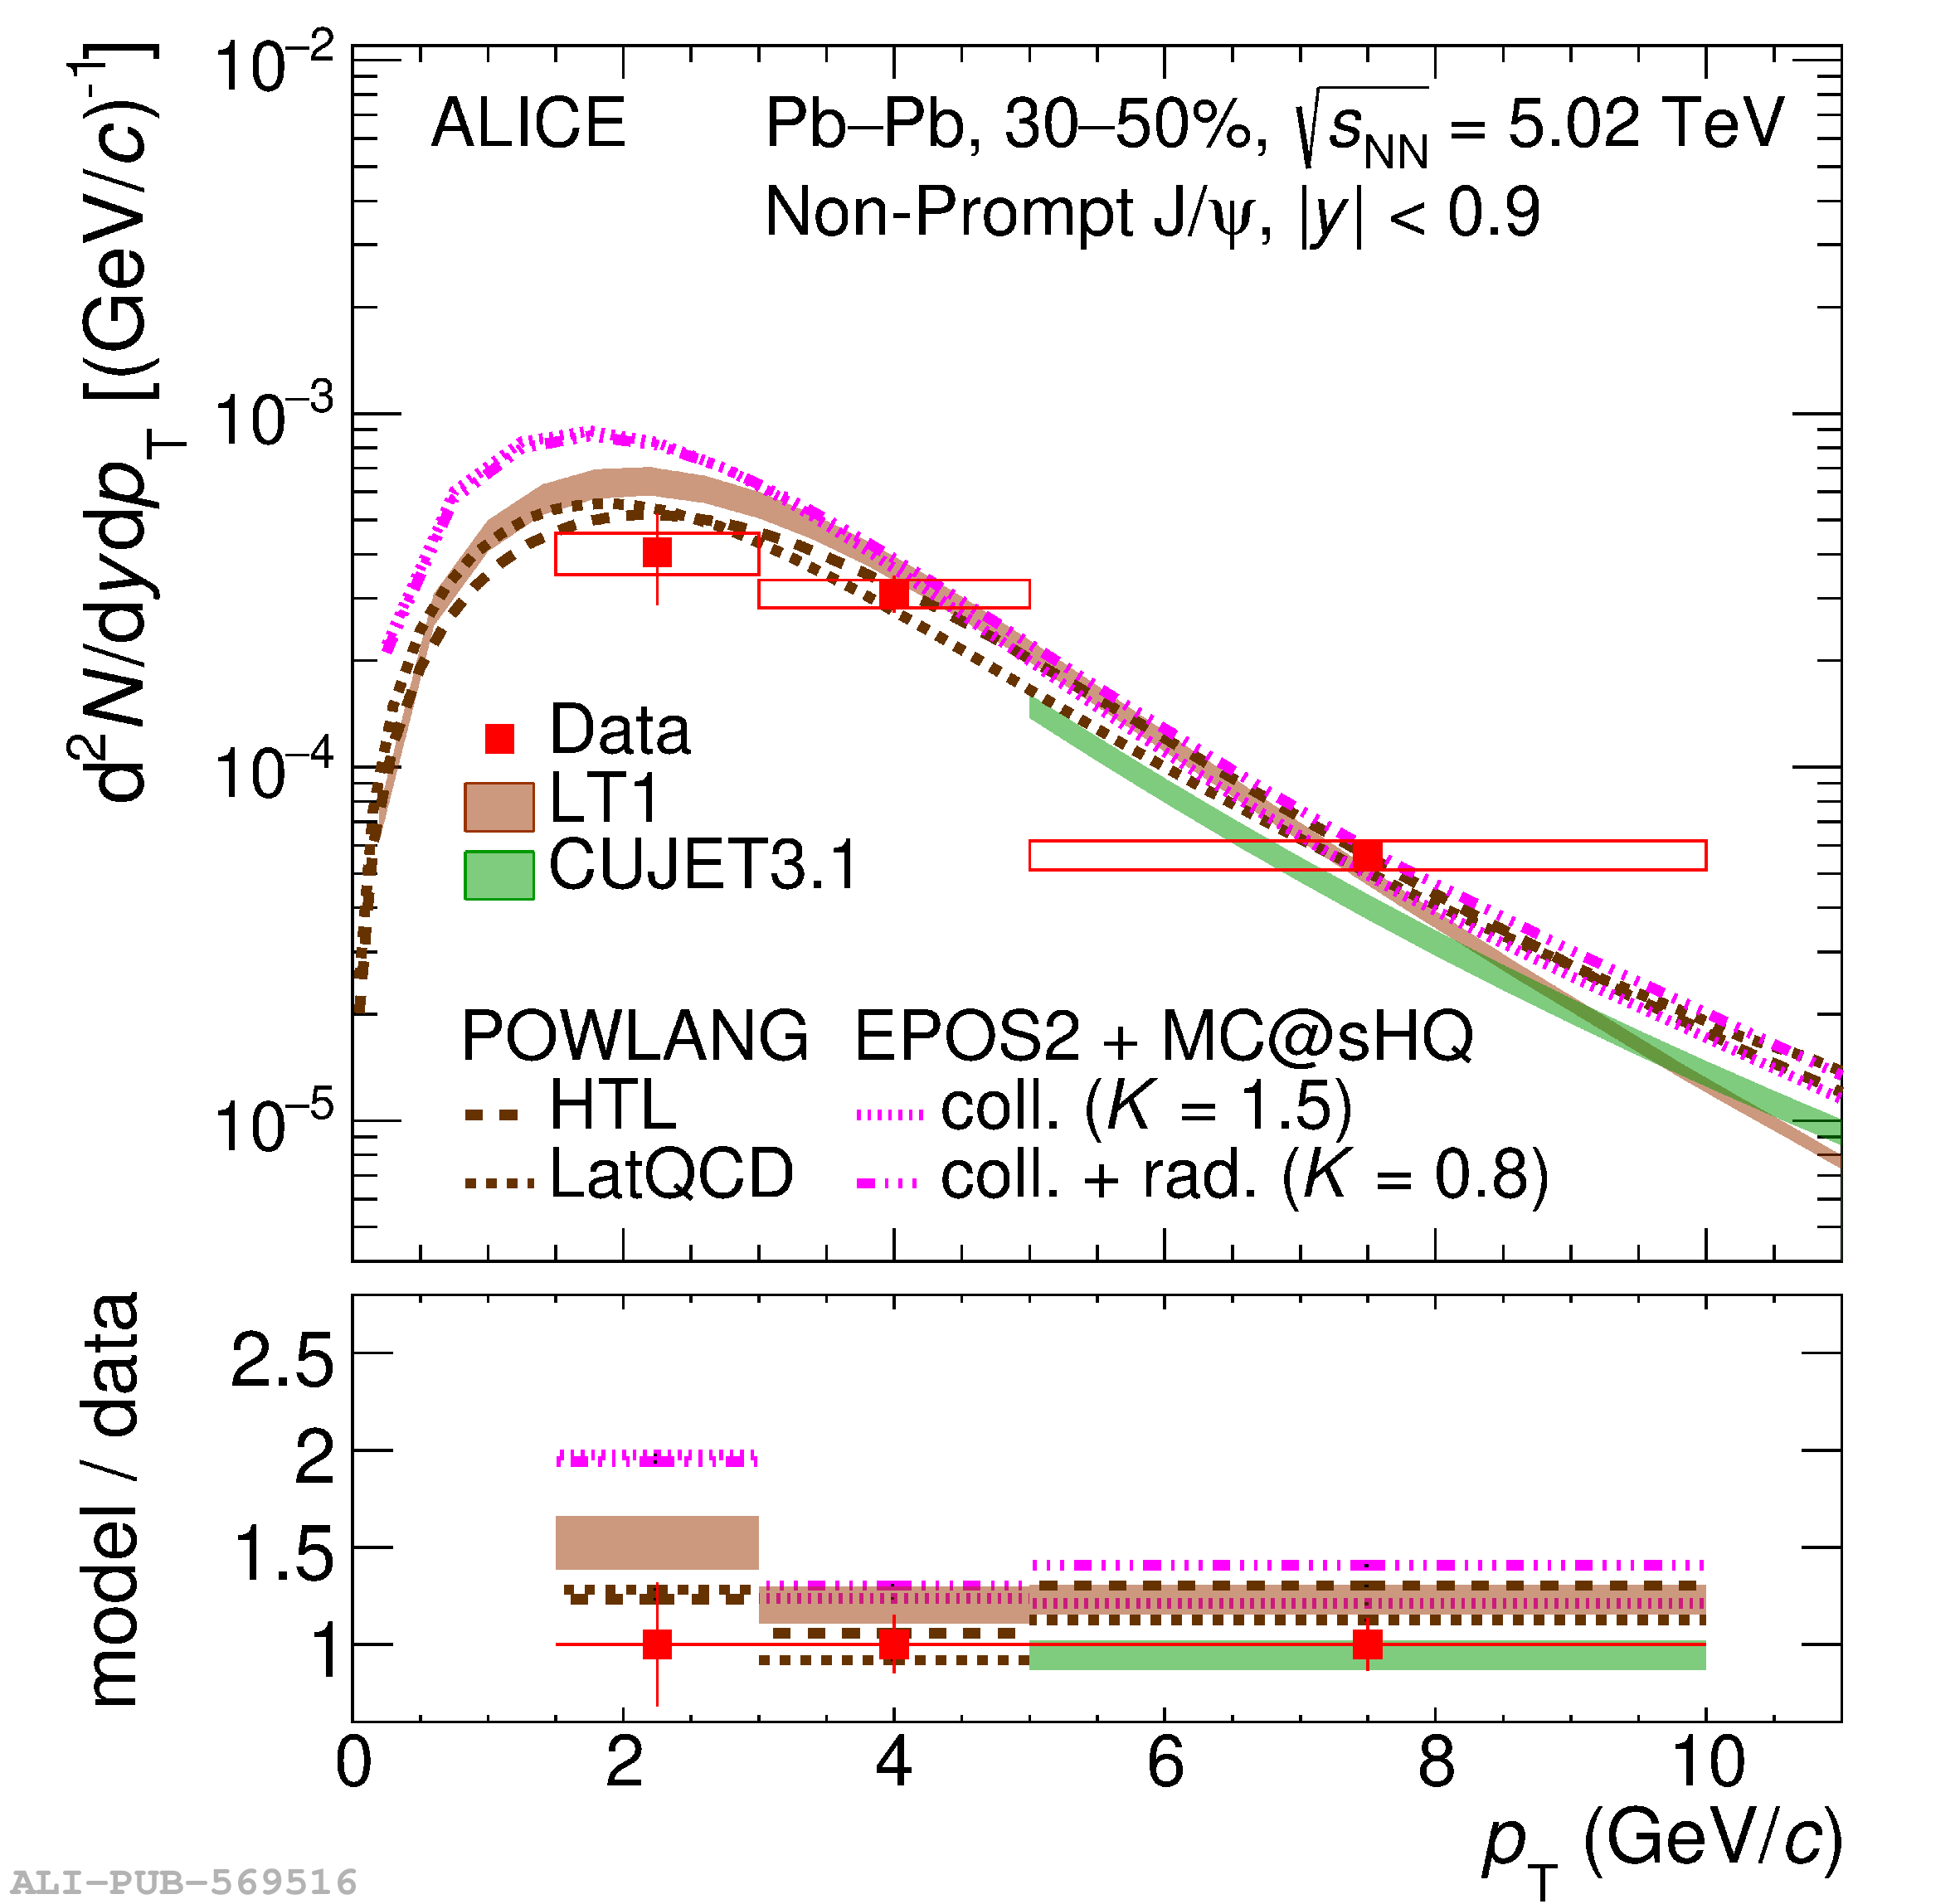 |