Non-prompt $\jpsi$ $\RAA$ as a function of $\pt$ in the 0--10\% (left panel) and 30--50\% (right panel) centrality classes compared with models . Error bars and boxes represent statistical and uncorrelated systematic uncertainties, respectively. Shaded bands represent model uncertainties where applicable. The global uncertainty is shown around unity. | 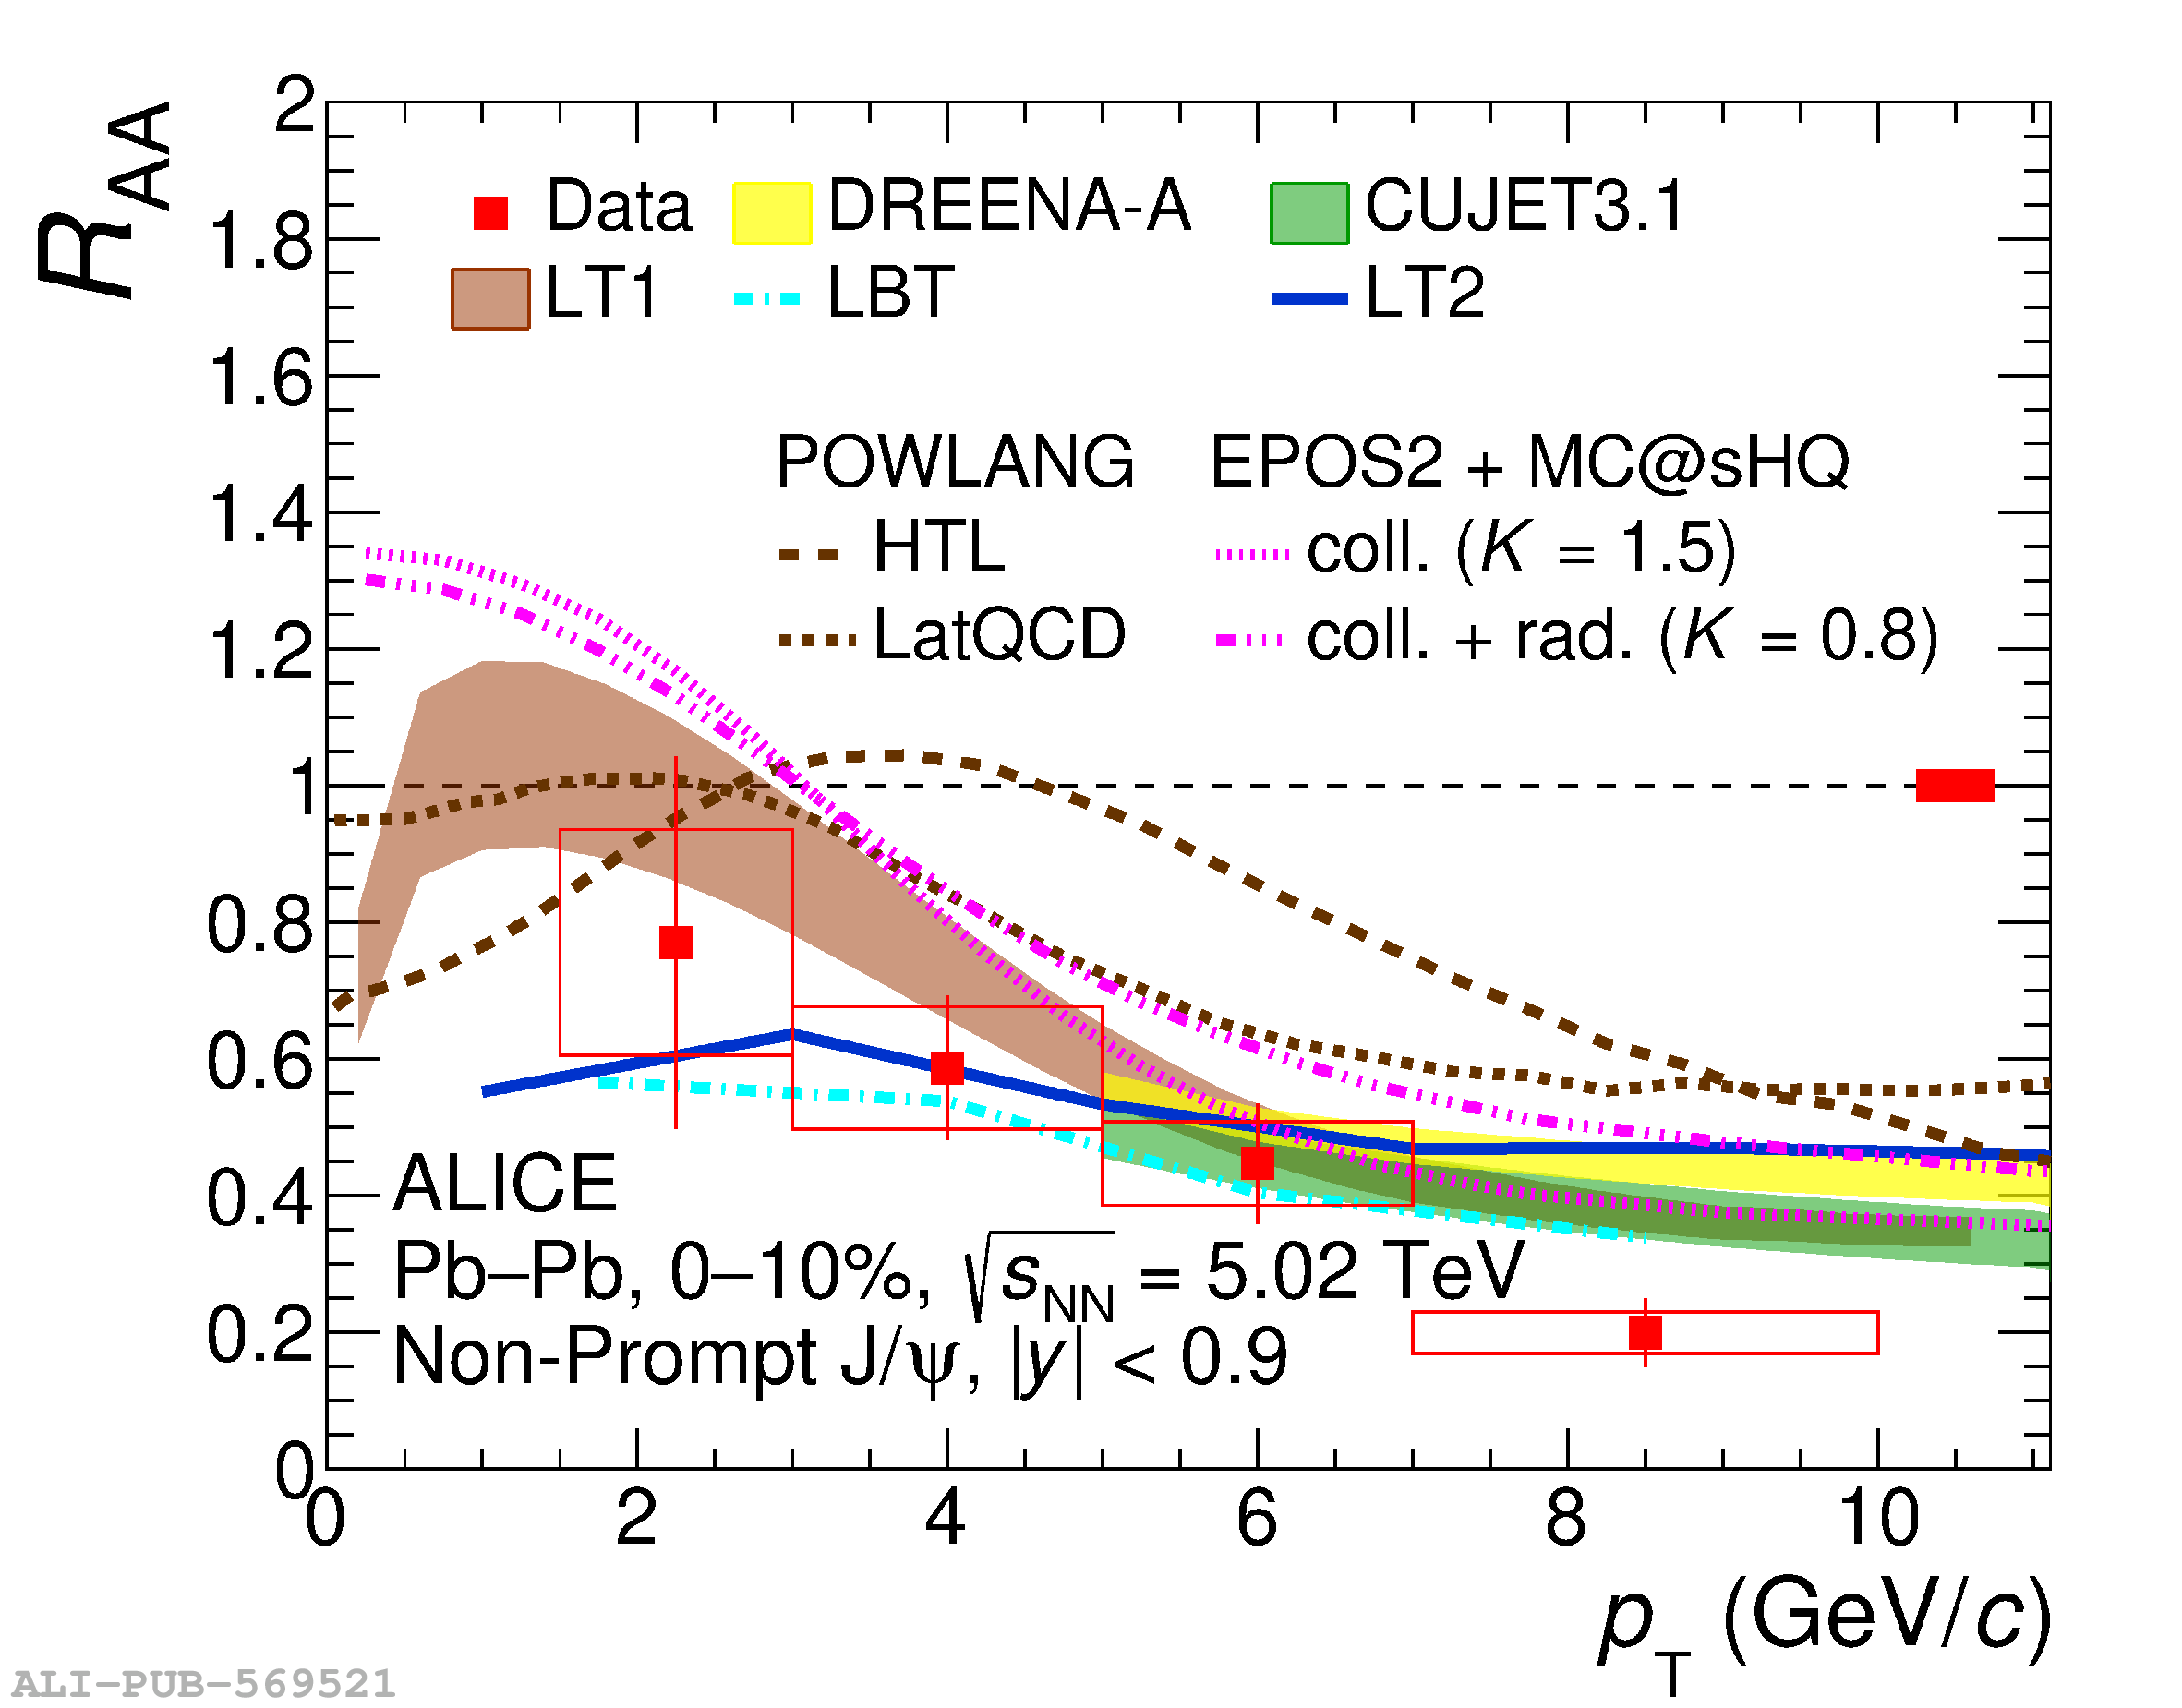 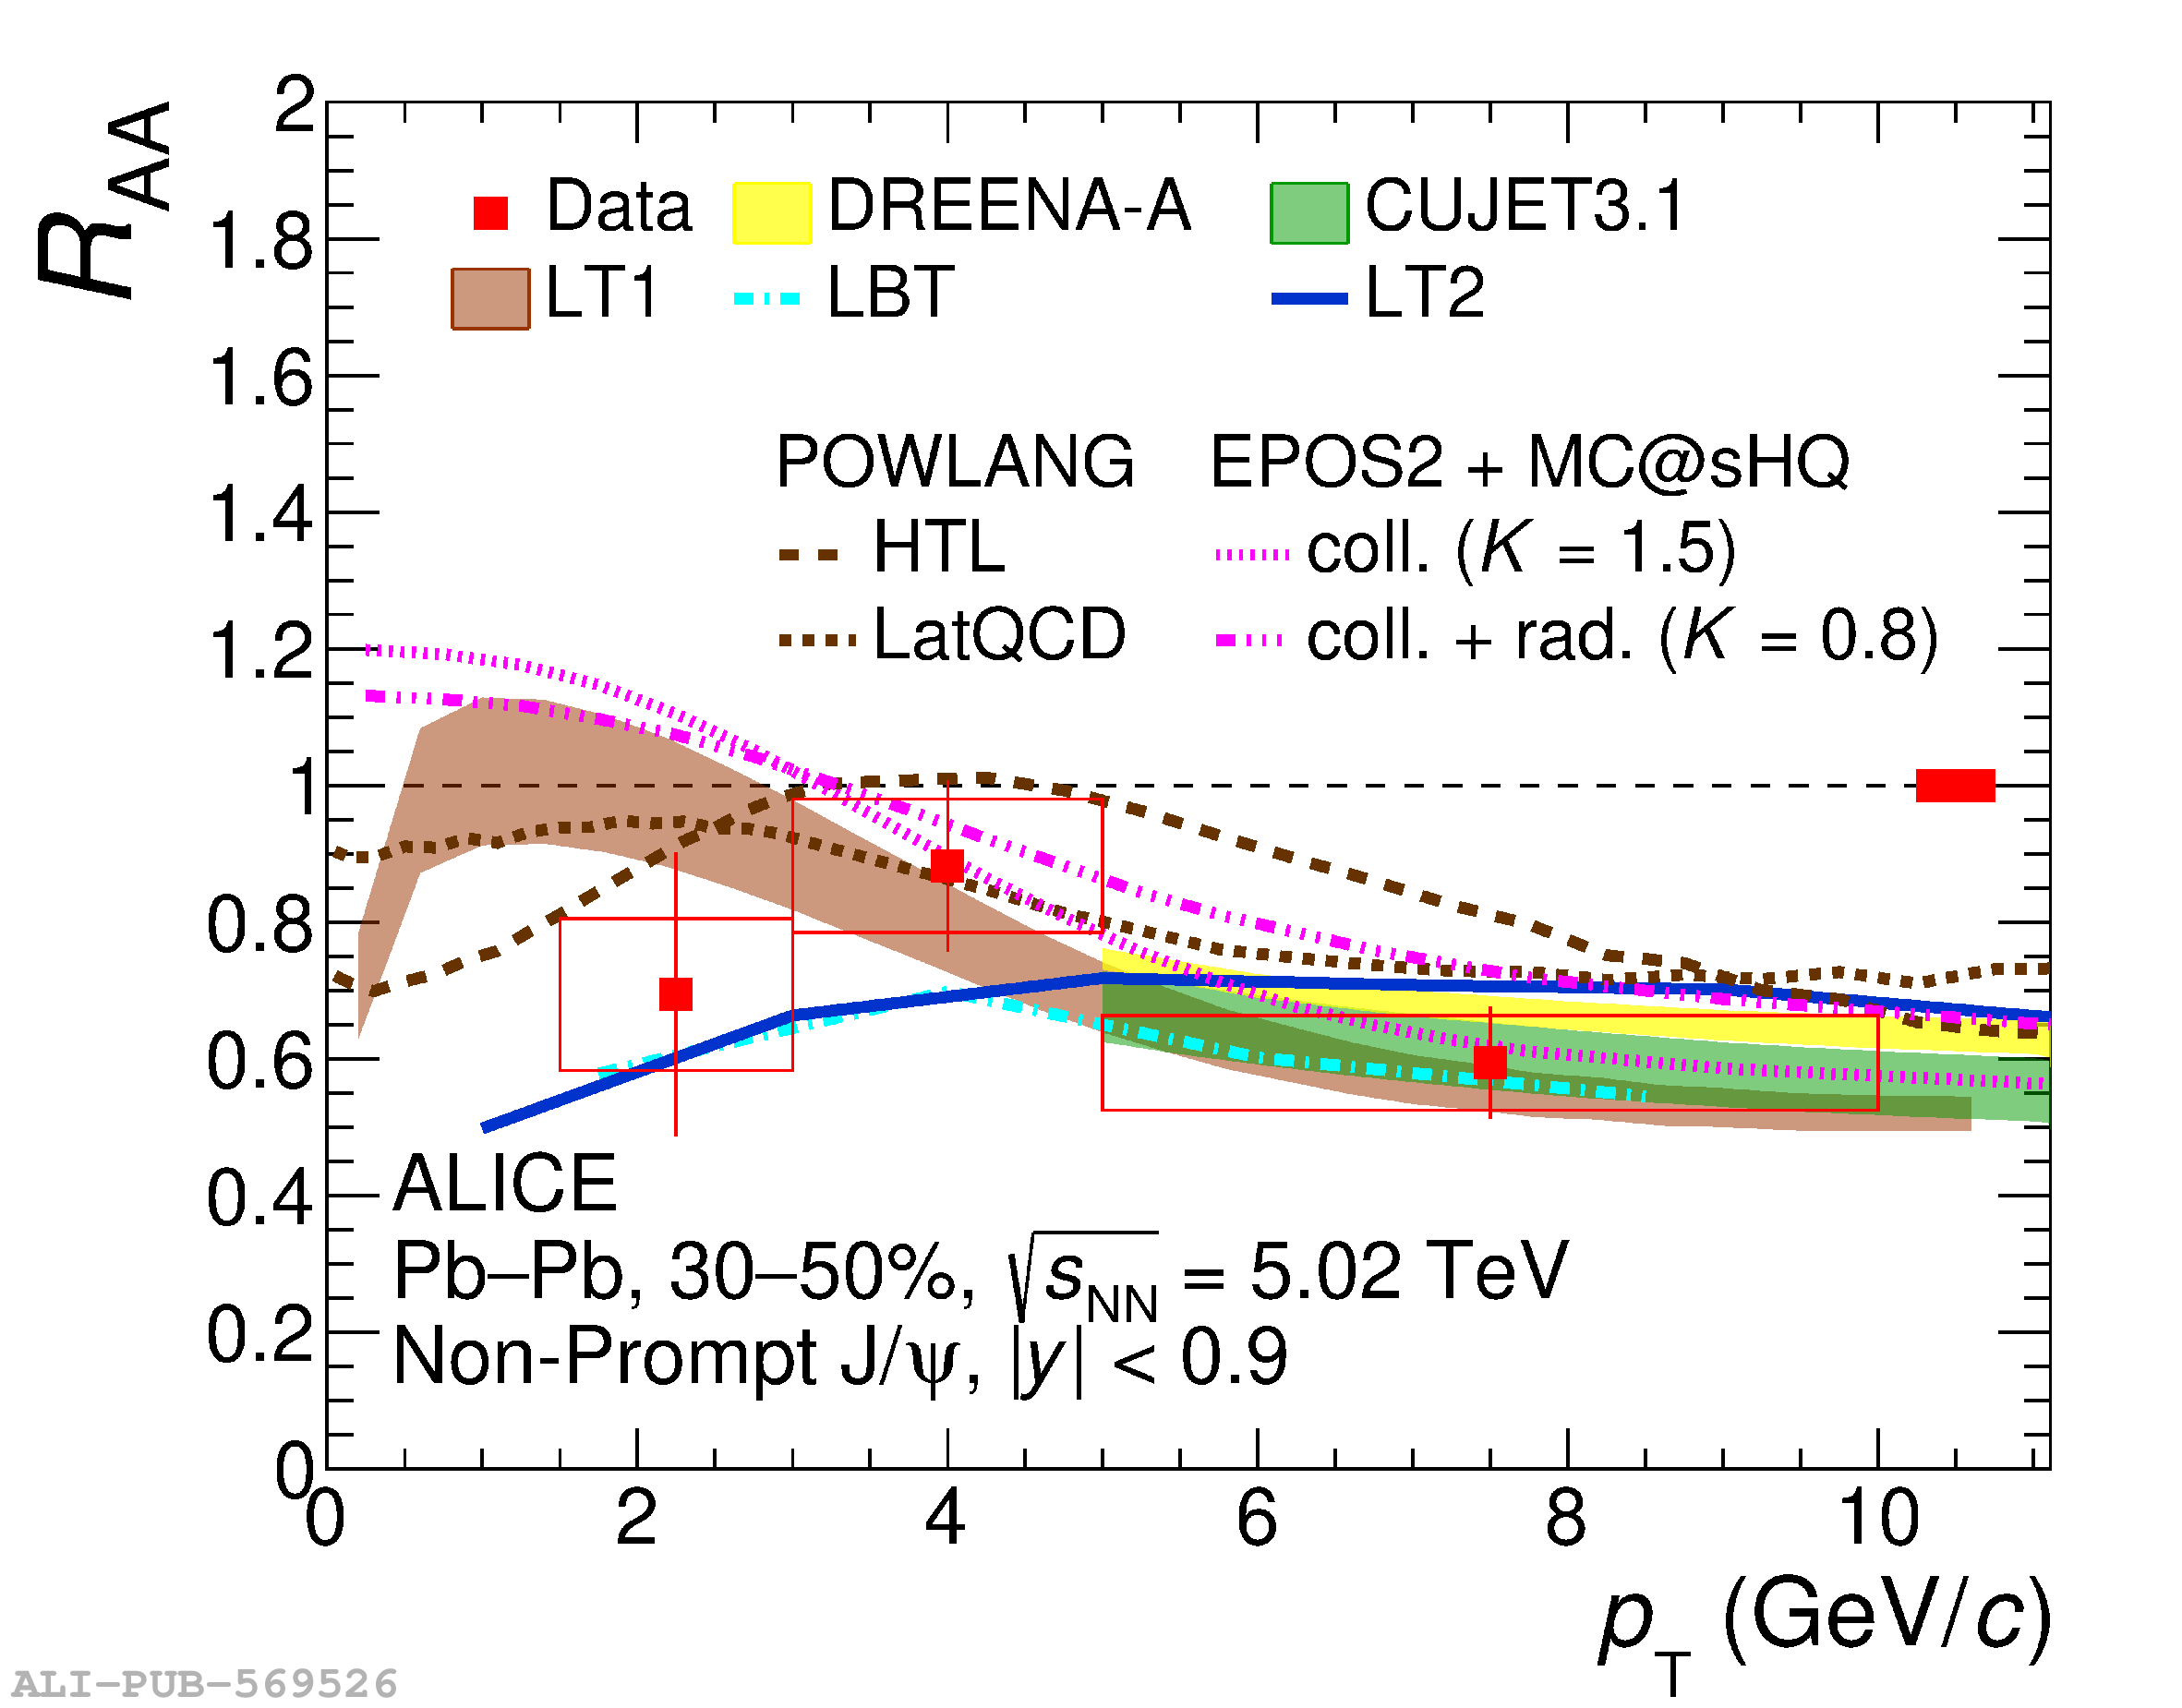 |