The ALICE Collaboration at the CERN LHC has measured the inclusive production cross section of isolated photons at midrapidity as a function of the photon transverse momentum ($p_{\rm T}^{\gamma}$), in Pb$-$Pb collisions in different centrality intervals, and in pp collisions, at centre-of-momentum energy per nucleon pair of $\sqrt{s_{\rm NN}}=5.02$ TeV. The photon transverse momentum range is between 10-14 and 40-140 GeV/$c$, depending on the collision system and on the Pb$-$Pb centrality class. The result extends to lower $p_{\rm T}^{\gamma}$ than previously published results by the ATLAS and CMS experiments at the same collision energy. The covered pseudorapidity range is $|\eta^{\gamma}| <~0.67$. The isolation selection is based on a charged particle isolation momentum threshold $p_{\rm T}^{\rm iso,~ch} = 1.5$ GeV/$c$ within a cone of radii $R=0.2$ and $0.4$. The nuclear modification factor is calculated and found to be consistent with unity in all centrality classes, and also consistent with the HG-PYTHIA model, which describes the event selection and geometry biases that affect the centrality determination in peripheral Pb$-$Pb collisions. The measurement is compared to next-to-leading order perturbative QCD calculations and to the measurements of isolated photons and Z$^0$ bosons from the CMS experiment, which are all found to be in agreement.
Eur. Phys. J. C (2025) 85:553
HEP Data
e-Print: arXiv:2409.12641 | PDF | inSPIRE
CERN-EP-2024-244
Figure group
Figure 1
Inclusive-cluster $\sigma_{\text {long, }5\times 5}^{2}$ distribution as a function of $p_{\rm T}$ in data for pp (bottom left frame) and Pb$-$Pb collisions for two different centrality classes 0$-$10% central (top left frame) and 30$-$50% semi-central (top right frame). The dotted line corresponds to the tight value of the upper selection limit for single photon candidate clusters (narrow clusters), and the dashed line corresponds to a looser photon upper selection used in Pb$-$Pb collisions below 18 GeV/$c$. The dotted-dashed line corresponds to the narrow cluster's lower limit. |  |
Figure 2
Inclusive-cluster $\sigma_{\text {long, }5\times 5}^{2}$ distribution in data (black bullets) and PYTHIA 8 simulation (jet$-$jet + $\gamma-$jet processes, blue squares). The four panels display these distributions for two selected cluster $p_{\rm T}$ ranges, 12 $< p_{\rm T}< $ 14 GeV/$c$ on the left and 40 $< p_{\rm T}< $ 60 GeV/$c$ on the right, and two collision systems: pp (top) and Pb$-$Pb 0$-$10% central (bottom). The simulation is decomposed in its different particle origins: prompt $\gamma$ ($\gamma^{\rm prompt}$, green line), not merged decay $\gamma$ ($\gamma^{\rm decay}$, blue area), merged decay photon clusters ($\gamma\gamma$) from $\pi^{0}$ (red area) or $\eta$ (brown area). The threshold value $\sigma_{\text {long, }5\times 5}^{2} =$ 0.3 or 0.392 (corresponding to $\sigma_{\rm max}^{2}$(13 GeV/$c$)) is shown on all plots as a dotted or dashed vertical line, respectively. |   |

Figure 4
$\rho^{\rm UE}$ distributions normalised by the number of events in each centrality class in data calculated in the $\eta$-band with $\Delta R_{\text{UE gap}}=0.1$ out of an isolation cone centred at inclusive clusters with $p_{\rm T} > 10$ GeV/$c$. Left: for Pb$-$Pb collisions and the cone radius $R=0.2$ as a function of centrality. Right: for pp and Pb$-$Pb collisions for different centrality classes for the cone radius $R=0.4$. |  |
Figure 5
$p_{\rm T}^{\text{iso, ch}}$ distribution for narrow clusters with $0.1< \sigma_{\text {long, }5\times 5}^{2}< 0.3$ for $p_{\rm T} > 16$ GeV/$c$, in pp (bottom left frame) and Pb$-$Pb collisions in two centrality classes, $0-10$% central (top left frame) and $70-90$% peripheral (top right frame), with $R=0.2$ (black bullets) and $R=0.4$ (blue squares), in data (full markers) and simulated PYTHIA 8 $\gamma$$-$jet (open markers), embedded into data in the considered centrality class for the Pb$-$Pb collision case. |  |
Figure 6
Purity of the isolated-photon sample as a function of $p_{\rm T}^{\gamma}$ calculated using Eq. (5) and with the statistical and systematic uncertainty discussed in Sect. 4 for $R=0.2$ and $0.4$. The curves (plain for low $p_{\rm T}^{\gamma}$, dashed for high $p_{\rm T}^{\gamma}$) are the two sigmoid functions as defined in Eq. (6), obtained by fitting the points as explained in the text. |  |
Figure 7
Contributions from reconstruction, identification, and isolation to the total efficiency calculated using Eq. (7), as a function of the reconstructed photon $p_{\rm T}^{\gamma}$ for pp (bottom left frame) collisions and Pb$-$Pb collisions for two centrality classes: 0$-$10% (upper left frame) and 70$-$90% (upper right frame). Green markers: reconstruction efficiency $\varepsilon^{\mathrm{rec}}$. Red or brown markers: efficiency additionally due to the photon identification by shower shape selection $\varepsilon^{\mathrm{rec}} \times \varepsilon^{\mathrm{id}}$ or the isolation criterion $\varepsilon^{\mathrm{rec}} \times \varepsilon^{\mathrm{iso}}$. Blue markers: efficiency due to the isolation criterion and shower shape selection $\varepsilon^{\mathrm{rec}} \times \varepsilon^{\mathrm{id}} \times \varepsilon^{\mathrm{iso}}$. Black markers: fraction $\kappa^{\mathrm{iso}}$ of generated photons which are isolated. The efficiency is obtained from PYTHIA 8 simulations of pp collisions $\gamma-$jet processes, embedded into data in the considered centrality class for the Pb$-$Pb collision case. |  |
Figure 8
Total isolated-photon efficiency as a function of $p_{\rm T}^{\gamma}$ calculated using Eq. (7) with the systematic uncertainty discussed in Sect. 4 for $R=0.2$ and $0.4$, for pp collisions and Pb$-$Pb collisions for five centrality classes. The efficiency is obtained from PYTHIA 8 simulations of pp collisions $\gamma-$jet processes, embedded into data in the considered centrality class for the Pb$-$Pb collision case. |  |
Figure 9
Left: L1-$\gamma$ trigger efficiency for inclusive clusters and isolated-narrow clusters with $R=0.2$ (similar for $R=0.4$) obtained with PYTHIA 8 simulations combining $\gamma-$jet and jet$-$jet processes, embedded in data in the considered centrality class for Pb$-$Pb collisions and considering the corresponding trigger thresholds ($E_{\rm trig}$) in each system. Right: L1-$\gamma$ trigger rejection factor calculated by applying the trigger efficiency for pp collisions and for each of the Pb$-$Pb centrality classes considered. Solid lines over points result from a constant fit, values given in Table 2, dashed lines indicate the fit uncertainty obtained with the procedure explained in Sect. 4. For clusters above 12 GeV/$c$ and peripheral Pb$-$Pb collisions, the rejection factor and trigger efficiency are calculated for the sum of the two triggered samples with thresholds at 5 and 10 GeV. | 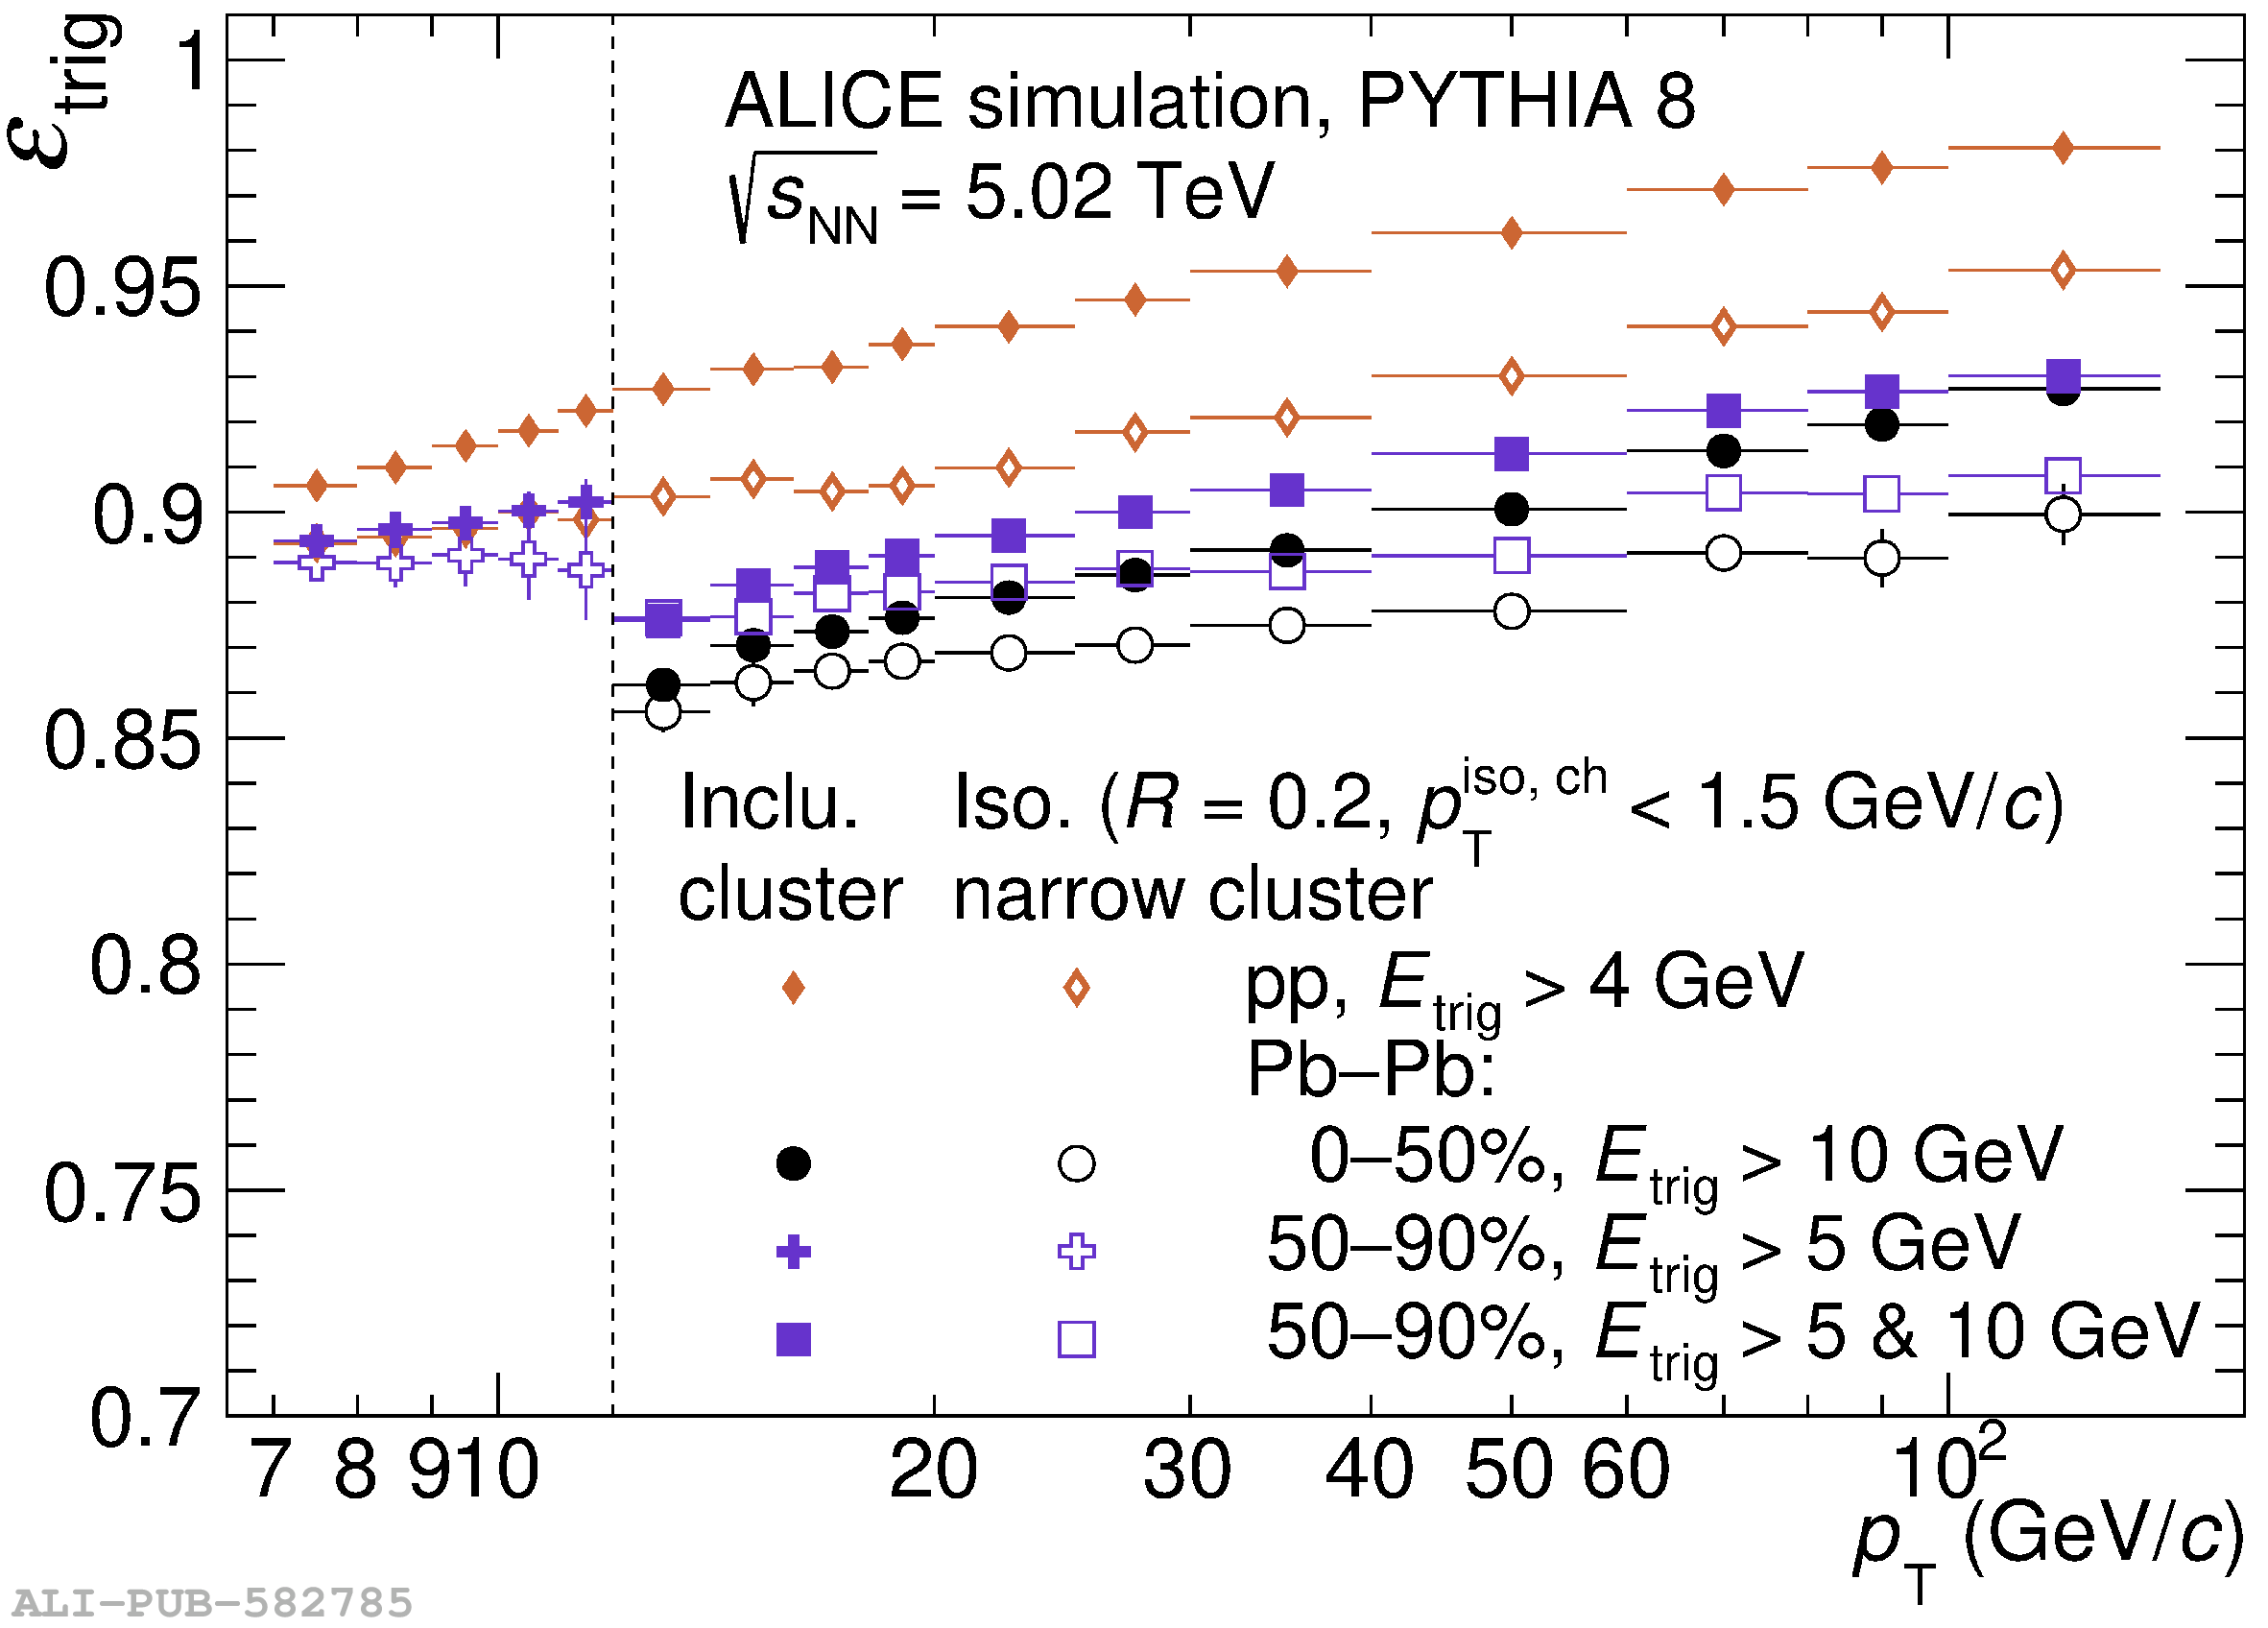  |
Figure 10
Contributions to the systematic uncertainty of the isolated-photon purity and their quadratic sum as a function of $p_{\rm T}^{\gamma}$ for $R=0.2$, in pp collisions (bottom left frame) and two Pb$-$Pb collision centrality classes: 0$-$10% (top left frame) and 30$-$50% (top right frame). The statistical uncertainty is also shown and may appear larger than the total uncertainty as a result of the smoothing done by the fit over the purity (see text). |  |
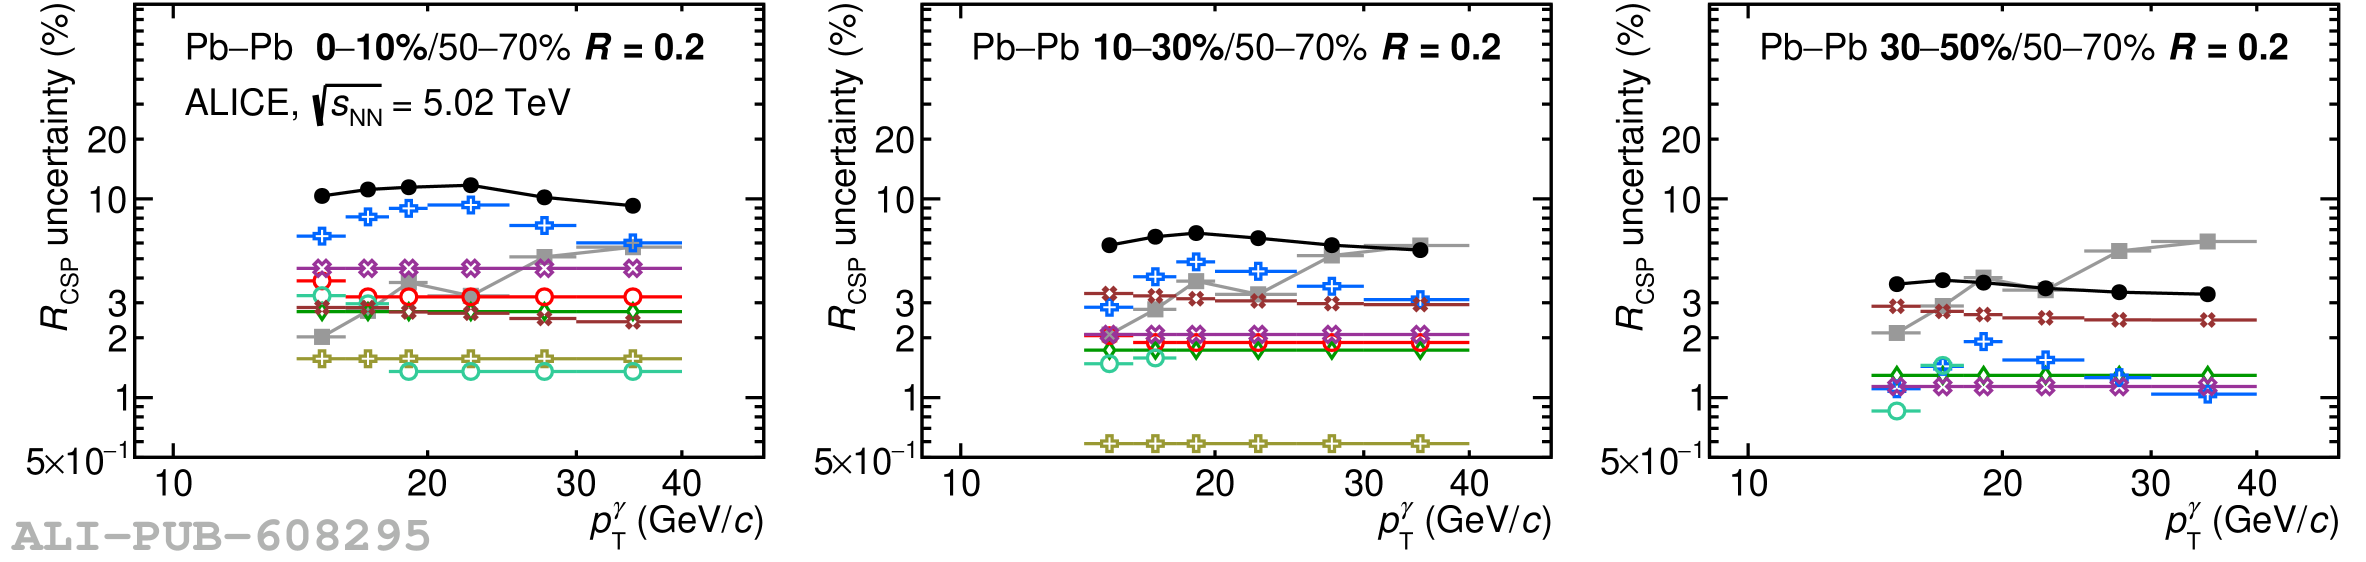
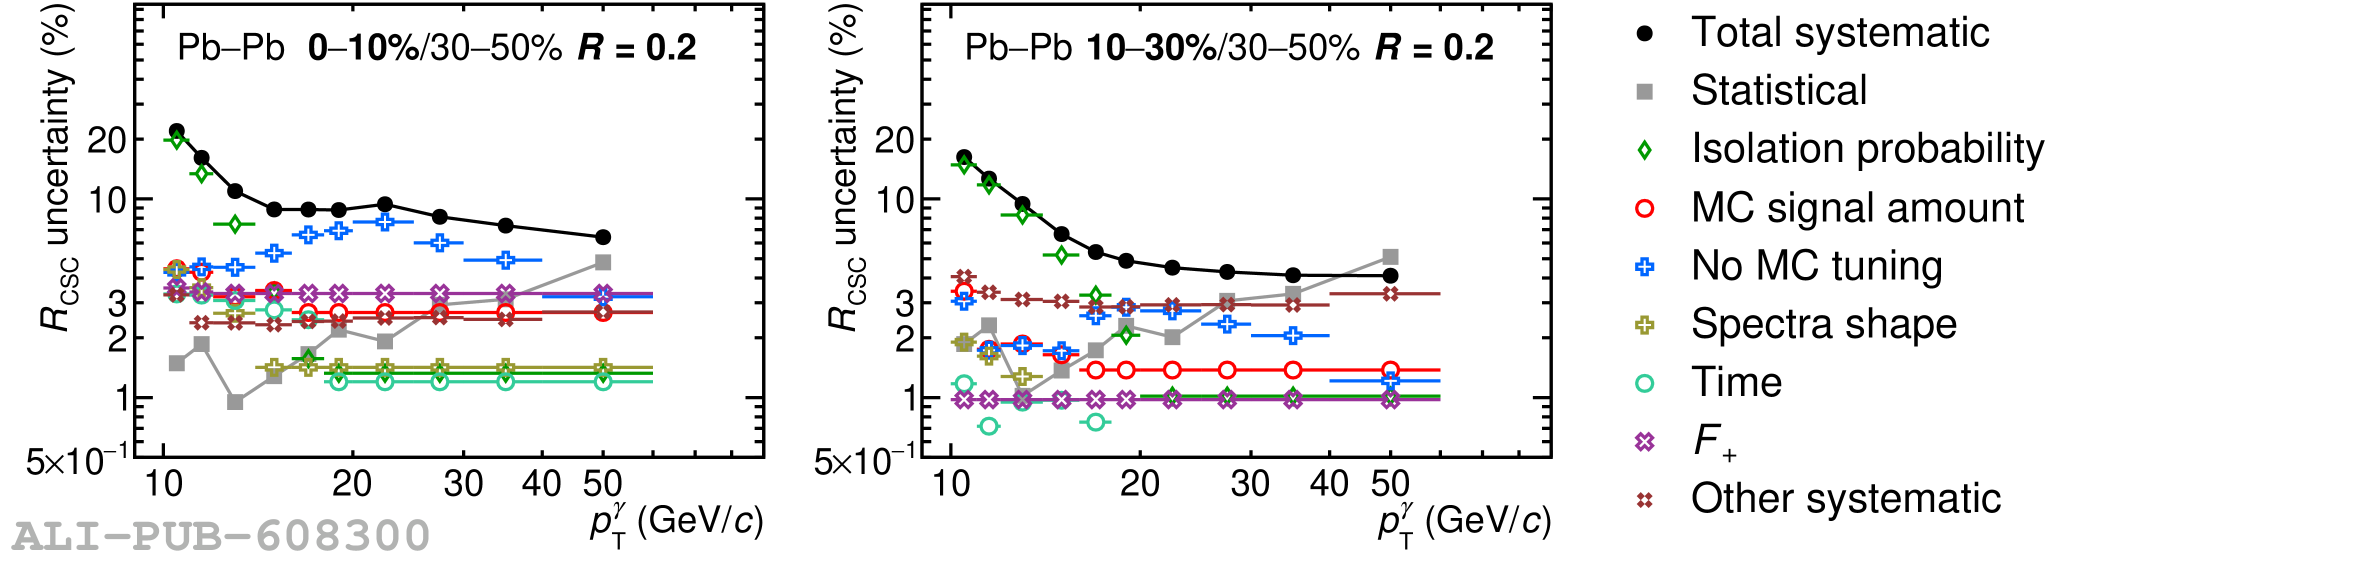
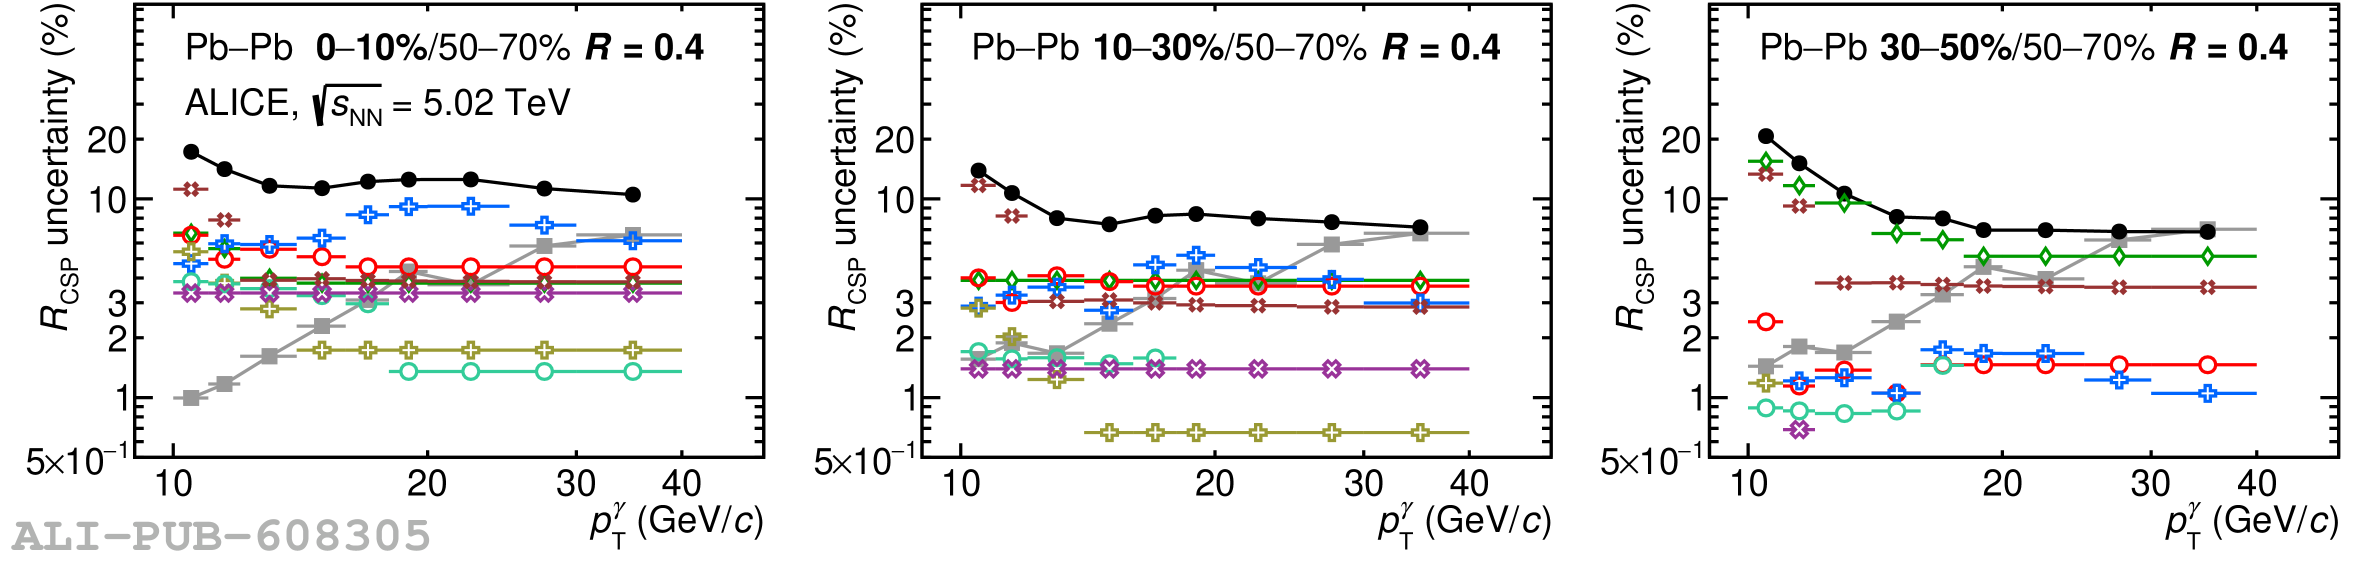
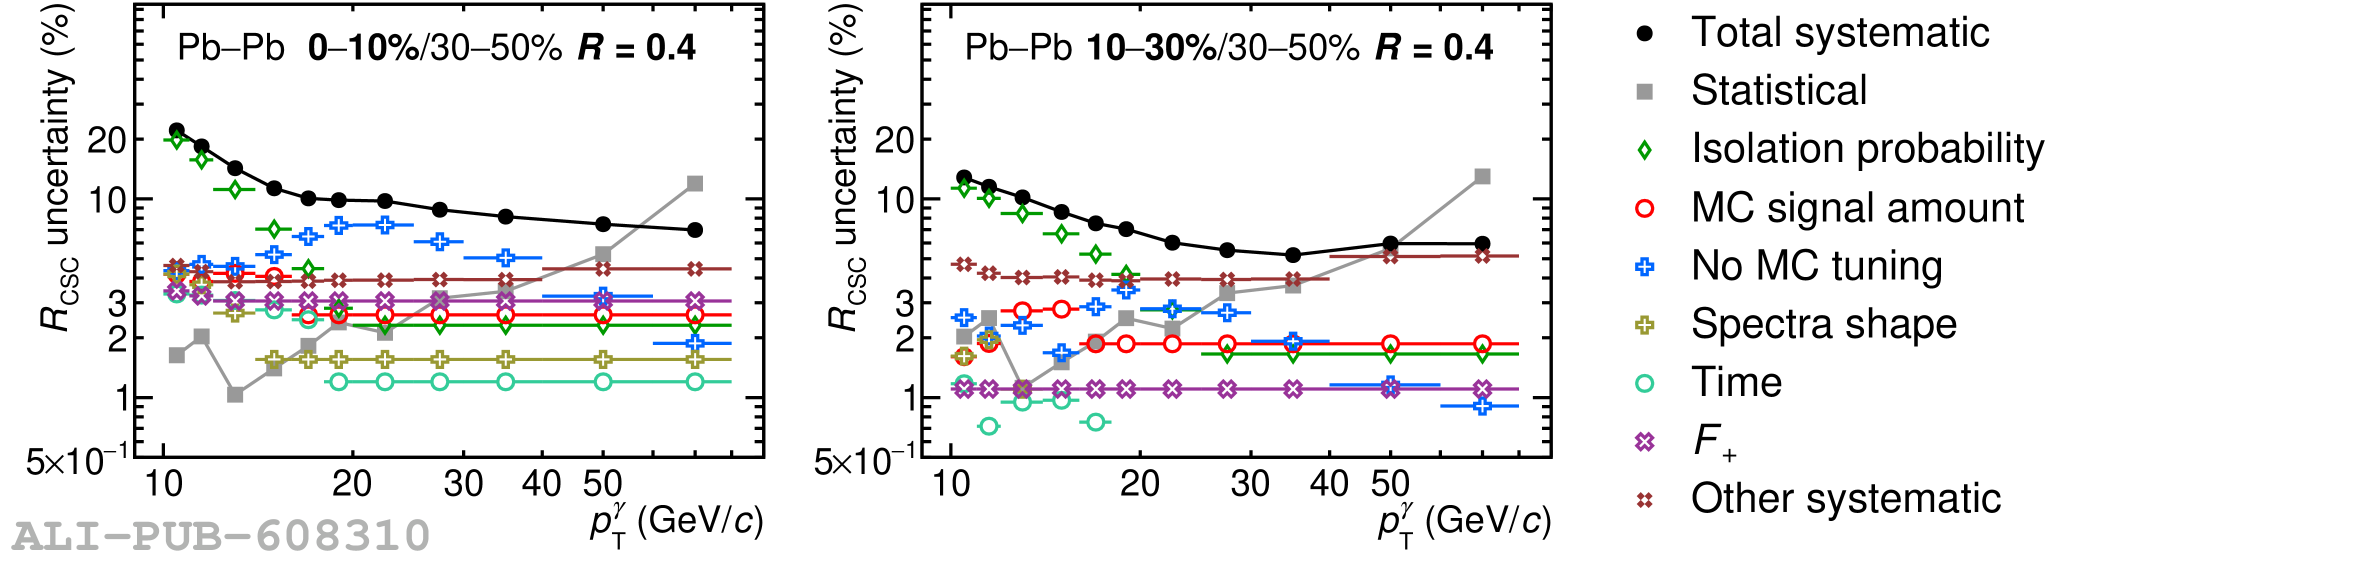
Figure 11
Contributions to the systematic uncertainty of the isolated-photon cross section and their quadratic sum as a function of $p_{\rm T}^{\gamma}$ for $R=0.2$ in pp collisions (bottom left frame) and two Pb$-$Pb collision centrality classes: 0$-$10% (top left frame) and 30$-$50% (top right frame). Statistical uncertainty is also shown. |  |
Figure 12
Left: Isolated-photon differential cross section measured in pp and Pb$-$Pb collisions at $\sqrt{s_{\rm NN}} = 5.02$ TeV for five Pb$-$Pb centrality classes for $R=0.2$. Error bars and boxes are the statistical and systematic uncertainties, respectively. The bands correspond to NLO pQCD calculations with JETPHOX, for Pb$-$Pb collisions calculated for the 0$-$100% centrality class and scaled by $\langle N_{\rm coll} \rangle$. Right: Ratio of data over JETPHOX NLO pQCD calculations. The bands centred at unity correspond to the JETPHOX pQCD calculations, their width represents the scale (blue) uncertainty and PDF (orange) uncertainty. The normalisation uncertainties are not included in the left panel but they are shown in the right panel as a grey box on the right of each of the frames around unity. | 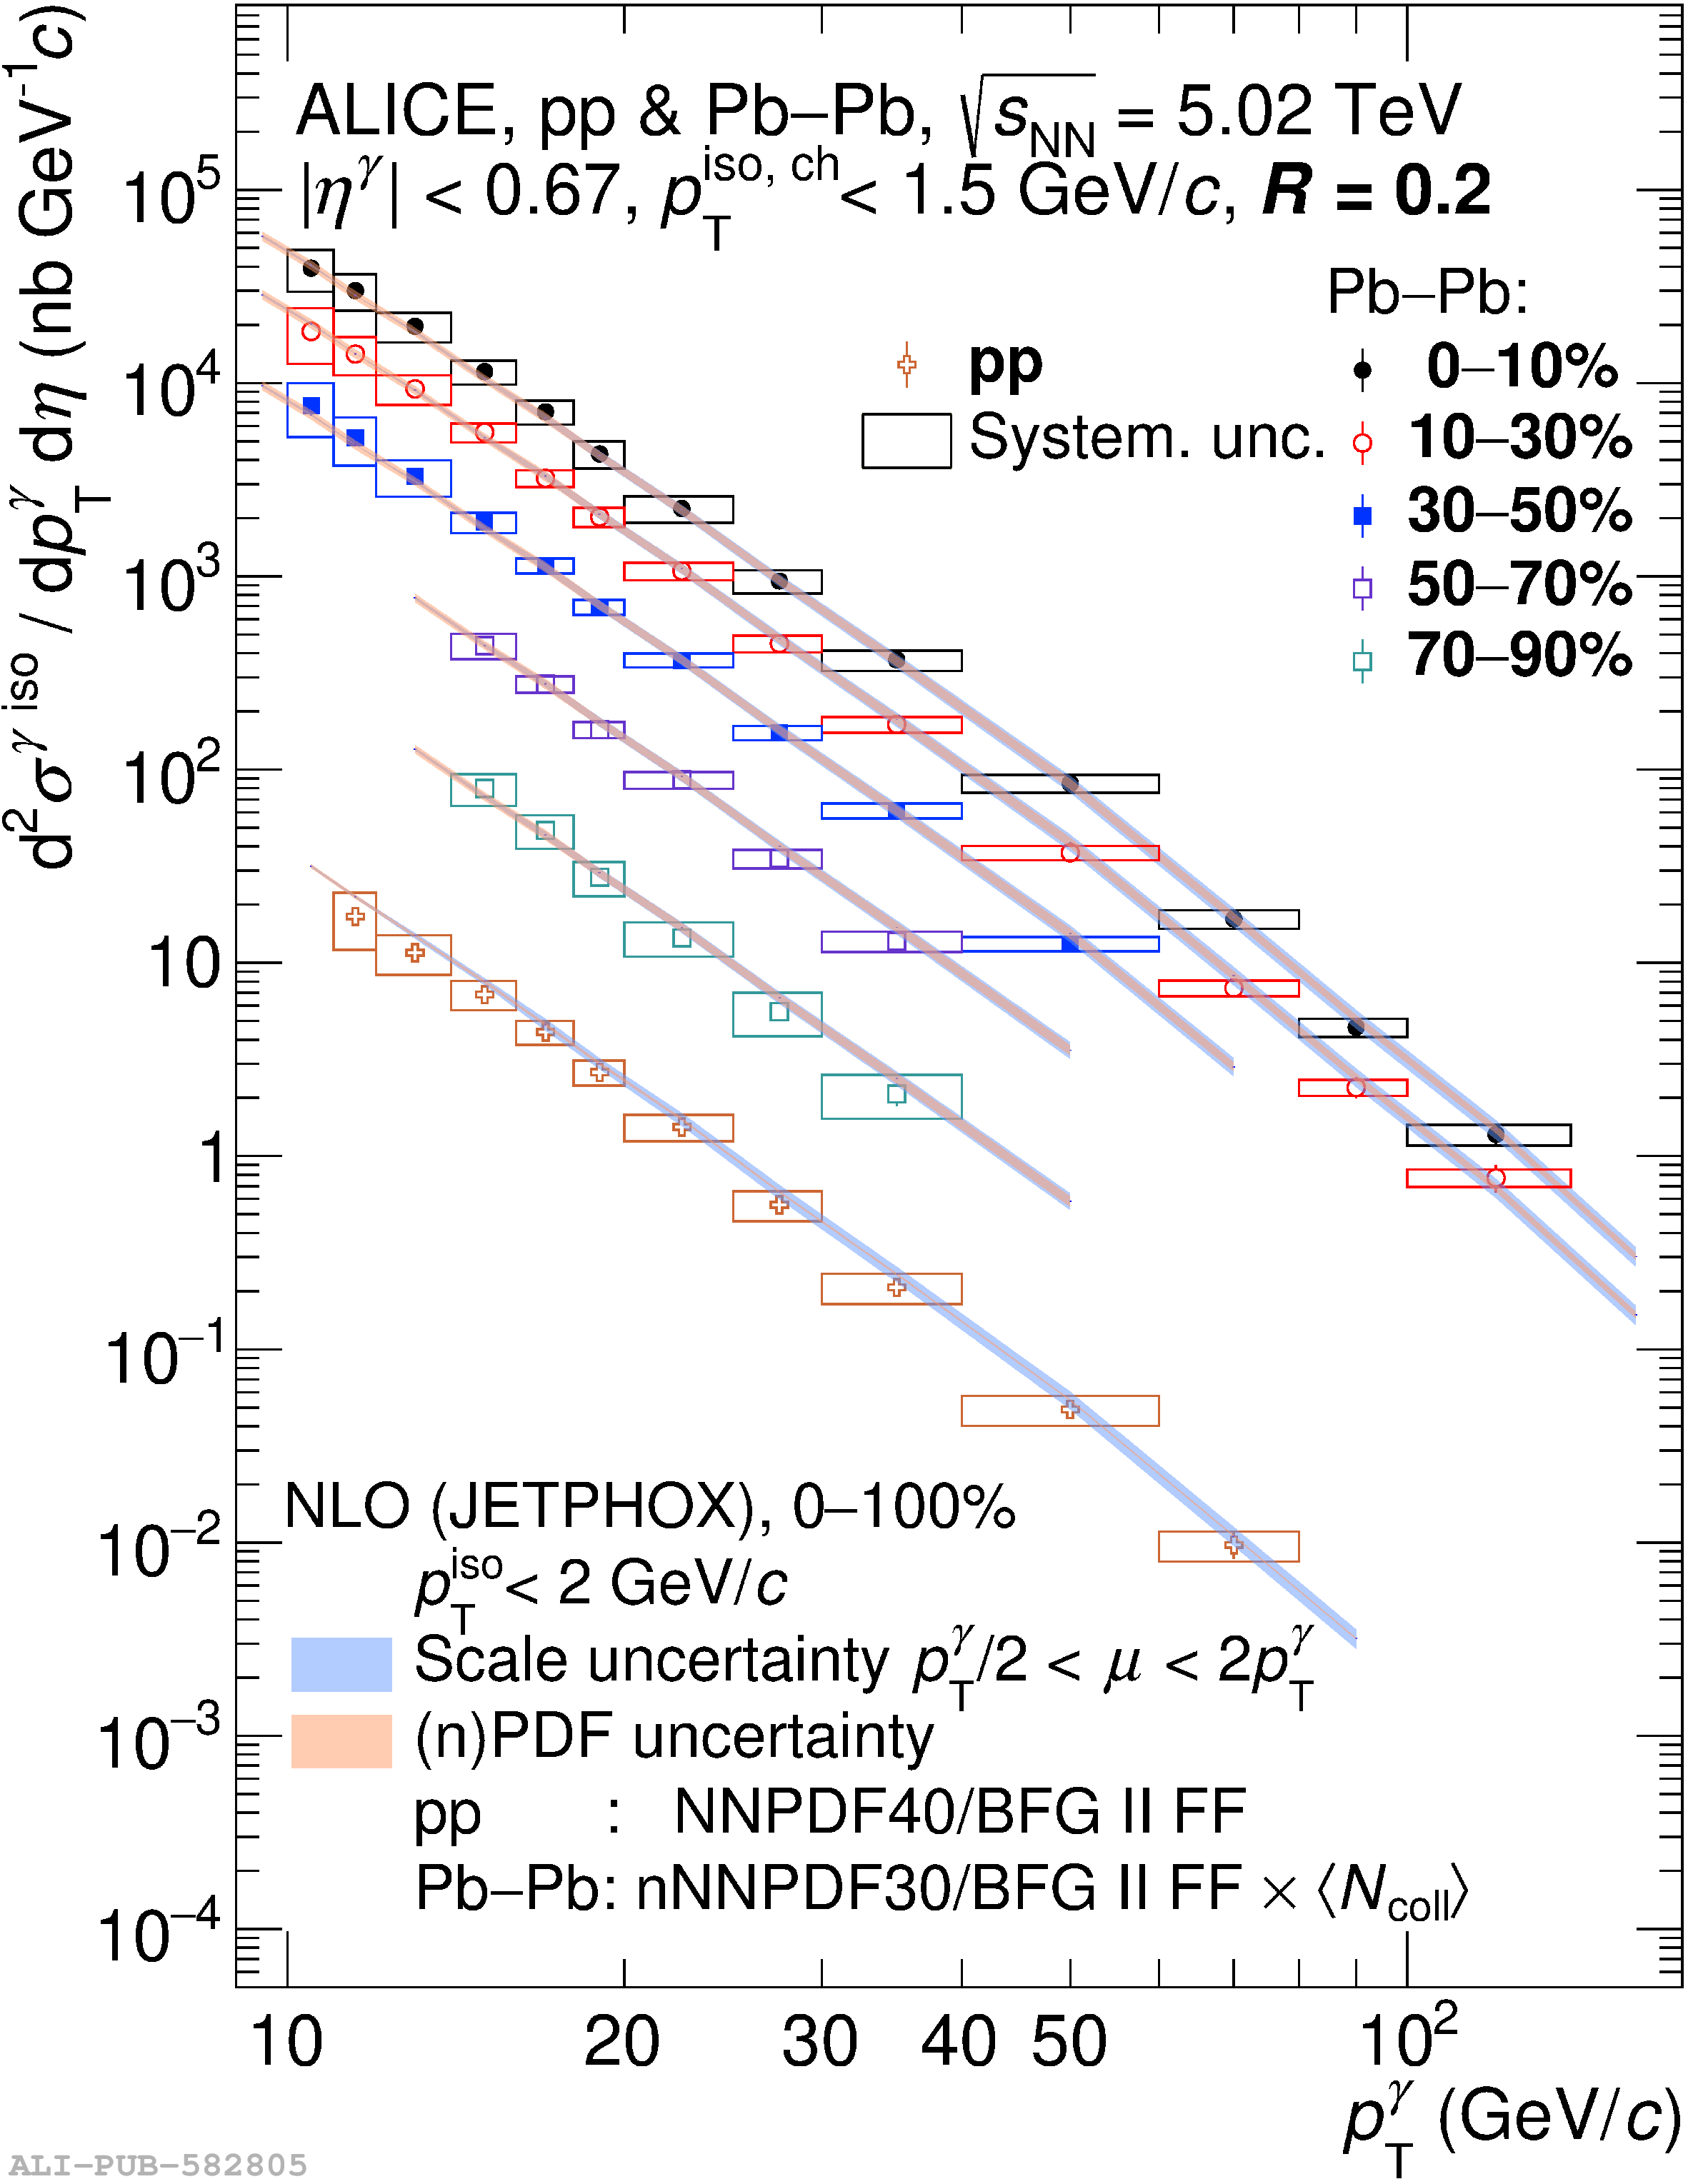  |
Figure 13
Left: Isolated-photon differential cross section measured in pp and Pb$-$Pb collisions at $\sqrt{s_{\rm NN}} = 5.02$ TeV for five Pb$-$Pb centrality classes for $R=0.4$. Error bars and boxes are the statistical and systematic uncertainties, respectively. The bands correspond to NLO pQCD calculations with JETPHOX, for Pb$-$Pb collisions calculated for the 0$-$100% centrality class and scaled by $\langle N_{\rm coll} \rangle$. Right: Ratio of data over JETPHOX NLO pQCD calculations. The bands centred at unity correspond to the JETPHOX pQCD calculations, their width represents the scale (blue) uncertainty and PDF (orange) uncertainty. The normalisation uncertainties are not included in the left panel but they are shown in the right panel as a grey box on the right of each of the frames around unity. |   |
Figure 14
Ratio of isolated-photon cross section measured with $R=0.4$ over $R=0.2$ for Pb$-$Pb and pp collisions at $\sqrt{s_{\rm NN}} = 5.02$ TeV. Each panel for each Pb$-$Pb collision centrality class, bottom right panel for pp collisions. Error bars and boxes are the statistical and systematic uncertainties, respectively. The violet band corresponds to pQCD calculations with JETPHOX, the width represents the PDF uncertainty, and the blue vertical bars indicate the statistical uncertainty from the Monte Carlo approach. | 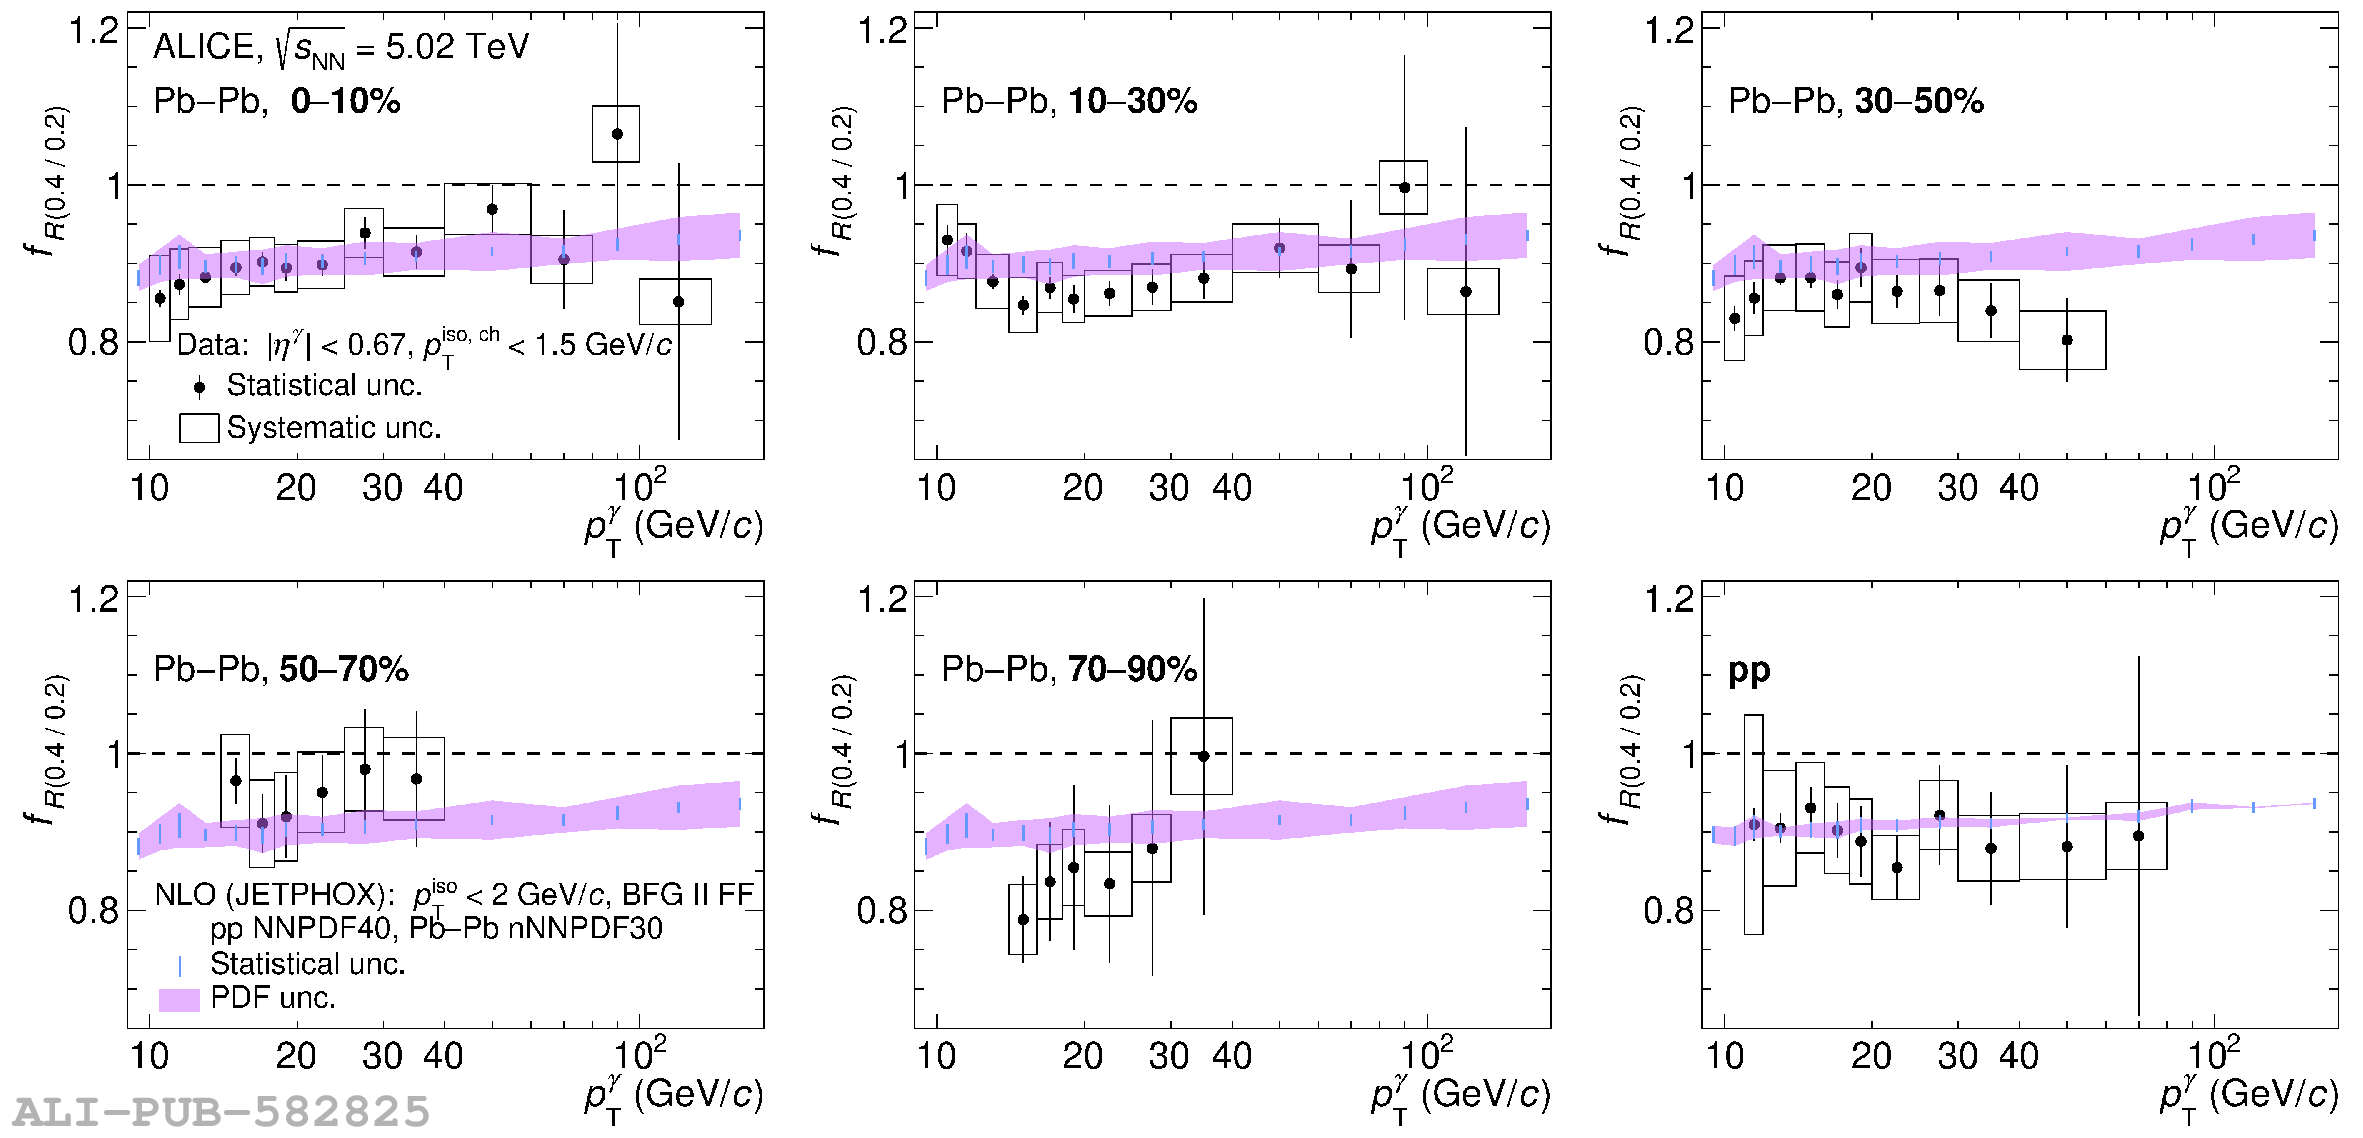 |
Figure 15
Isolated-photon cross section ratio of pp collisions at $\sqrt{s}=7$ TeV from [49] (left) and $\sqrt{s}=13$ TeV from [67] (right) over $\sqrt{s}=5.02$ TeV in data and NLO calculation from JETPHOX for $R=0.4$. Error bars and empty boxes are the data statistical and systematic uncertainties, respectively. Filled boxes represent the theory scale (orange) and PDF (pink) uncertainties. |   |
Figure 16
Nuclear modification factor $R_{\rm AA}$ for isolated photons at $\sqrt{s_{\rm NN}}=5.02$ TeV for isolation-cone radii $R=0.2$ (black) and $R=0.4$ (blue). Error bars and boxes are the statistical and systematic uncertainties, respectively. The isolated-photon $R_{\rm AA}$ is compared to that of charged particles [22] and charged pions [24] from ALICE, and to the ratio of the Z$^{0}$-boson yield in each centrality class to the 0$-$90% class measured by CMS [35]. The bands correspond to pQCD calculations with JETPHOX for Pb$-$Pb collisions (nPDF) for 0$-$100% centrality over pp collisions (PDF). The width of each band corresponds to the scale and PDF uncertainties. The normalisation uncertainties are represented as a red box centred at unity. The solid line in the most peripheral centrality class 70$-$90% at $R_{\rm AA}=$ 0.82 corresponds to the HG-PYTHIA model expectation [41]. |  |
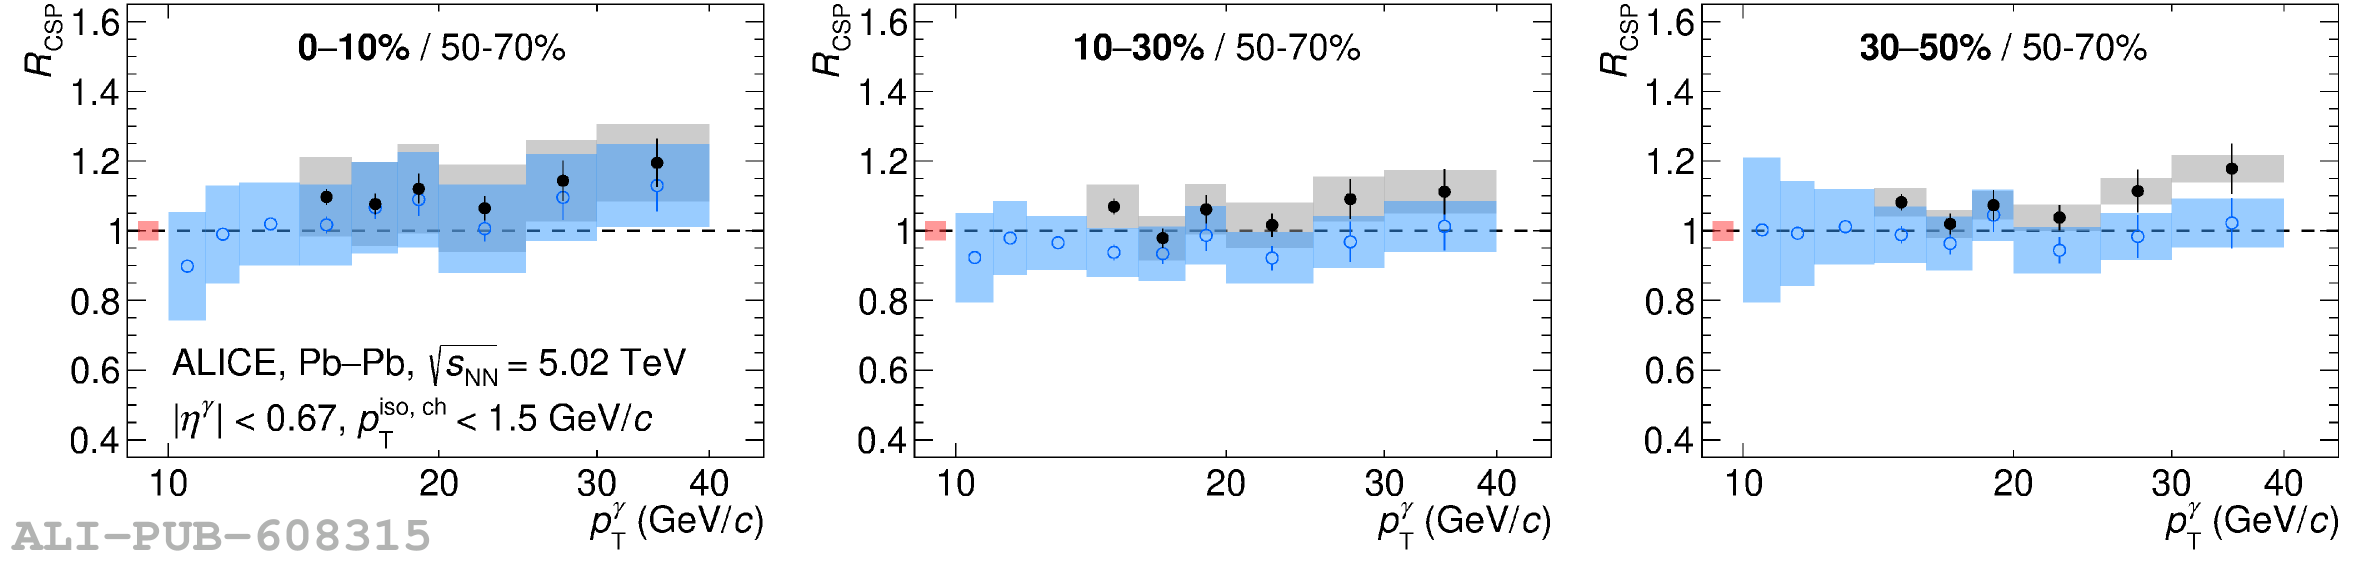
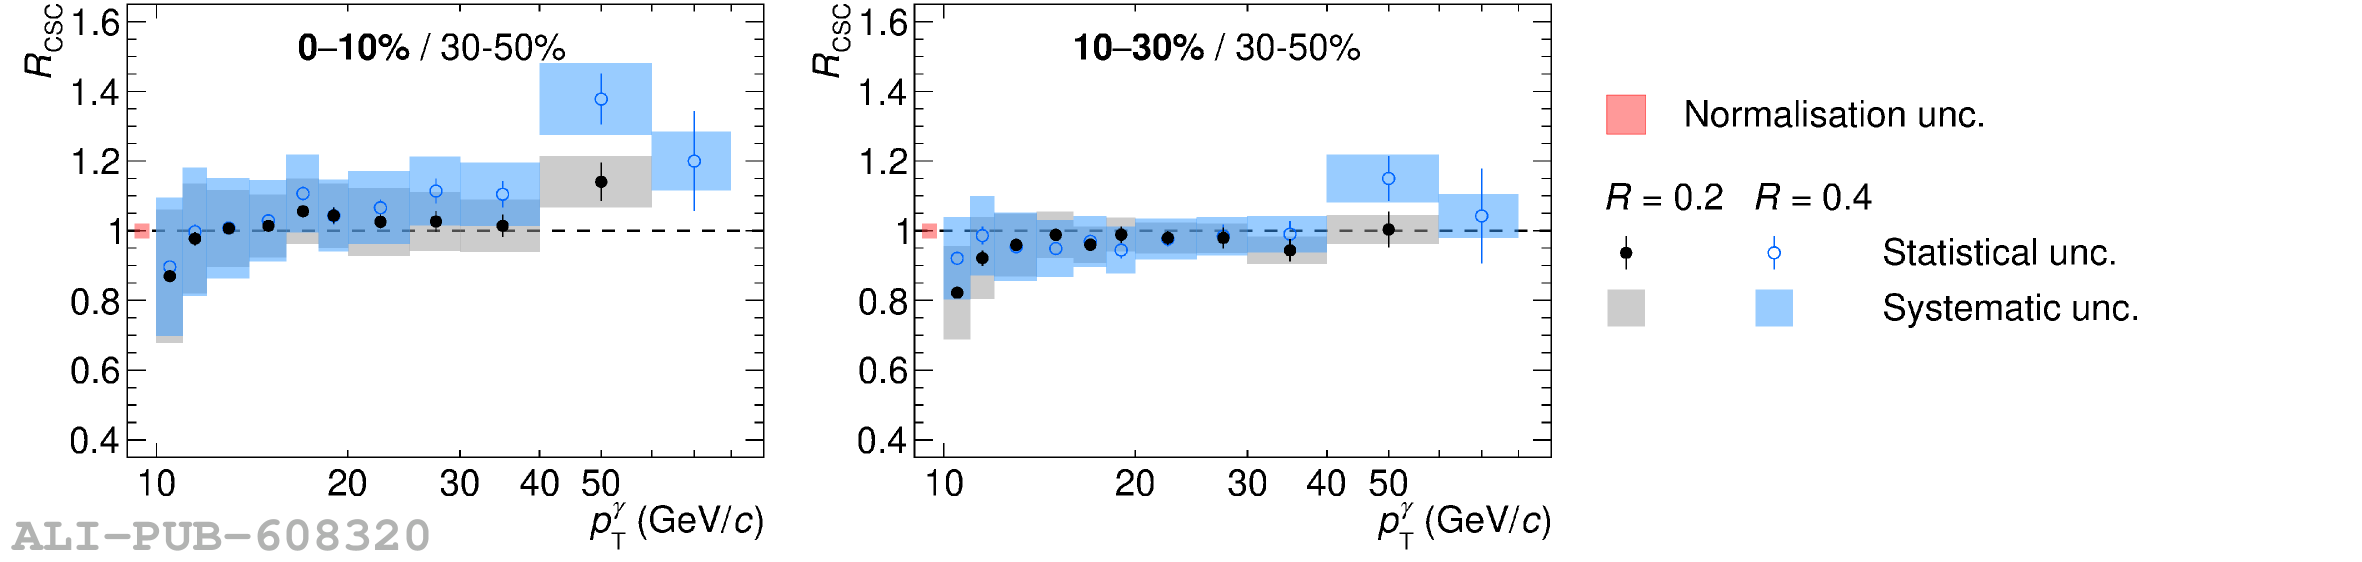
Figure 17
Nuclear modification factor $R_{\rm AA}$ for isolated photons measured by ALICE for isolation-cone radii $R=0.2$ and $R=0.4$ and CMS [38] for isolation-cone radius $R=0.4$ at $\sqrt{s_{\rm NN}} = 5.02$ TeV and for four centrality classes. Error bars and boxes are the statistical and systematic uncertainties, respectively. The solid line in the peripheral centrality class 50$-$90% at $R_{\rm AA}=$ 0.91, is the result of the HG-PYTHIA model [41]. The ALICE normalisation uncertainties are represented as a red box centred at unity. For CMS, the normalisation uncertainties are displayed as a violet box for the integrated luminosity and a green box for the nuclear overlap function $\langle T_{\rm AA}\rangle=\langle N_{\rm coll} \rangle / \sigma_{\rm NN}^{\rm INEL}$. |  |
Figure P.N.1
Schematic view of the cell energy repartition of two high-energy decay photons from a neutral meson, each centred in the black-filled cells,on top of a high-multiplicity low-energy particle underlying event environment, the lightest blue cells. The pink lines are the contour of cells selected restricting the growth of the cluster (V2) used here to calculate the cluster energy and position. The orange square isthe $5\times 5$ region around the highest-energy cell used for the shower shape calculation, excluding cells that only have a common corner, red crossed. The red dotted lines are the contour of a cluster without growth restriction (V1), as used in previous \pp and \pPb isolated photon analyses . | 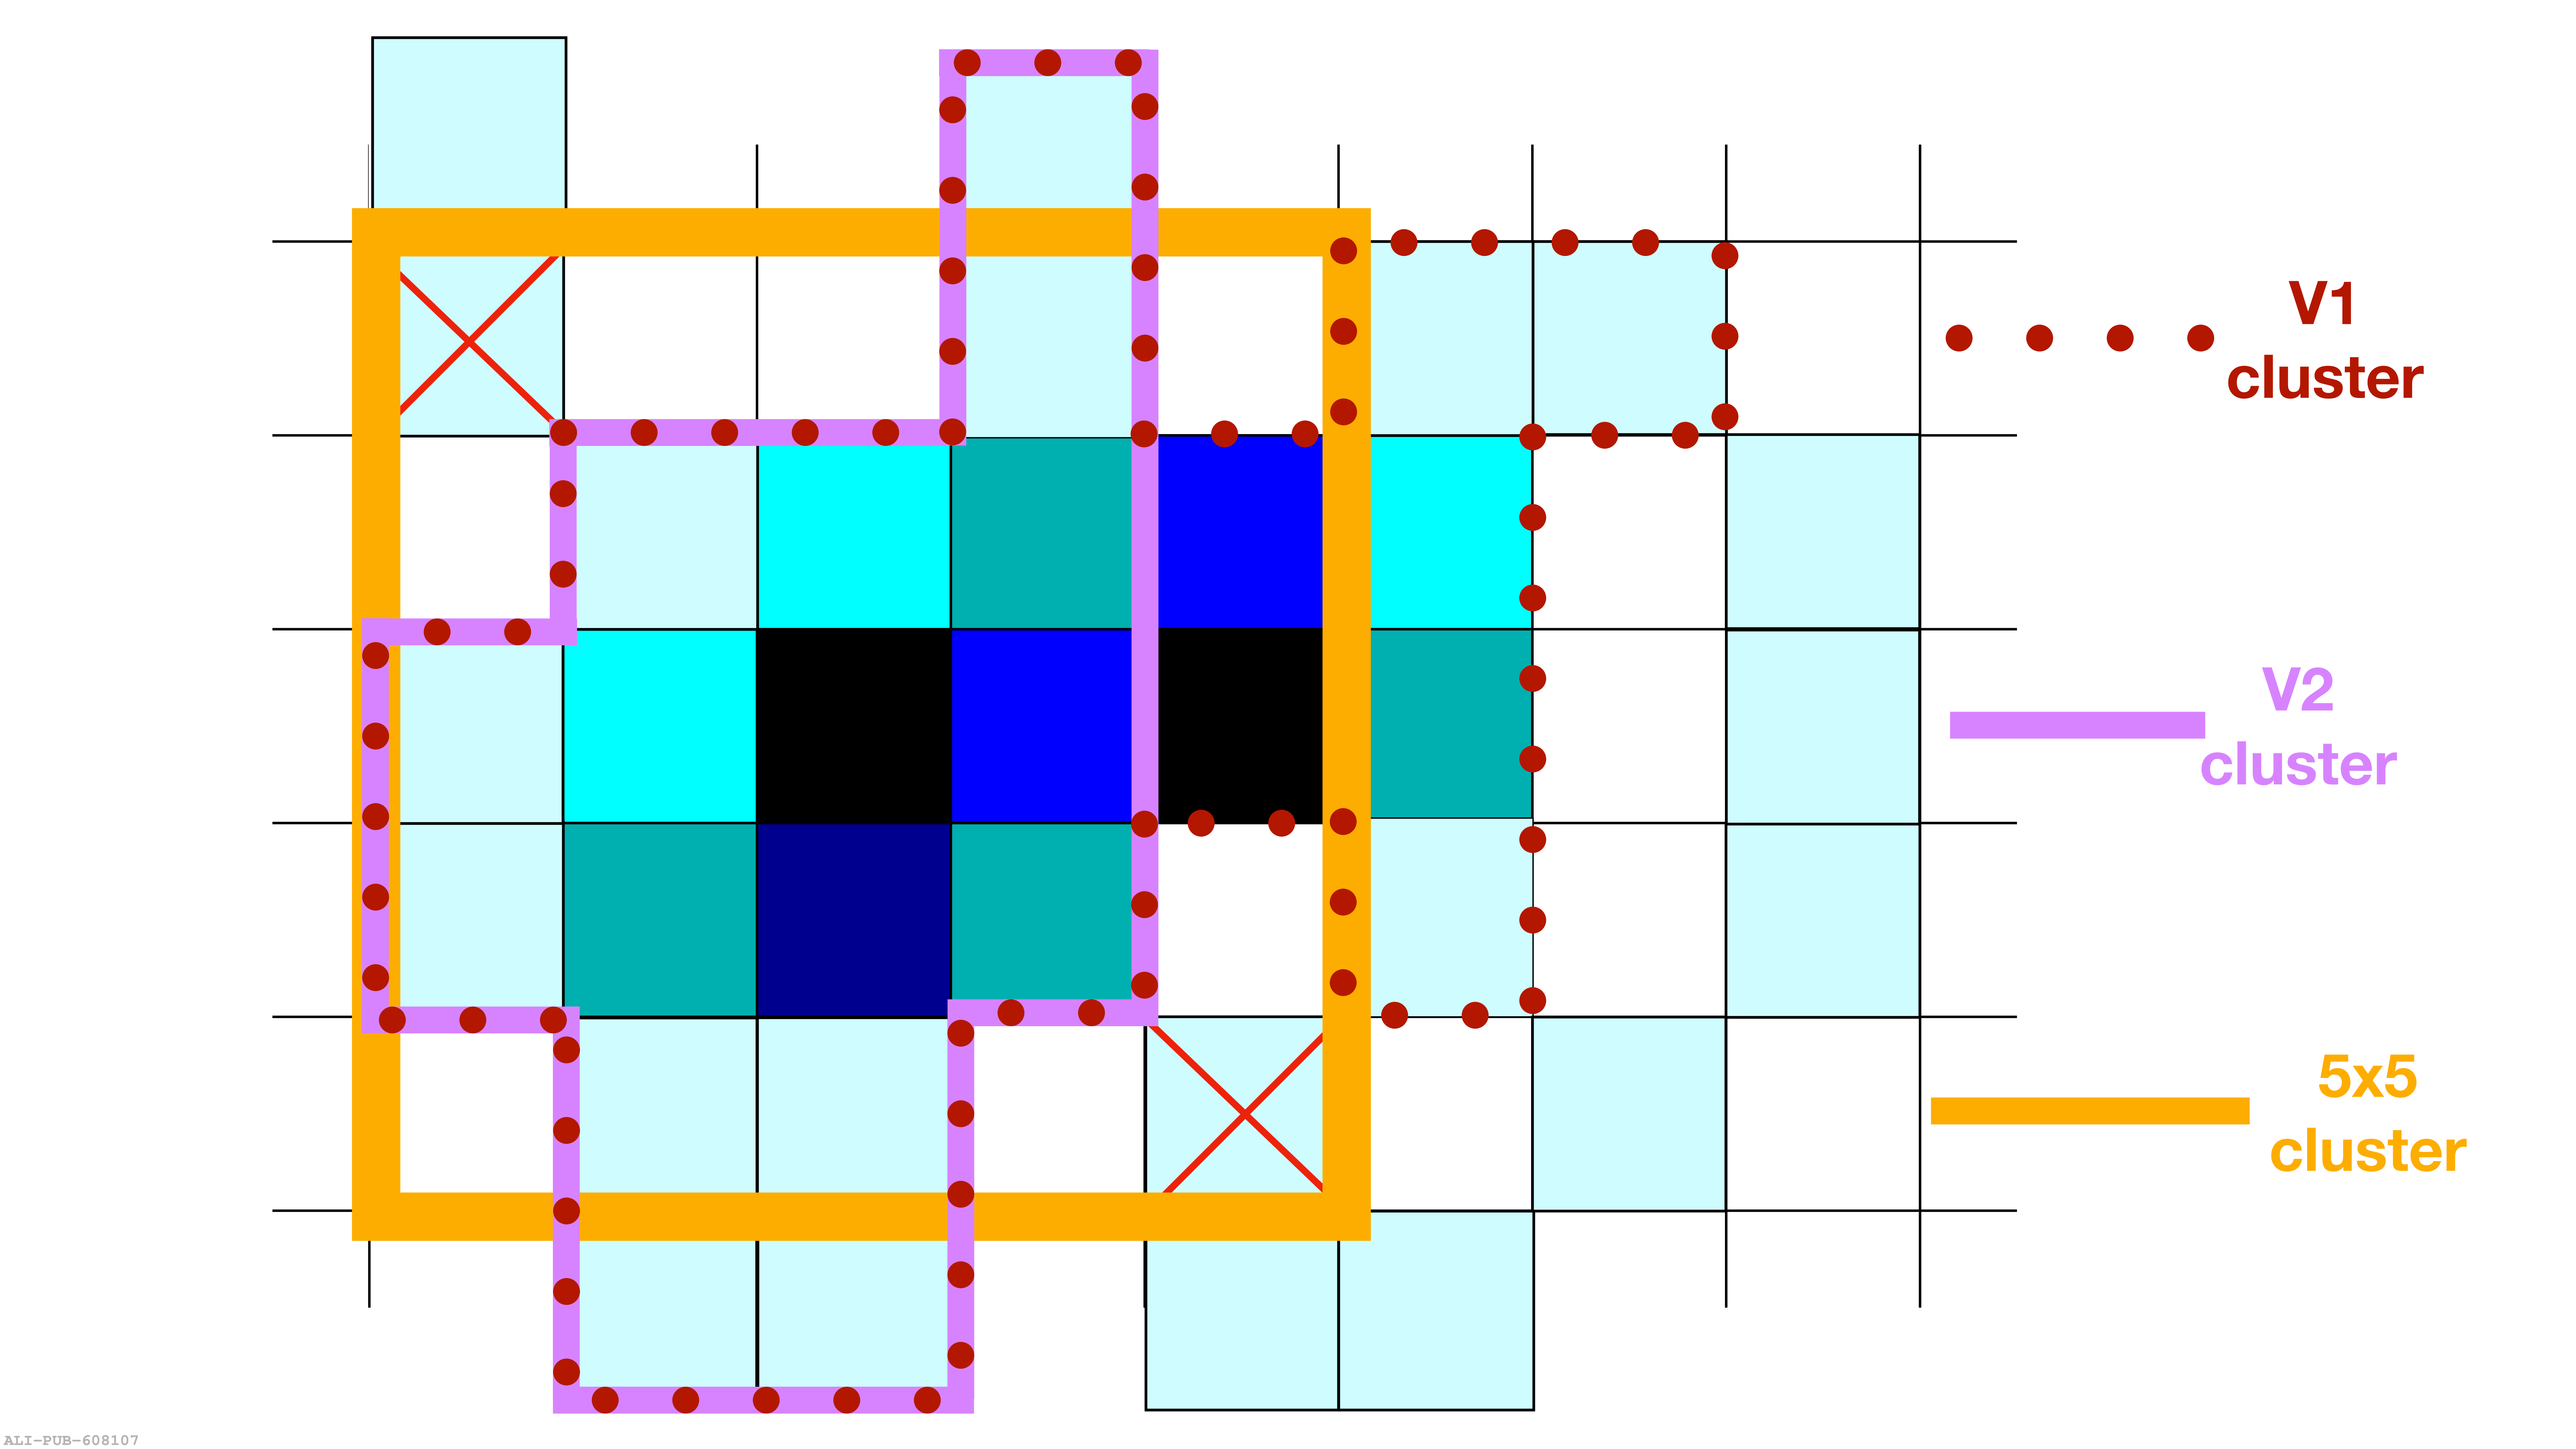 |
Figure P.N.2
\ Inclusive-cluster \sigmalongPb\ distribution (basic cluster selection plus track--cluster association rejection for \PbPb collisions, see Sect. 3.2 of Ref. ) as a function of \pt\ in data for \pp (lower right frame) and \PbPb collisions for five different centrality classes. The dotted line corresponds to the tight value of the upper selection limit for single photon candidate clusters (narrow clusters) at $\sigma_{\rm max}^{2} = 0.3$. The dashed line corresponds to a looser photon upper selection used in \PbPb collisions below 18 \GeVc at $\sigma_{\rm max}^{2}(\pt)=0.6-0.016\times \pt$. The dotted-dashed line corresponds to the narrow cluster's lower limit at $\sigma_{\rm min}^{2} = 0.1$. | 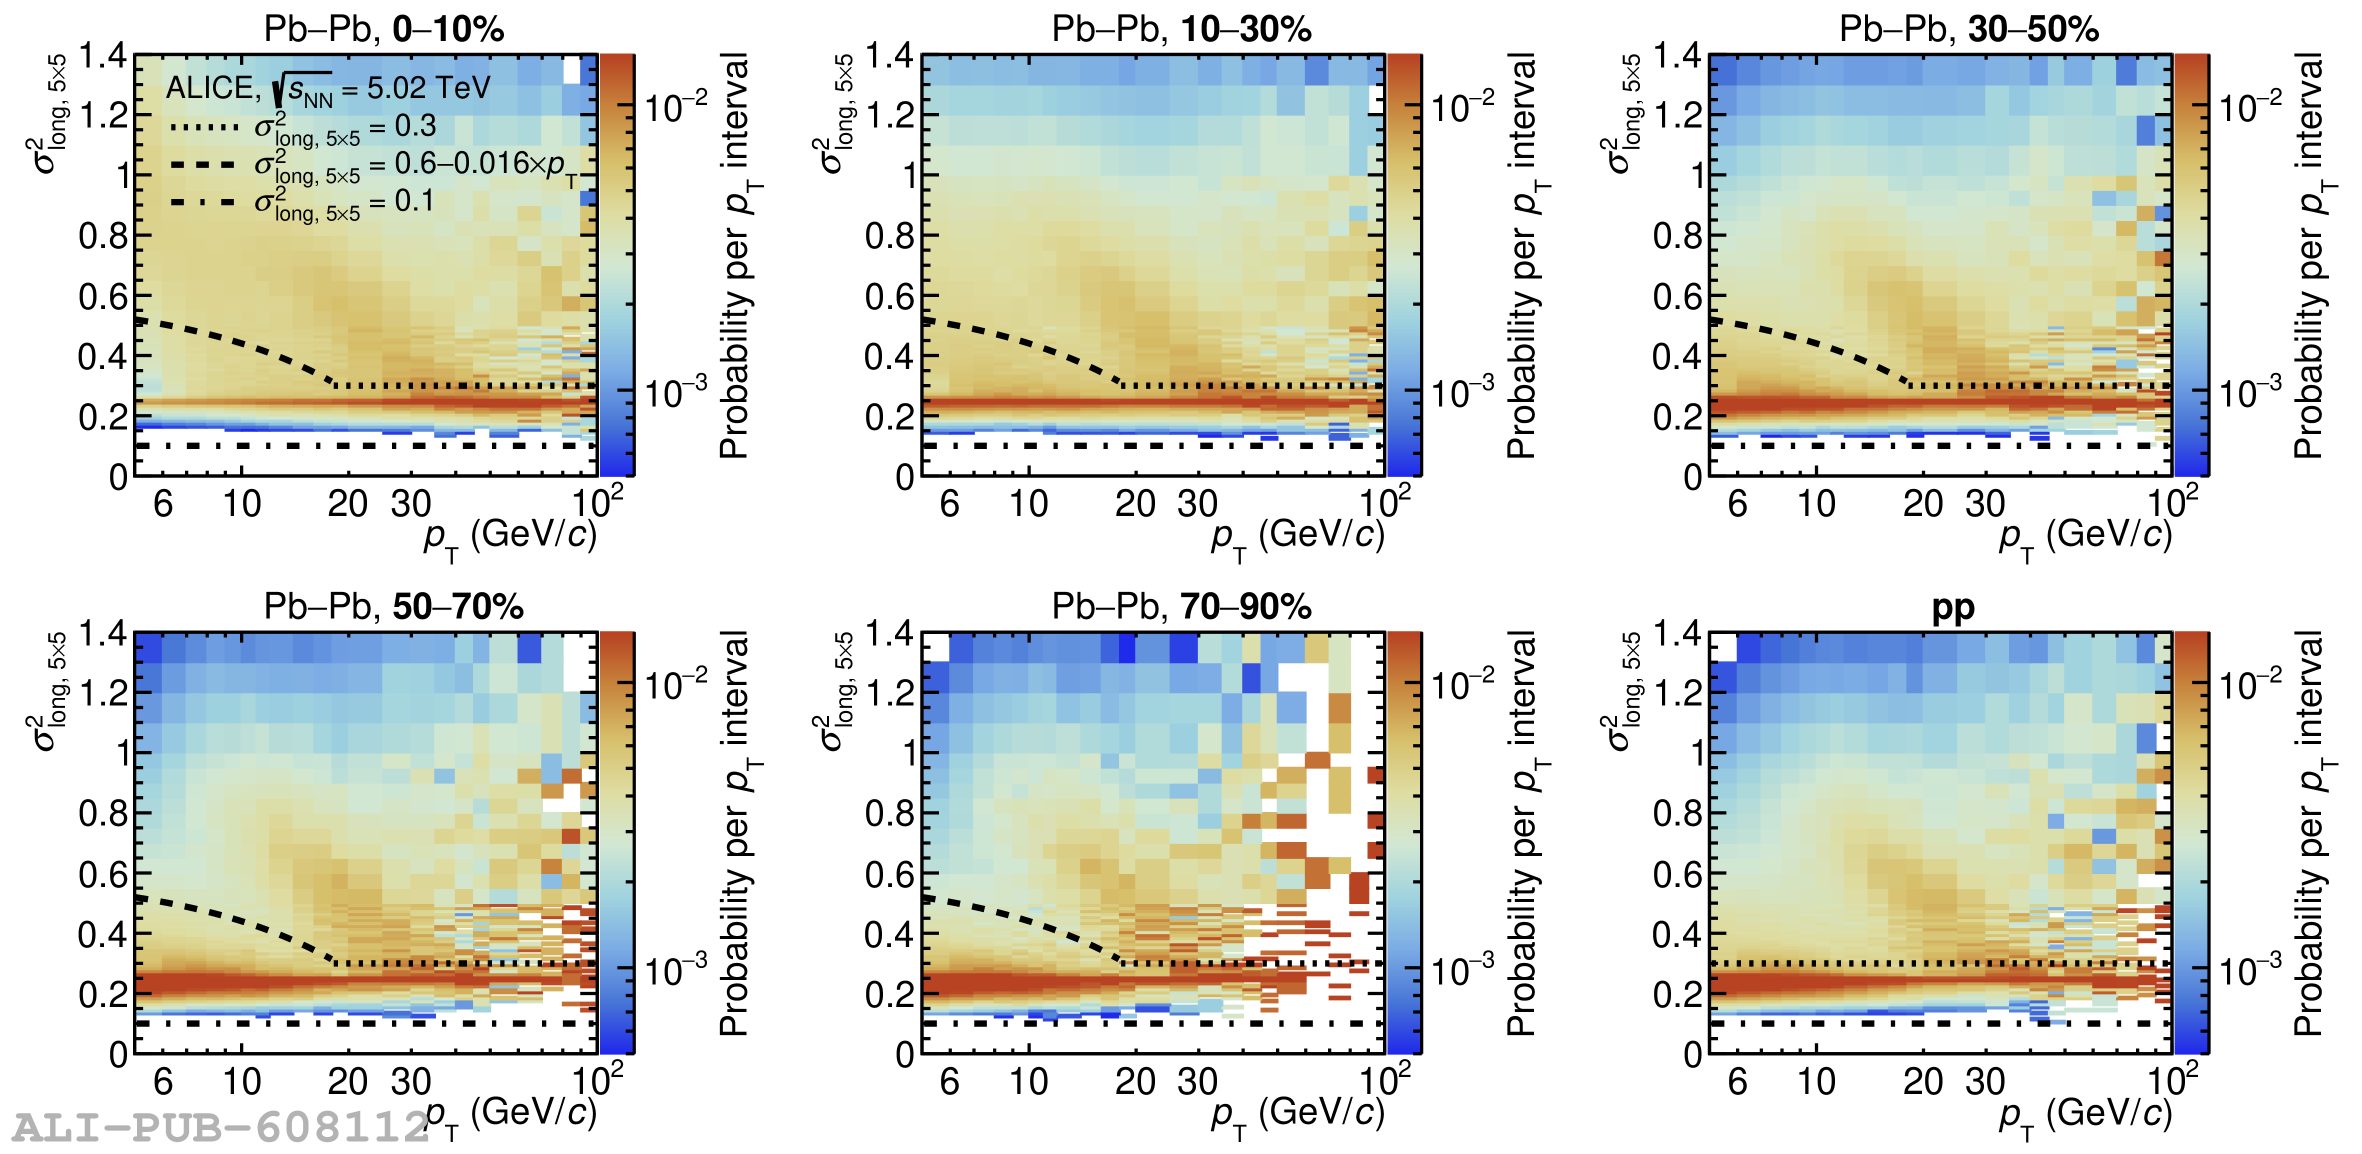 |
Figure P.N.3a
\ Inclusive-cluster \sigmalongPb\ distribution in data (black bullets) and PYTHIA 8 simulation (jet--jet + $\gamma$--jet processes). Three different treatments of cross talk (x-talk) are considered in the simulation: ``no x-talk'' (open red squares); ``x-talk high'' (open magenta squares), stronger cross talk obtained for the previous isolated-photon measurements ; and ``x-talk'' (open blue squares), obtained for this measurement. The four panels display these distributions for two selected cluster \pt\ ranges, $12\pt14$ \GeVc on the left and $40\pt60$ \GeVc on the right, and two collision systems: \pp (top) and \PbPb 0--10\% central (bottom). The simulation is also shown for signal prompt $\gamma$ ($\gamma^{\rm prompt}$) for the different x-talk cases (lines with the same colour code as for the full simulation) The narrow cluster range maximum value $\sigmalongPb = 0.3$ (tight) or 0.392 (loose, corresponding to $\sigma_{\rm max}^{2}$(13 \GeVc)) is shown on all plots as a dotted or dashed vertical line, respectively. | 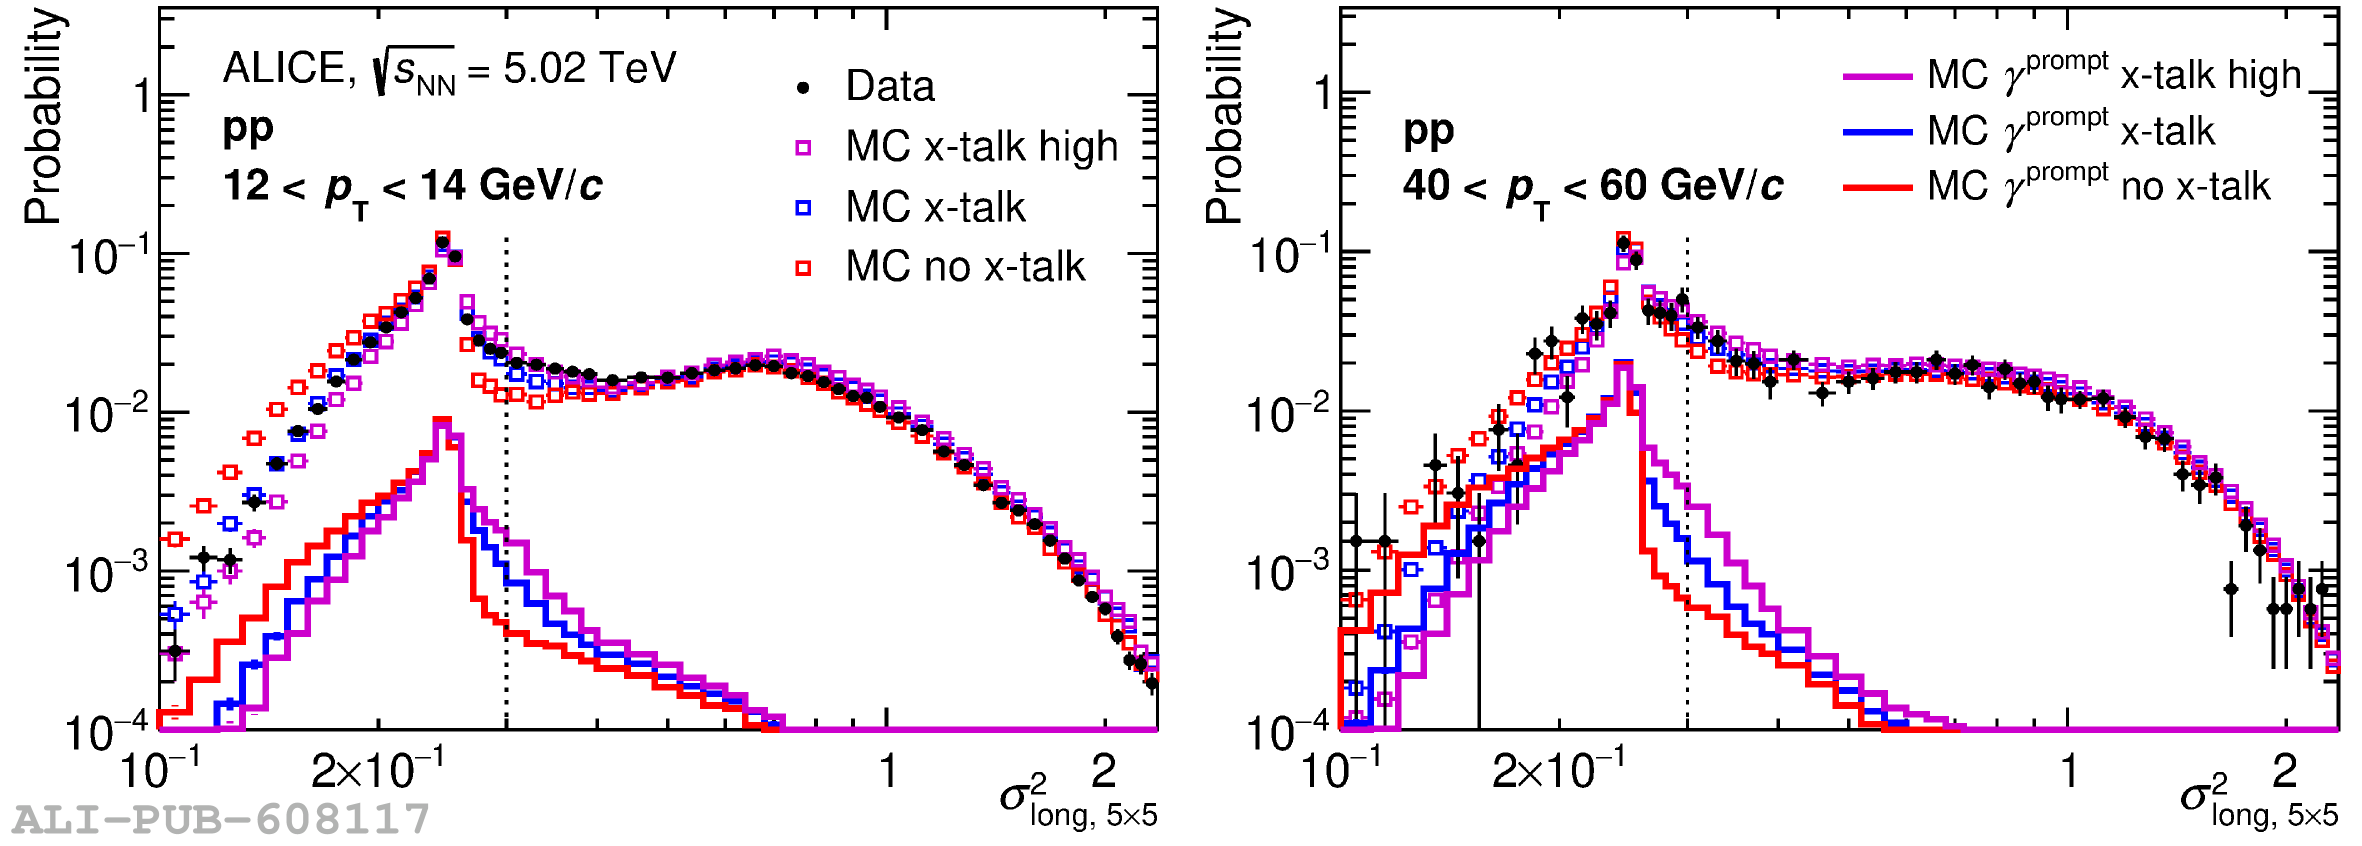 |
Figure P.N.3b
\ Inclusive-cluster \sigmalongPb\ distribution in data (black bullets) and PYTHIA 8 simulation (jet--jet + $\gamma$--jet processes). Three different treatments of cross talk (x-talk) are considered in the simulation: ``no x-talk'' (open red squares); ``x-talk high'' (open magenta squares), stronger cross talk obtained for the previous isolated-photon measurements ; and ``x-talk'' (open blue squares), obtained for this measurement. The four panels display these distributions for two selected cluster \pt\ ranges, $12\pt14$ \GeVc on the left and $40\pt60$ \GeVc on the right, and two collision systems: \pp (top) and \PbPb 0--10\% central (bottom). The simulation is also shown for signal prompt $\gamma$ ($\gamma^{\rm prompt}$) for the different x-talk cases (lines with the same colour code as for the full simulation) The narrow cluster range maximum value $\sigmalongPb = 0.3$ (tight) or 0.392 (loose, corresponding to $\sigma_{\rm max}^{2}$(13 \GeVc)) is shown on all plots as a dotted or dashed vertical line, respectively. | 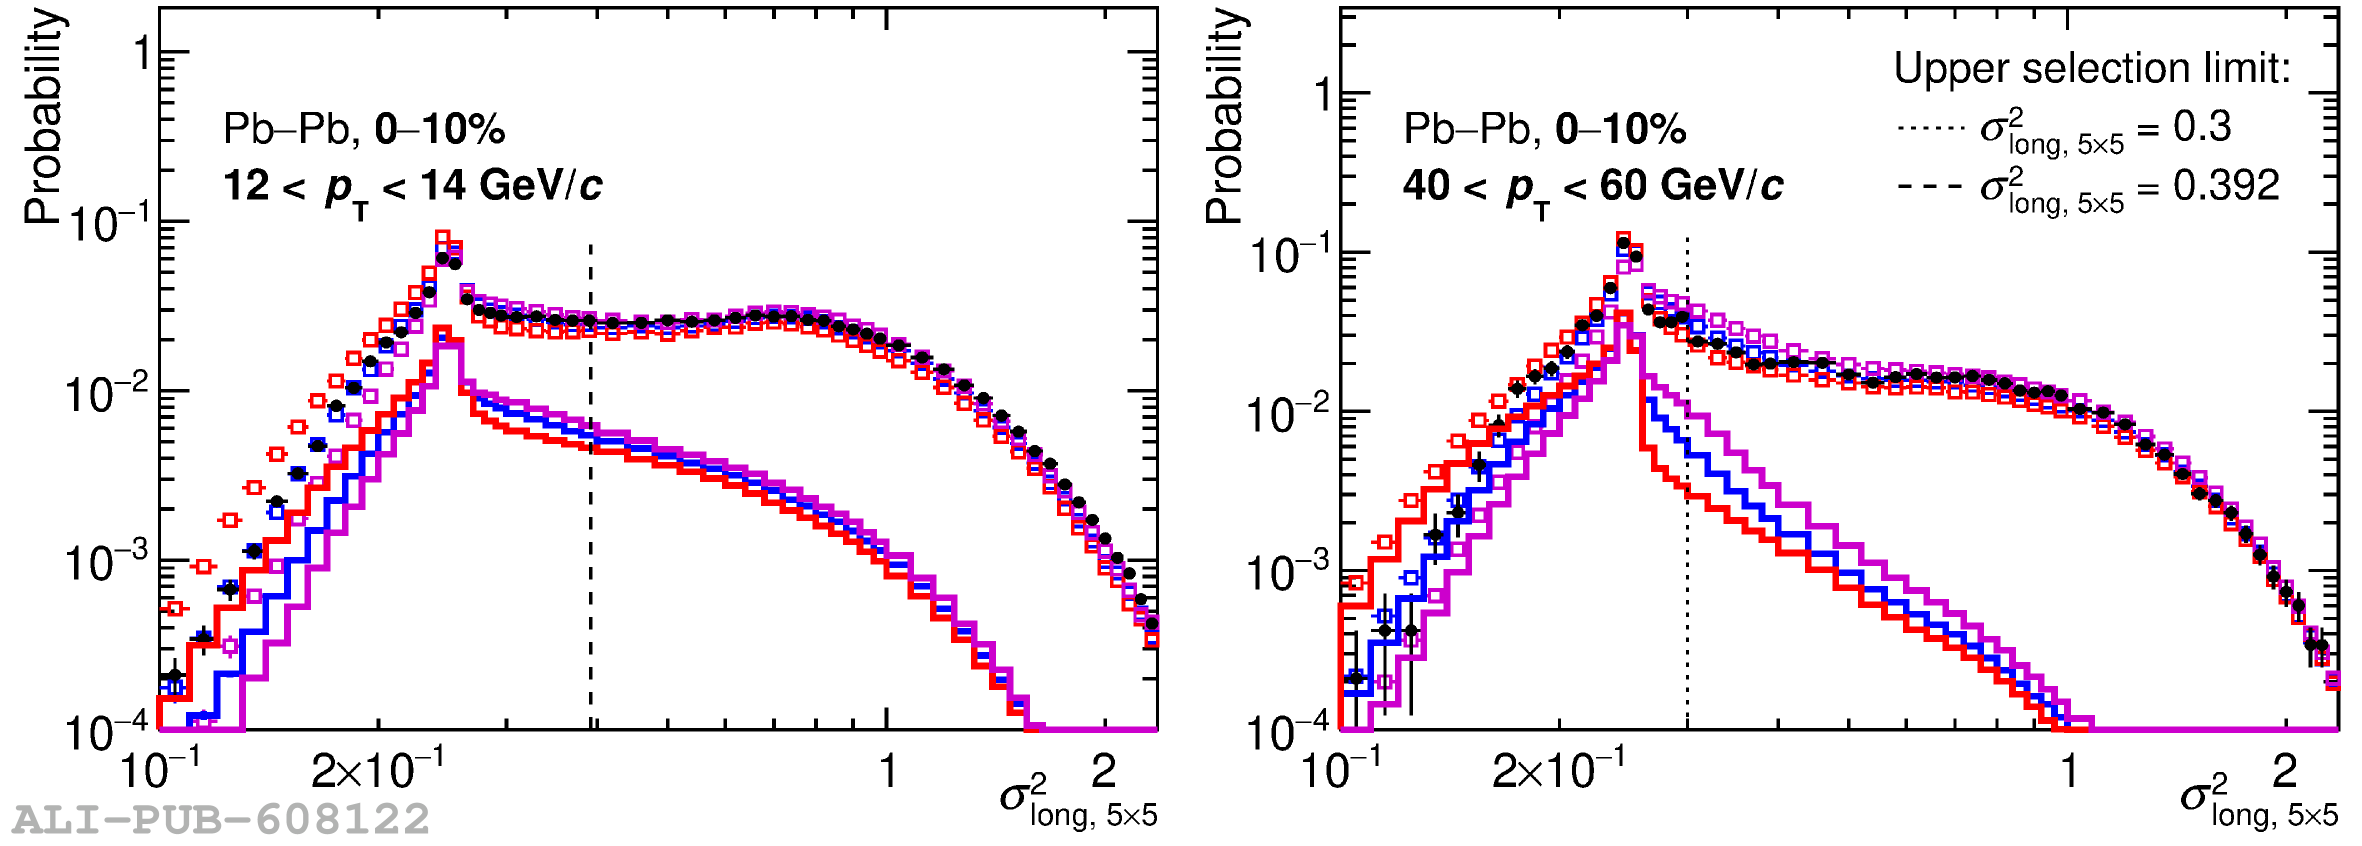 |
Figure P.N.4
\ In $\gamma$--jet PYTHIA 8 simulation embedded into MB \PbPb data, \ptIsoCh\ distribution for different UE estimation areas described in the text, $\pt > 12$ GeV/$c$ and narrow clusters with $0.1\sigmalongPb0.3$ in \PbPb central (left), semi-central (middle) and peripheral (right) collisions for $R=0.2$ (top) and $R=0.4$ (bottom). | 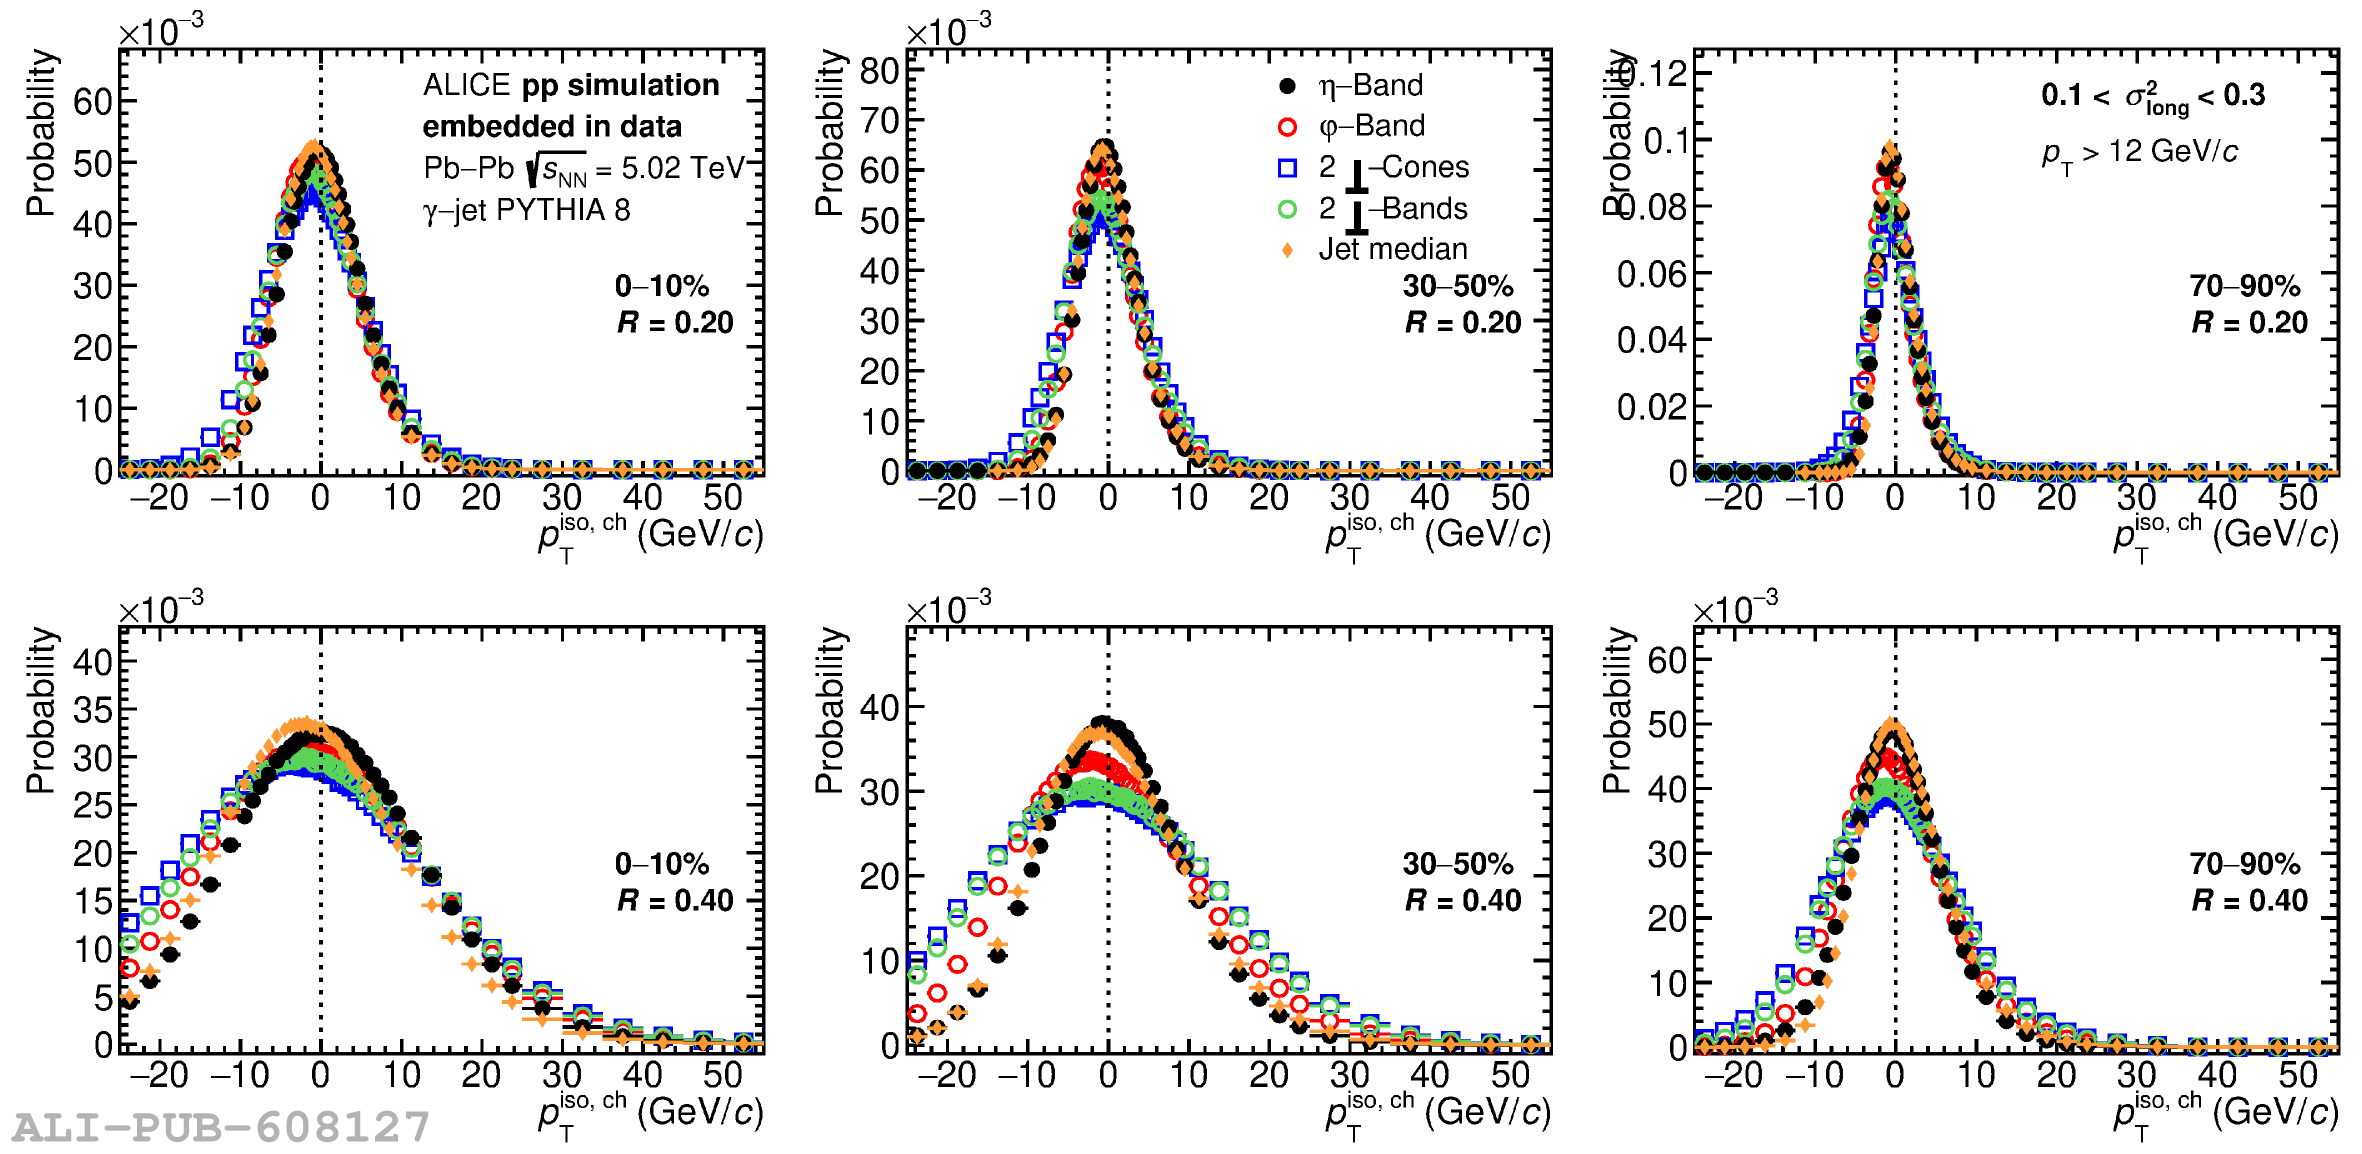 |
Figure P.N.5
\ In jet--jet PYTHIA 8 simulation embedded into MB \PbPb data, \ptIsoCh\ distribution for different UE estimation areas described in the text, $\pt > 12$ GeV/$c$ and wide clusters with $0.4\sigmalongPb2$ in \PbPb central (left), semi-central (middle) and peripheral (right) collisions for $R=0.2$ (top) and $R=0.4$ (bottom). | 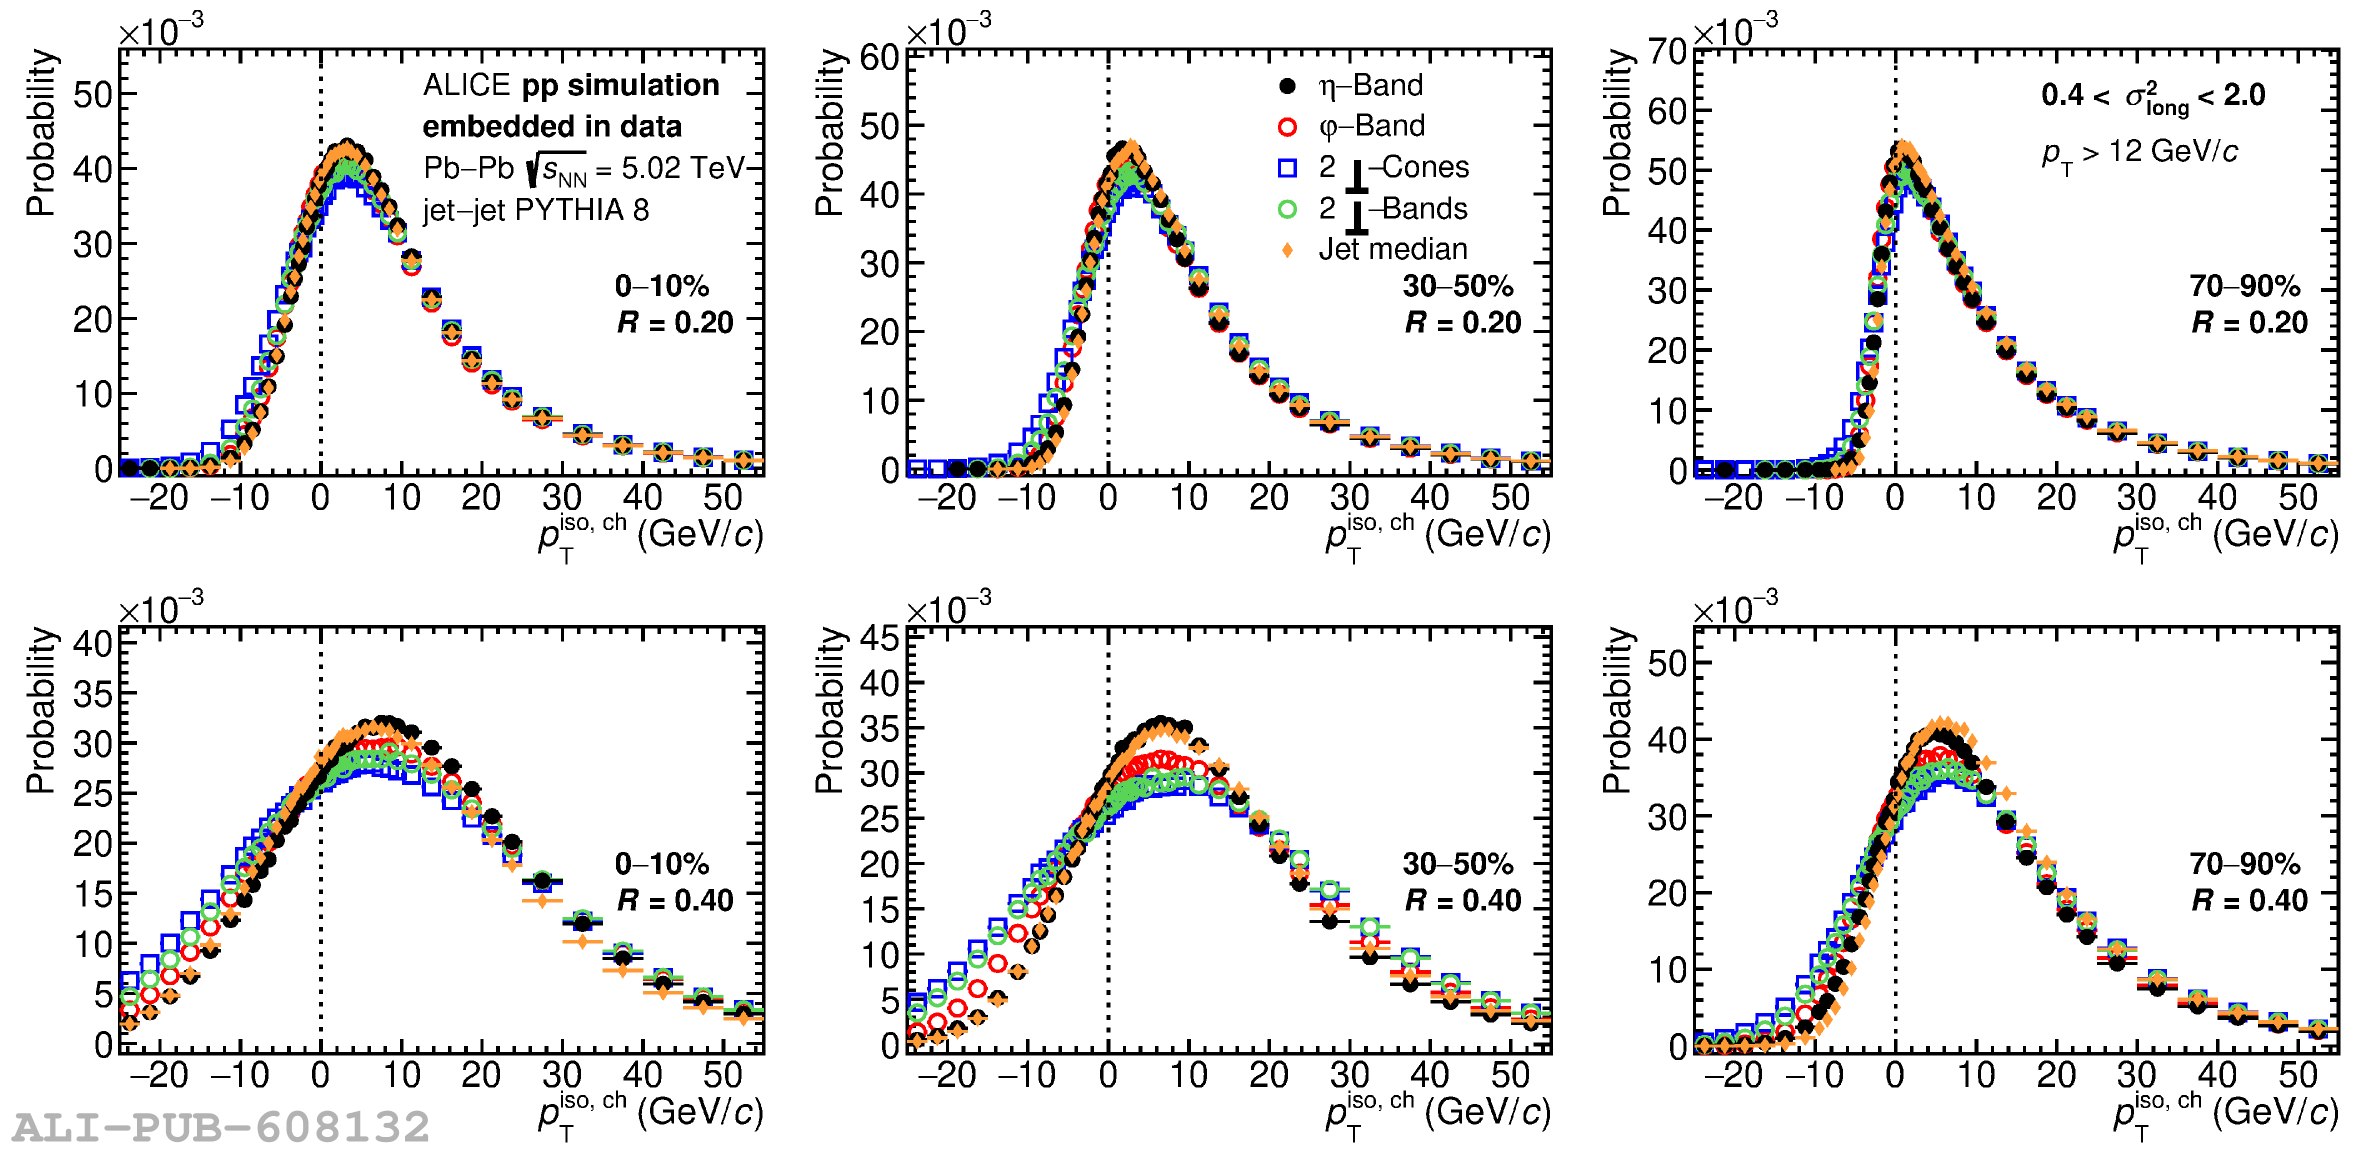 |
Figure P.N.6
\ \ptIsoCh\ distribution for narrow clusters with $0.1\sigmalongPb0.3$ for $\pt > 16$ GeV/$c$,in \pp (lower right frame) and \PbPb collisions in five centrality classes, with $R=0.2$ (black bullets) and $R=0.4$ (blue squares),in data (full markers) and simulated PYTHIA 8 $\gamma$--jet processes (open markers), embedded into data in case of \PbPb collisions. | 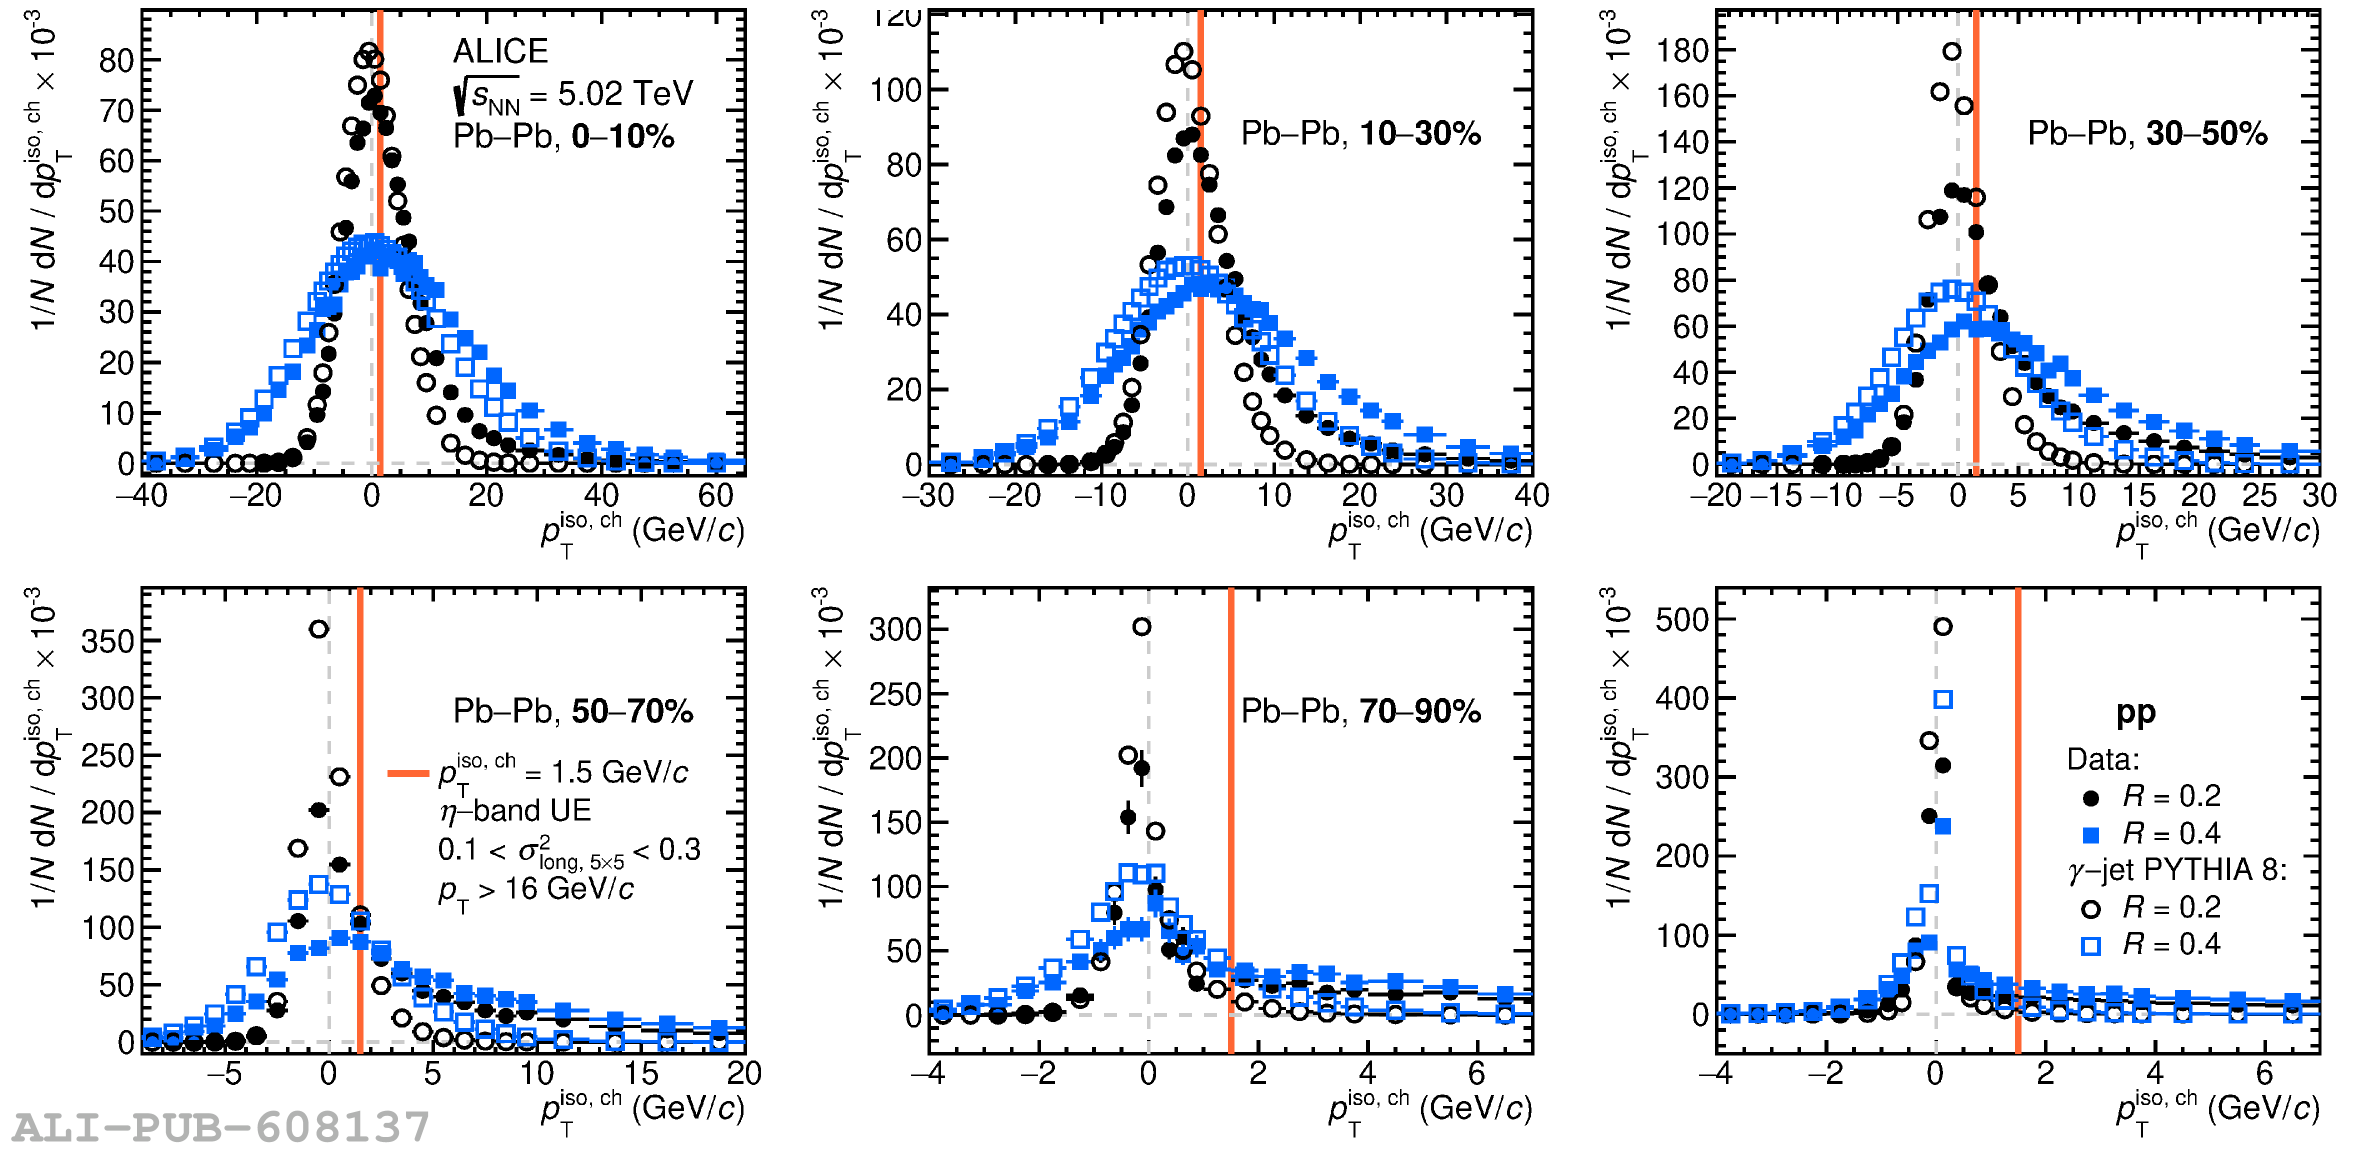 |
Figure P.N.7
\ Contributions from reconstruction, identification, and isolation to the total efficiency calculated using Eq. (7) of Ref. , as a function of the reconstructed photon \ptg for \pp (lower right frame) and \PbPb collisions for five centrality classes. Green markers: reconstruction efficiency $\varepsilon^{\mathrm{rec}}$ Red or brown markers: efficiency additionally due to the photon identification by shower shape selection $\varepsilon^{\mathrm{rec}} \times \varepsilon^{\mathrm{id}}$ or the isolation criterion $\varepsilon^{\mathrm{rec}} \times \varepsilon^{\mathrm{iso}}$ Blue markers: efficiency due to the isolation criterion and shower shape selection $\varepsilon^{\mathrm{rec}} \times \varepsilon^{\mathrm{id}} \times \varepsilon^{\mathrm{iso}}$ Black markers: fraction $\kappa^{\mathrm{iso}}$ of generated photons which are isolated Efficiency obtained from PYTHIA 8 simulations of $\gamma$--jet processes, embedded into \PbPb minimum bias data in the \PbPb case. |  |
Figure P.N.8a
\ Fraction of inclusive clusters with $14\pt16$ \GeVc that pass the isolation selection as a function of the isolation momentum threshold for $R=0.2$ (left) and $R=0.4$ (right), for signal $\gamma$--jet MC narrow clusters ($0.1\sigmalongPb0.3$), and for data and background jet--jet MC (photon trigger with $\pt>3.5$ \GeVc in the calorimeter acceptance) wide clusters ($0.4\sigmalongPb2$). For \PbPb simulations, MC clusters are embedded into minimum bias \PbPb data. From top to bottom, 0--10\% \PbPb collisions, 30--50\% \PbPb collisions, 70--90\% \PbPb collisions and \pp collisions. Lower frame in each panel: ratio of the distribution for wide clusters in data and jet--jet MC over the distributions for $\gamma$--jet MC narrow clusters. Horizontal dashed line set at \ptIsoCh = 1.5 \GeVc. | 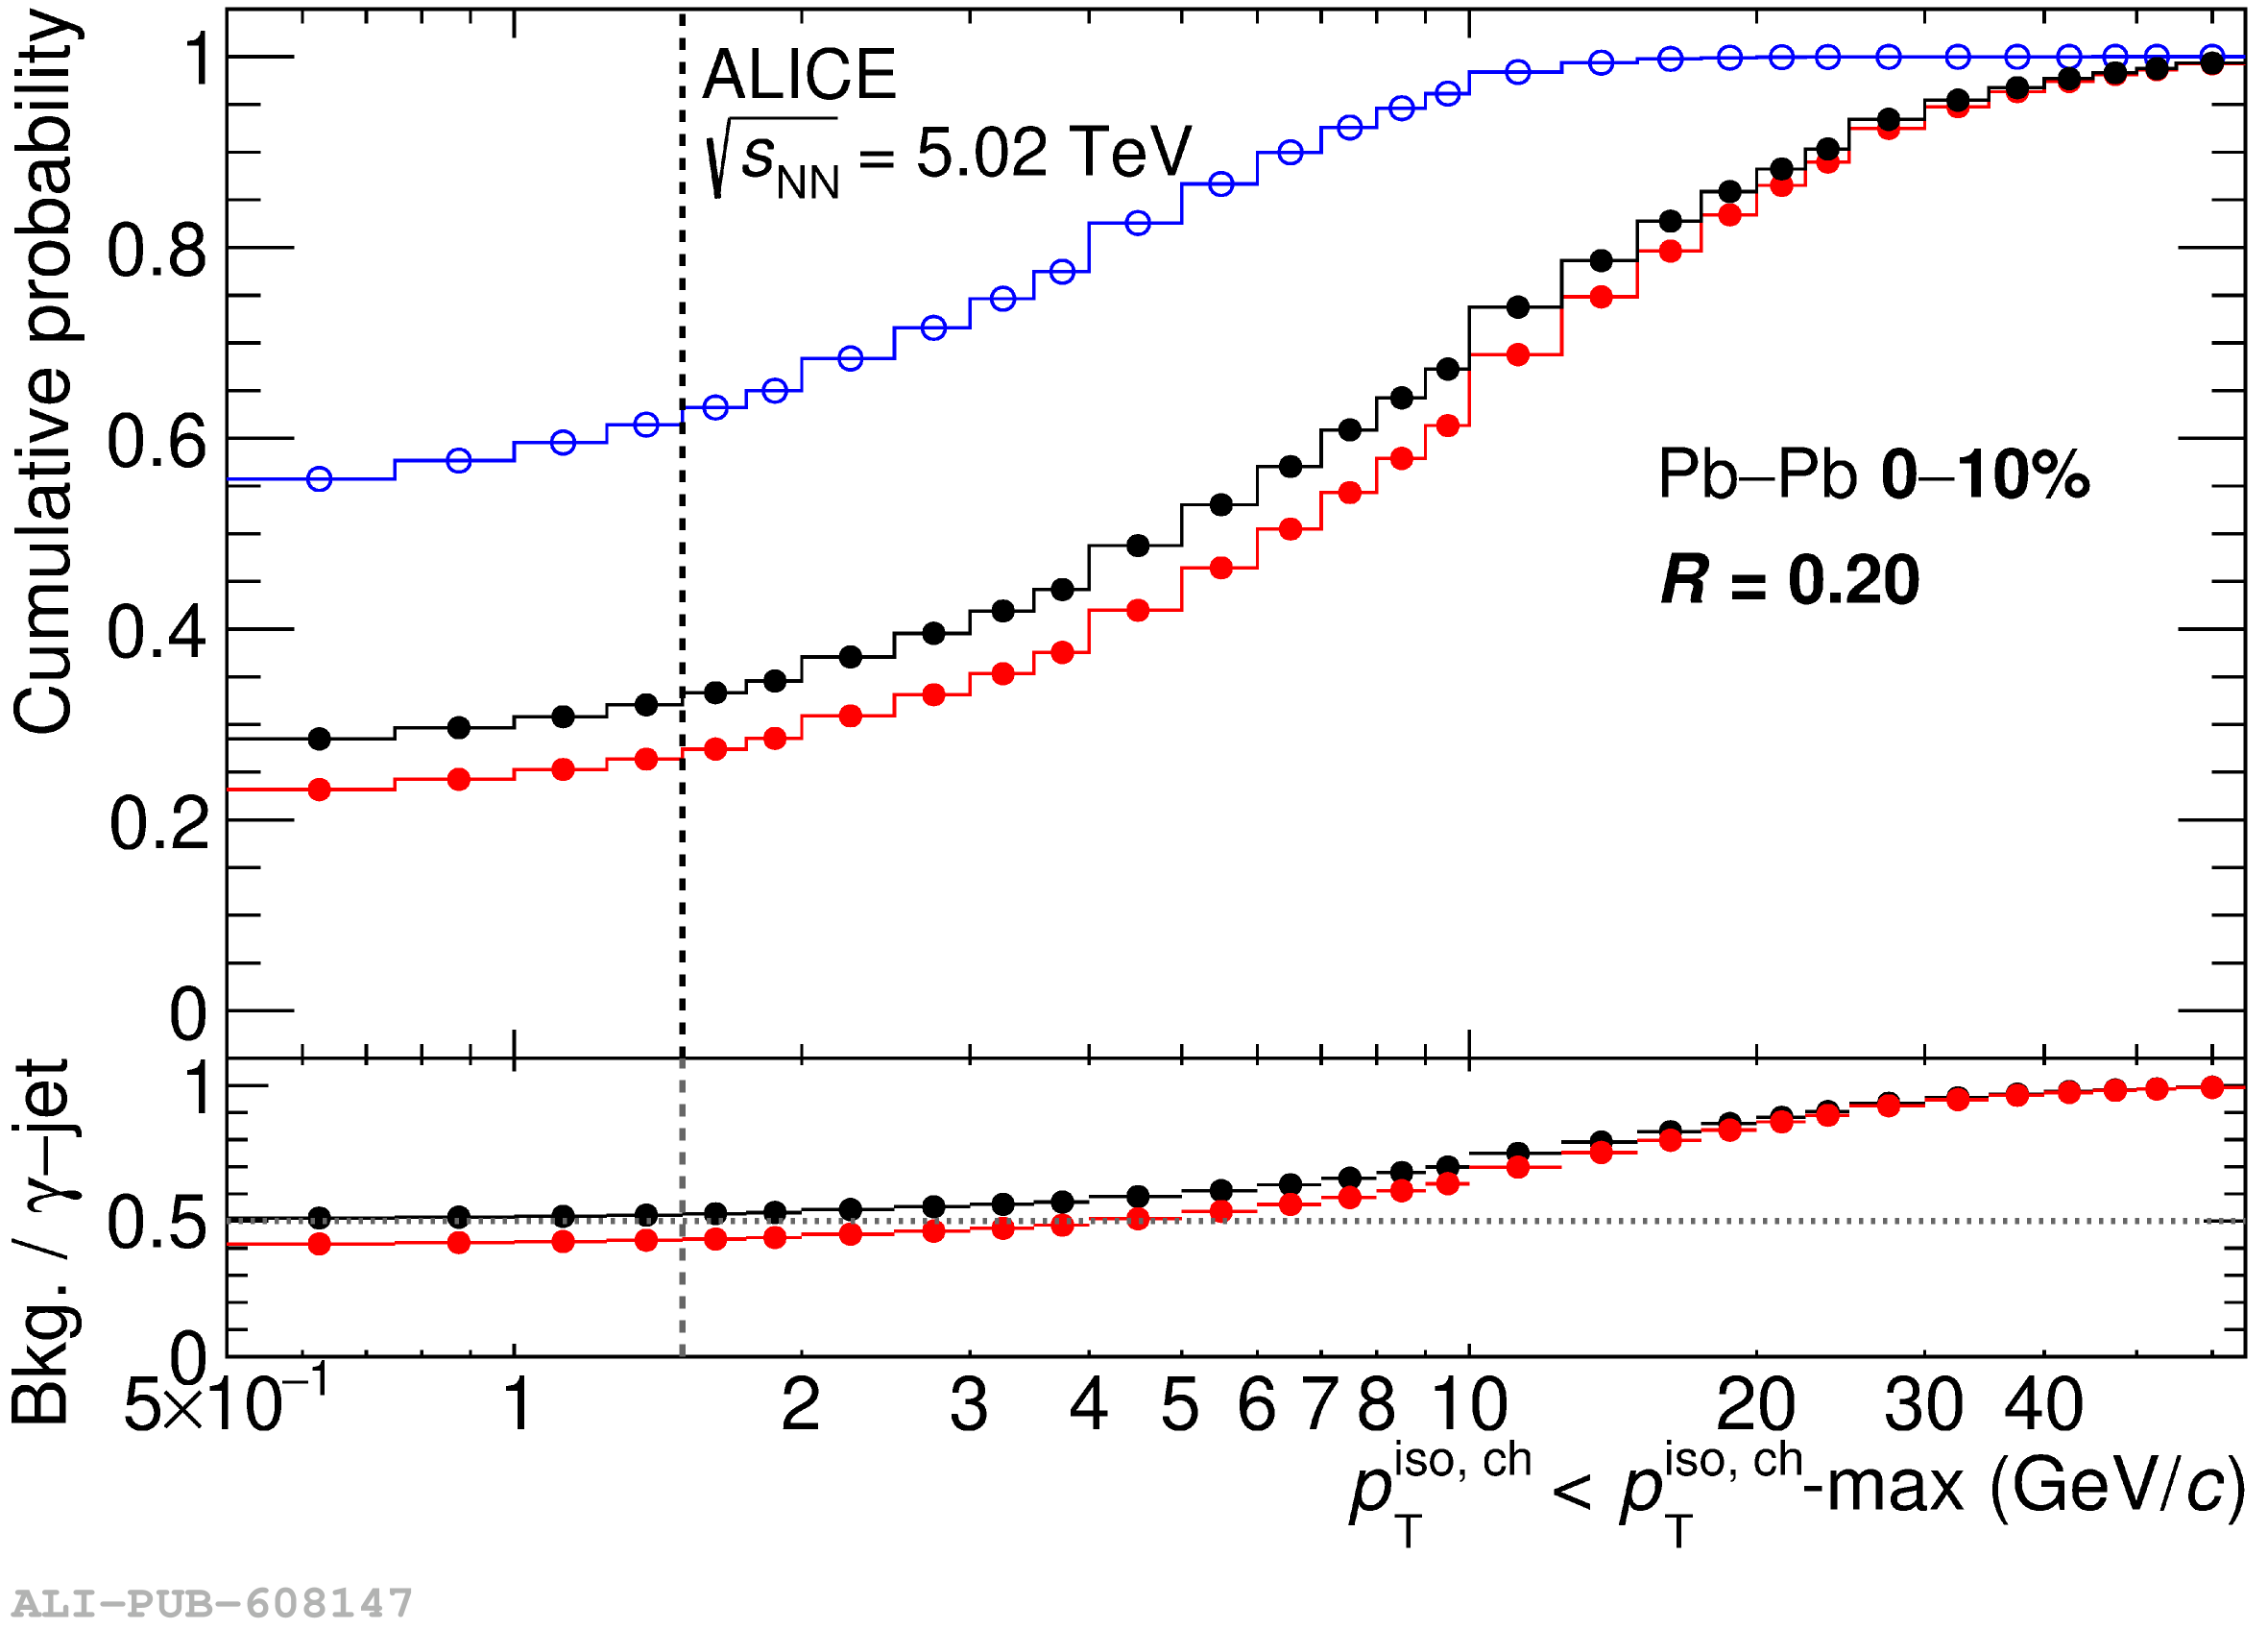 |
Figure P.N.8b
\ Fraction of inclusive clusters with $14\pt16$ \GeVc that pass the isolation selection as a function of the isolation momentum threshold for $R=0.2$ (left) and $R=0.4$ (right), for signal $\gamma$--jet MC narrow clusters ($0.1\sigmalongPb0.3$), and for data and background jet--jet MC (photon trigger with $\pt>3.5$ \GeVc in the calorimeter acceptance) wide clusters ($0.4\sigmalongPb2$). For \PbPb simulations, MC clusters are embedded into minimum bias \PbPb data. From top to bottom, 0--10\% \PbPb collisions, 30--50\% \PbPb collisions, 70--90\% \PbPb collisions and \pp collisions. Lower frame in each panel: ratio of the distribution for wide clusters in data and jet--jet MC over the distributions for $\gamma$--jet MC narrow clusters. Horizontal dashed line set at \ptIsoCh = 1.5 \GeVc. | 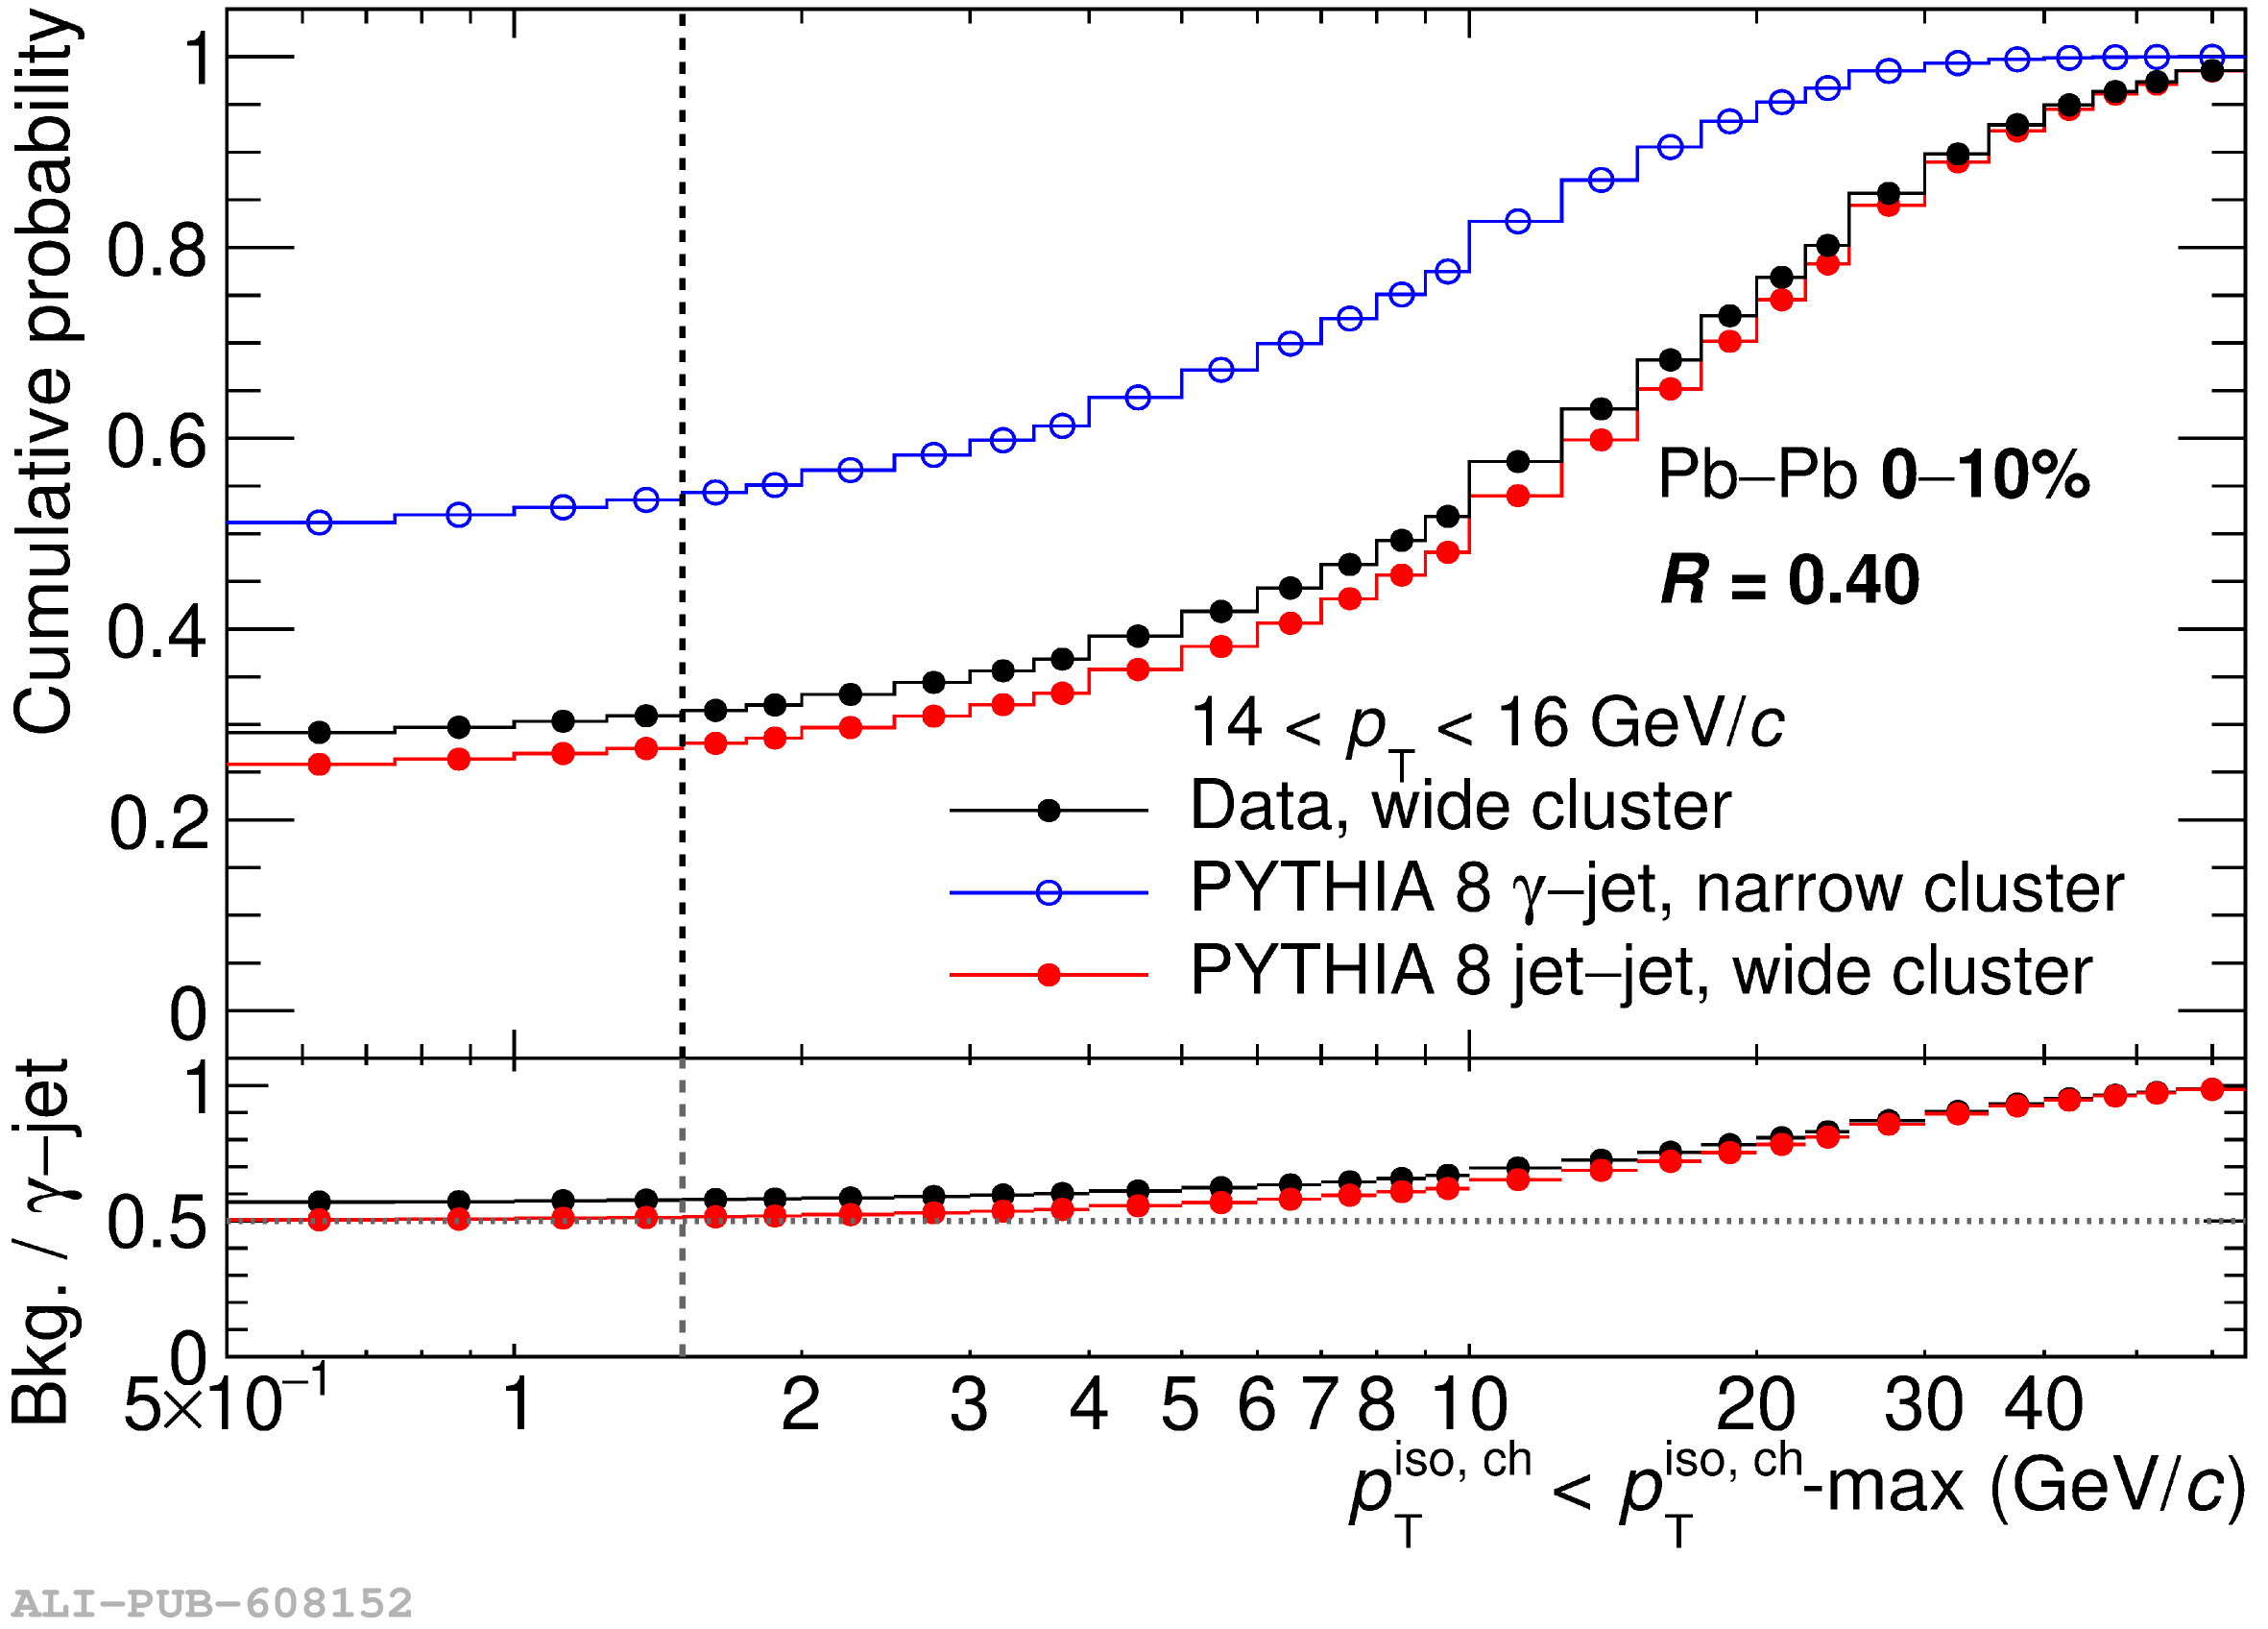 |
Figure P.N.8c
\ Fraction of inclusive clusters with $14\pt16$ \GeVc that pass the isolation selection as a function of the isolation momentum threshold for $R=0.2$ (left) and $R=0.4$ (right), for signal $\gamma$--jet MC narrow clusters ($0.1\sigmalongPb0.3$), and for data and background jet--jet MC (photon trigger with $\pt>3.5$ \GeVc in the calorimeter acceptance) wide clusters ($0.4\sigmalongPb2$). For \PbPb simulations, MC clusters are embedded into minimum bias \PbPb data. From top to bottom, 0--10\% \PbPb collisions, 30--50\% \PbPb collisions, 70--90\% \PbPb collisions and \pp collisions. Lower frame in each panel: ratio of the distribution for wide clusters in data and jet--jet MC over the distributions for $\gamma$--jet MC narrow clusters. Horizontal dashed line set at \ptIsoCh = 1.5 \GeVc. | 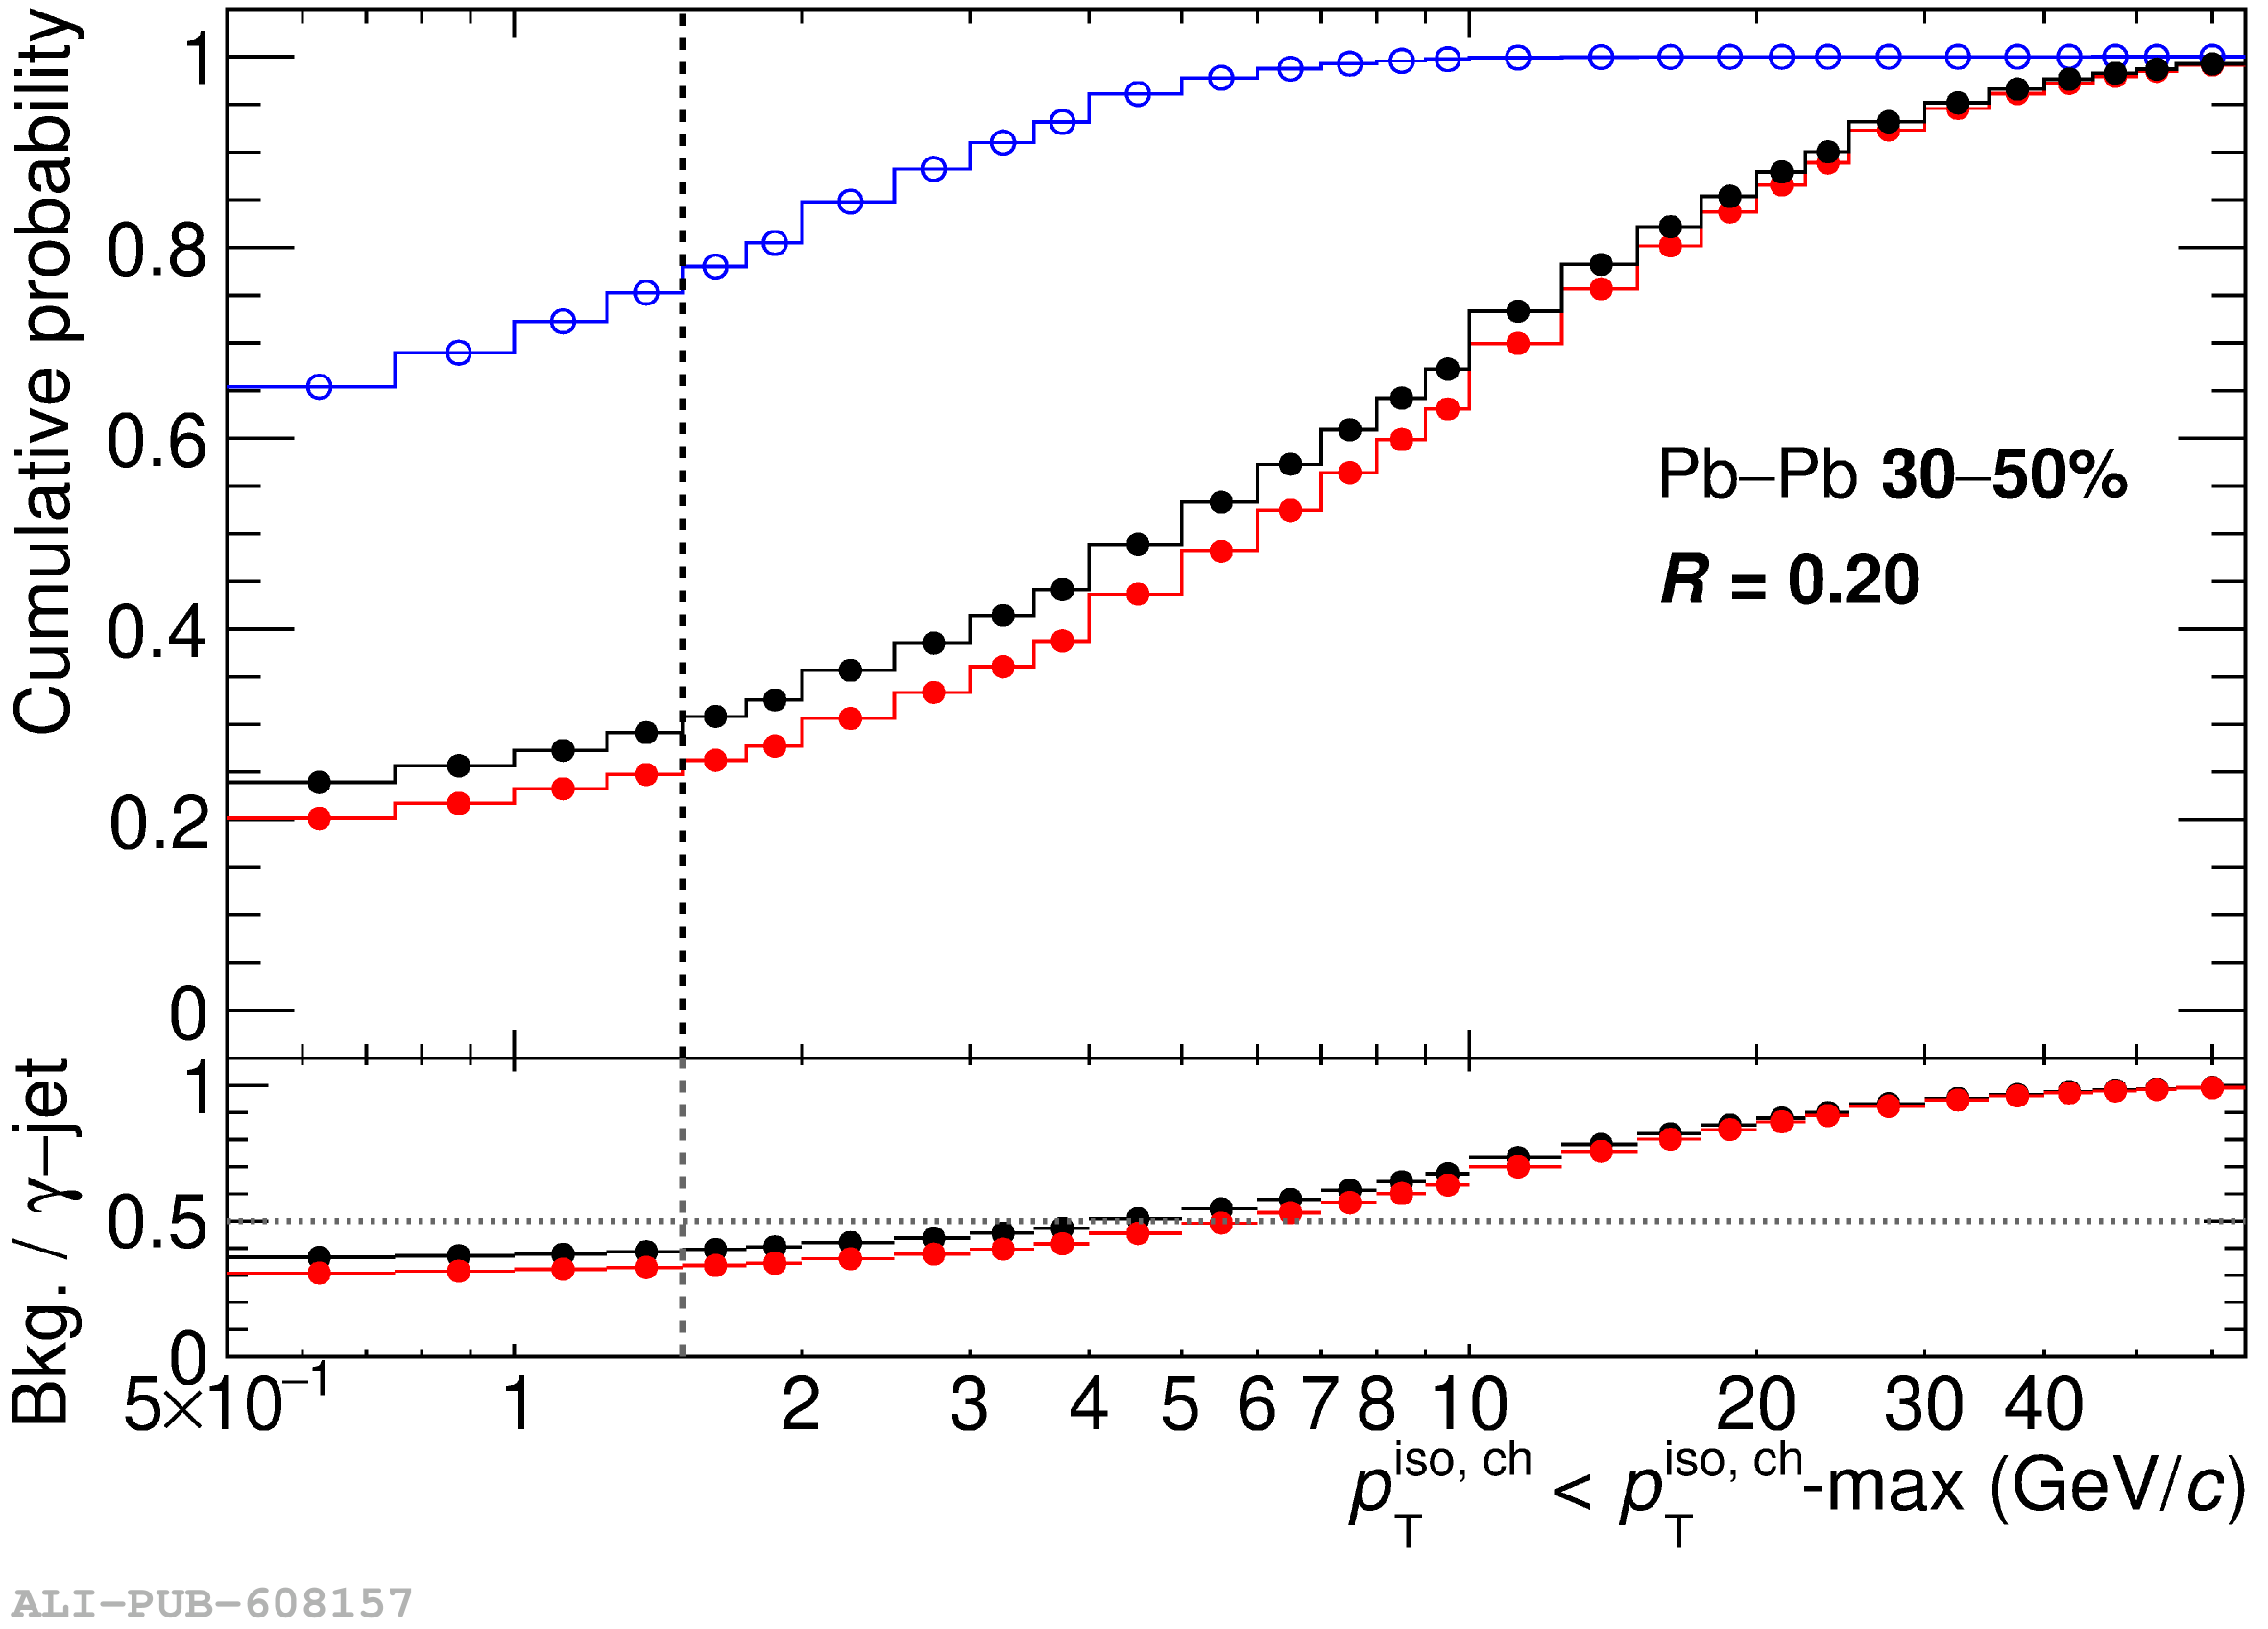 |
Figure P.N.8d
\ Fraction of inclusive clusters with $14\pt16$ \GeVc that pass the isolation selection as a function of the isolation momentum threshold for $R=0.2$ (left) and $R=0.4$ (right), for signal $\gamma$--jet MC narrow clusters ($0.1\sigmalongPb0.3$), and for data and background jet--jet MC (photon trigger with $\pt>3.5$ \GeVc in the calorimeter acceptance) wide clusters ($0.4\sigmalongPb2$). For \PbPb simulations, MC clusters are embedded into minimum bias \PbPb data. From top to bottom, 0--10\% \PbPb collisions, 30--50\% \PbPb collisions, 70--90\% \PbPb collisions and \pp collisions. Lower frame in each panel: ratio of the distribution for wide clusters in data and jet--jet MC over the distributions for $\gamma$--jet MC narrow clusters. Horizontal dashed line set at \ptIsoCh = 1.5 \GeVc. | 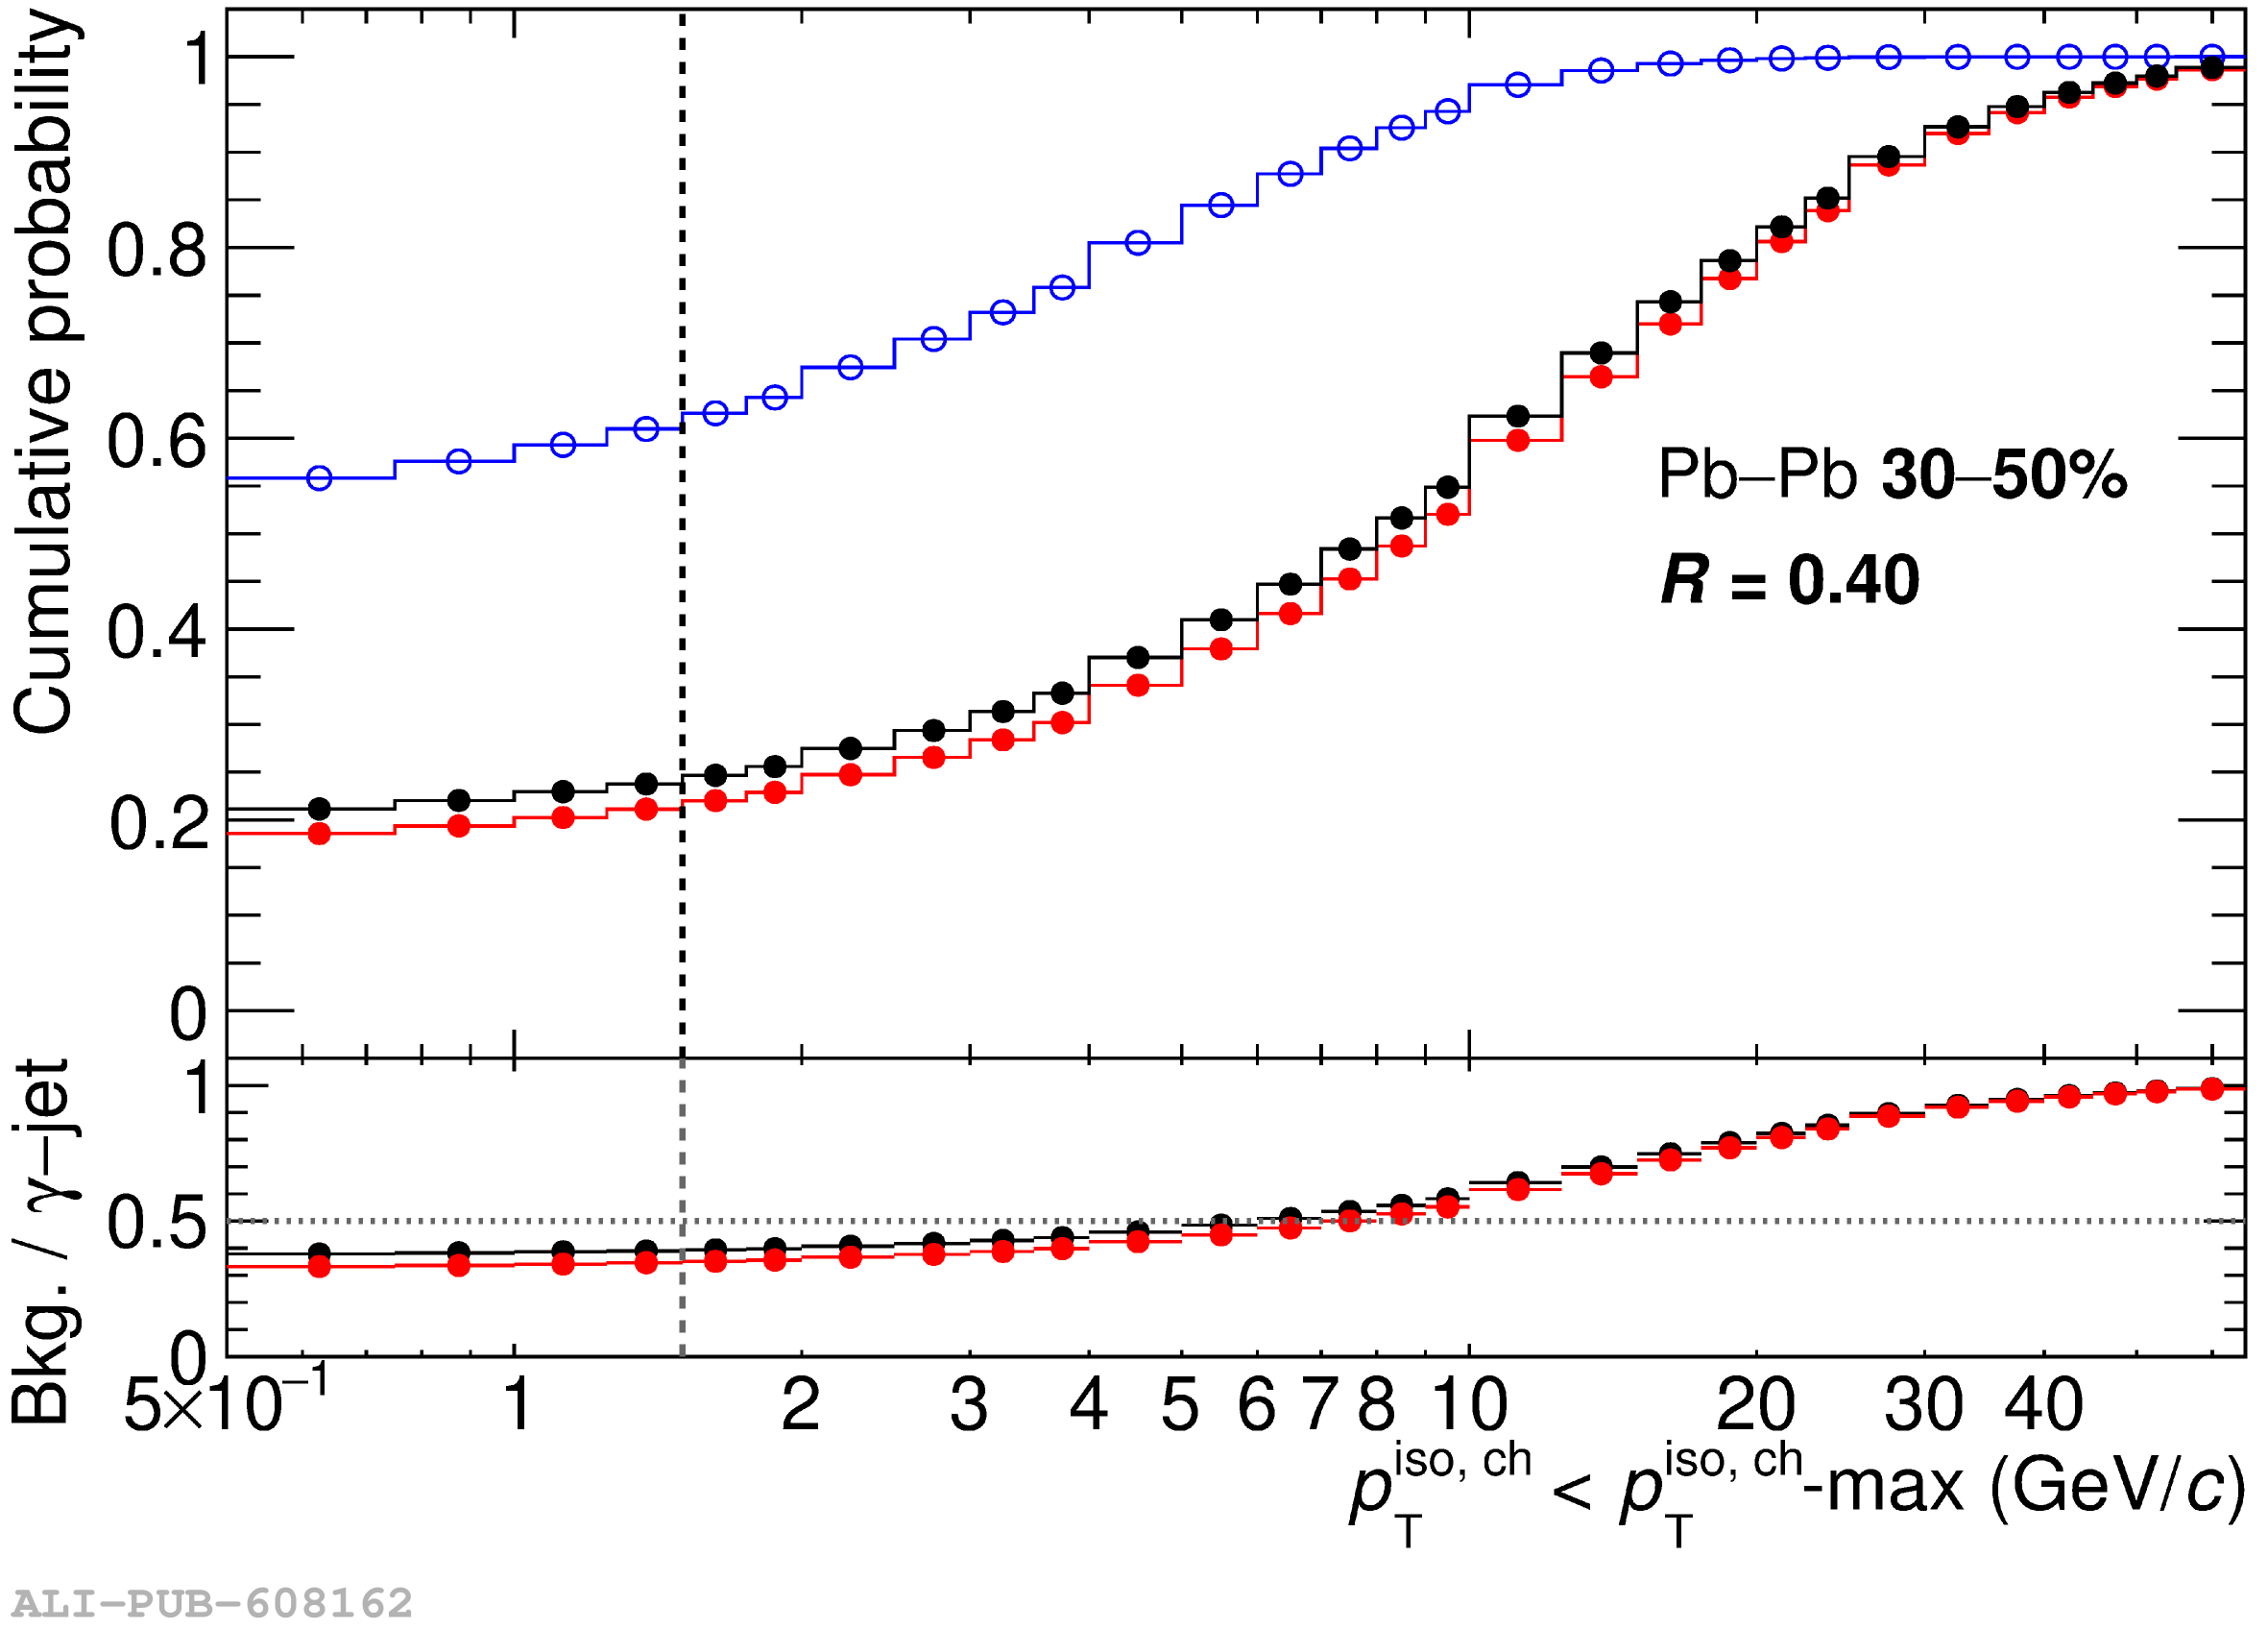 |
Figure P.N.8e
\ Fraction of inclusive clusters with $14\pt16$ \GeVc that pass the isolation selection as a function of the isolation momentum threshold for $R=0.2$ (left) and $R=0.4$ (right), for signal $\gamma$--jet MC narrow clusters ($0.1\sigmalongPb0.3$), and for data and background jet--jet MC (photon trigger with $\pt>3.5$ \GeVc in the calorimeter acceptance) wide clusters ($0.4\sigmalongPb2$). For \PbPb simulations, MC clusters are embedded into minimum bias \PbPb data. From top to bottom, 0--10\% \PbPb collisions, 30--50\% \PbPb collisions, 70--90\% \PbPb collisions and \pp collisions. Lower frame in each panel: ratio of the distribution for wide clusters in data and jet--jet MC over the distributions for $\gamma$--jet MC narrow clusters. Horizontal dashed line set at \ptIsoCh = 1.5 \GeVc. | 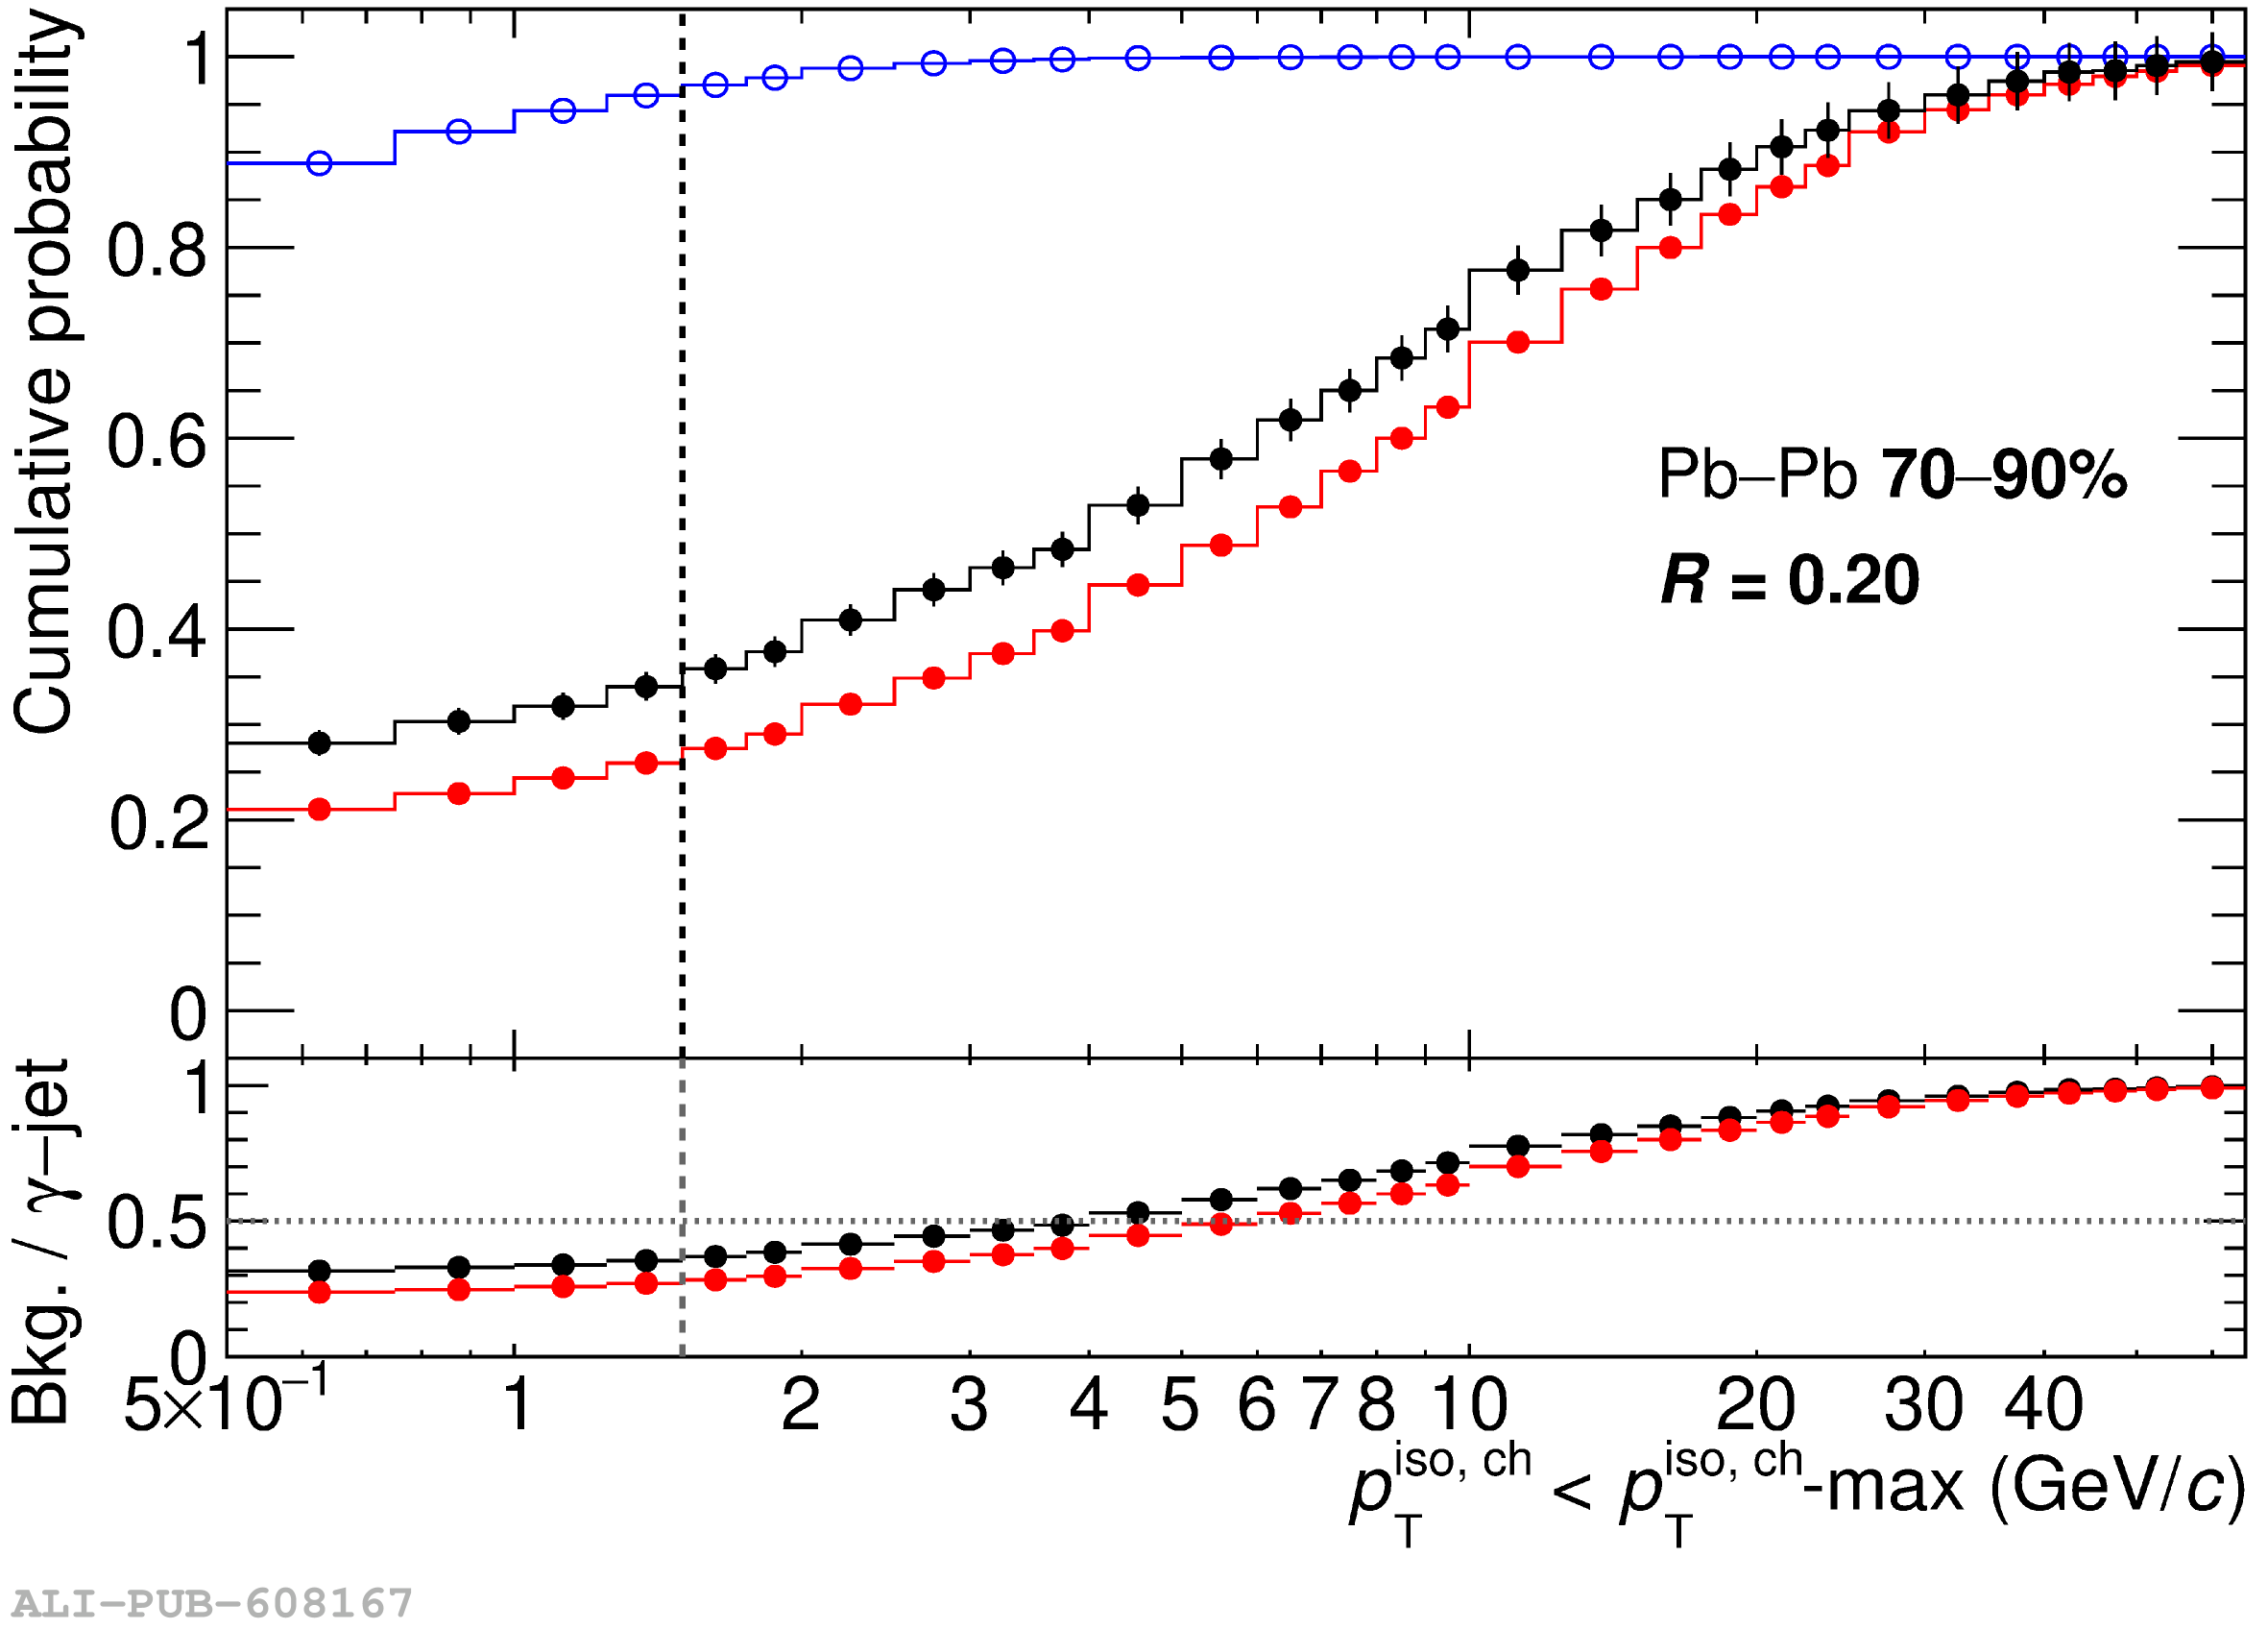 |
Figure P.N.8f
\ Fraction of inclusive clusters with $14\pt16$ \GeVc that pass the isolation selection as a function of the isolation momentum threshold for $R=0.2$ (left) and $R=0.4$ (right), for signal $\gamma$--jet MC narrow clusters ($0.1\sigmalongPb0.3$), and for data and background jet--jet MC (photon trigger with $\pt>3.5$ \GeVc in the calorimeter acceptance) wide clusters ($0.4\sigmalongPb2$). For \PbPb simulations, MC clusters are embedded into minimum bias \PbPb data. From top to bottom, 0--10\% \PbPb collisions, 30--50\% \PbPb collisions, 70--90\% \PbPb collisions and \pp collisions. Lower frame in each panel: ratio of the distribution for wide clusters in data and jet--jet MC over the distributions for $\gamma$--jet MC narrow clusters. Horizontal dashed line set at \ptIsoCh = 1.5 \GeVc. | 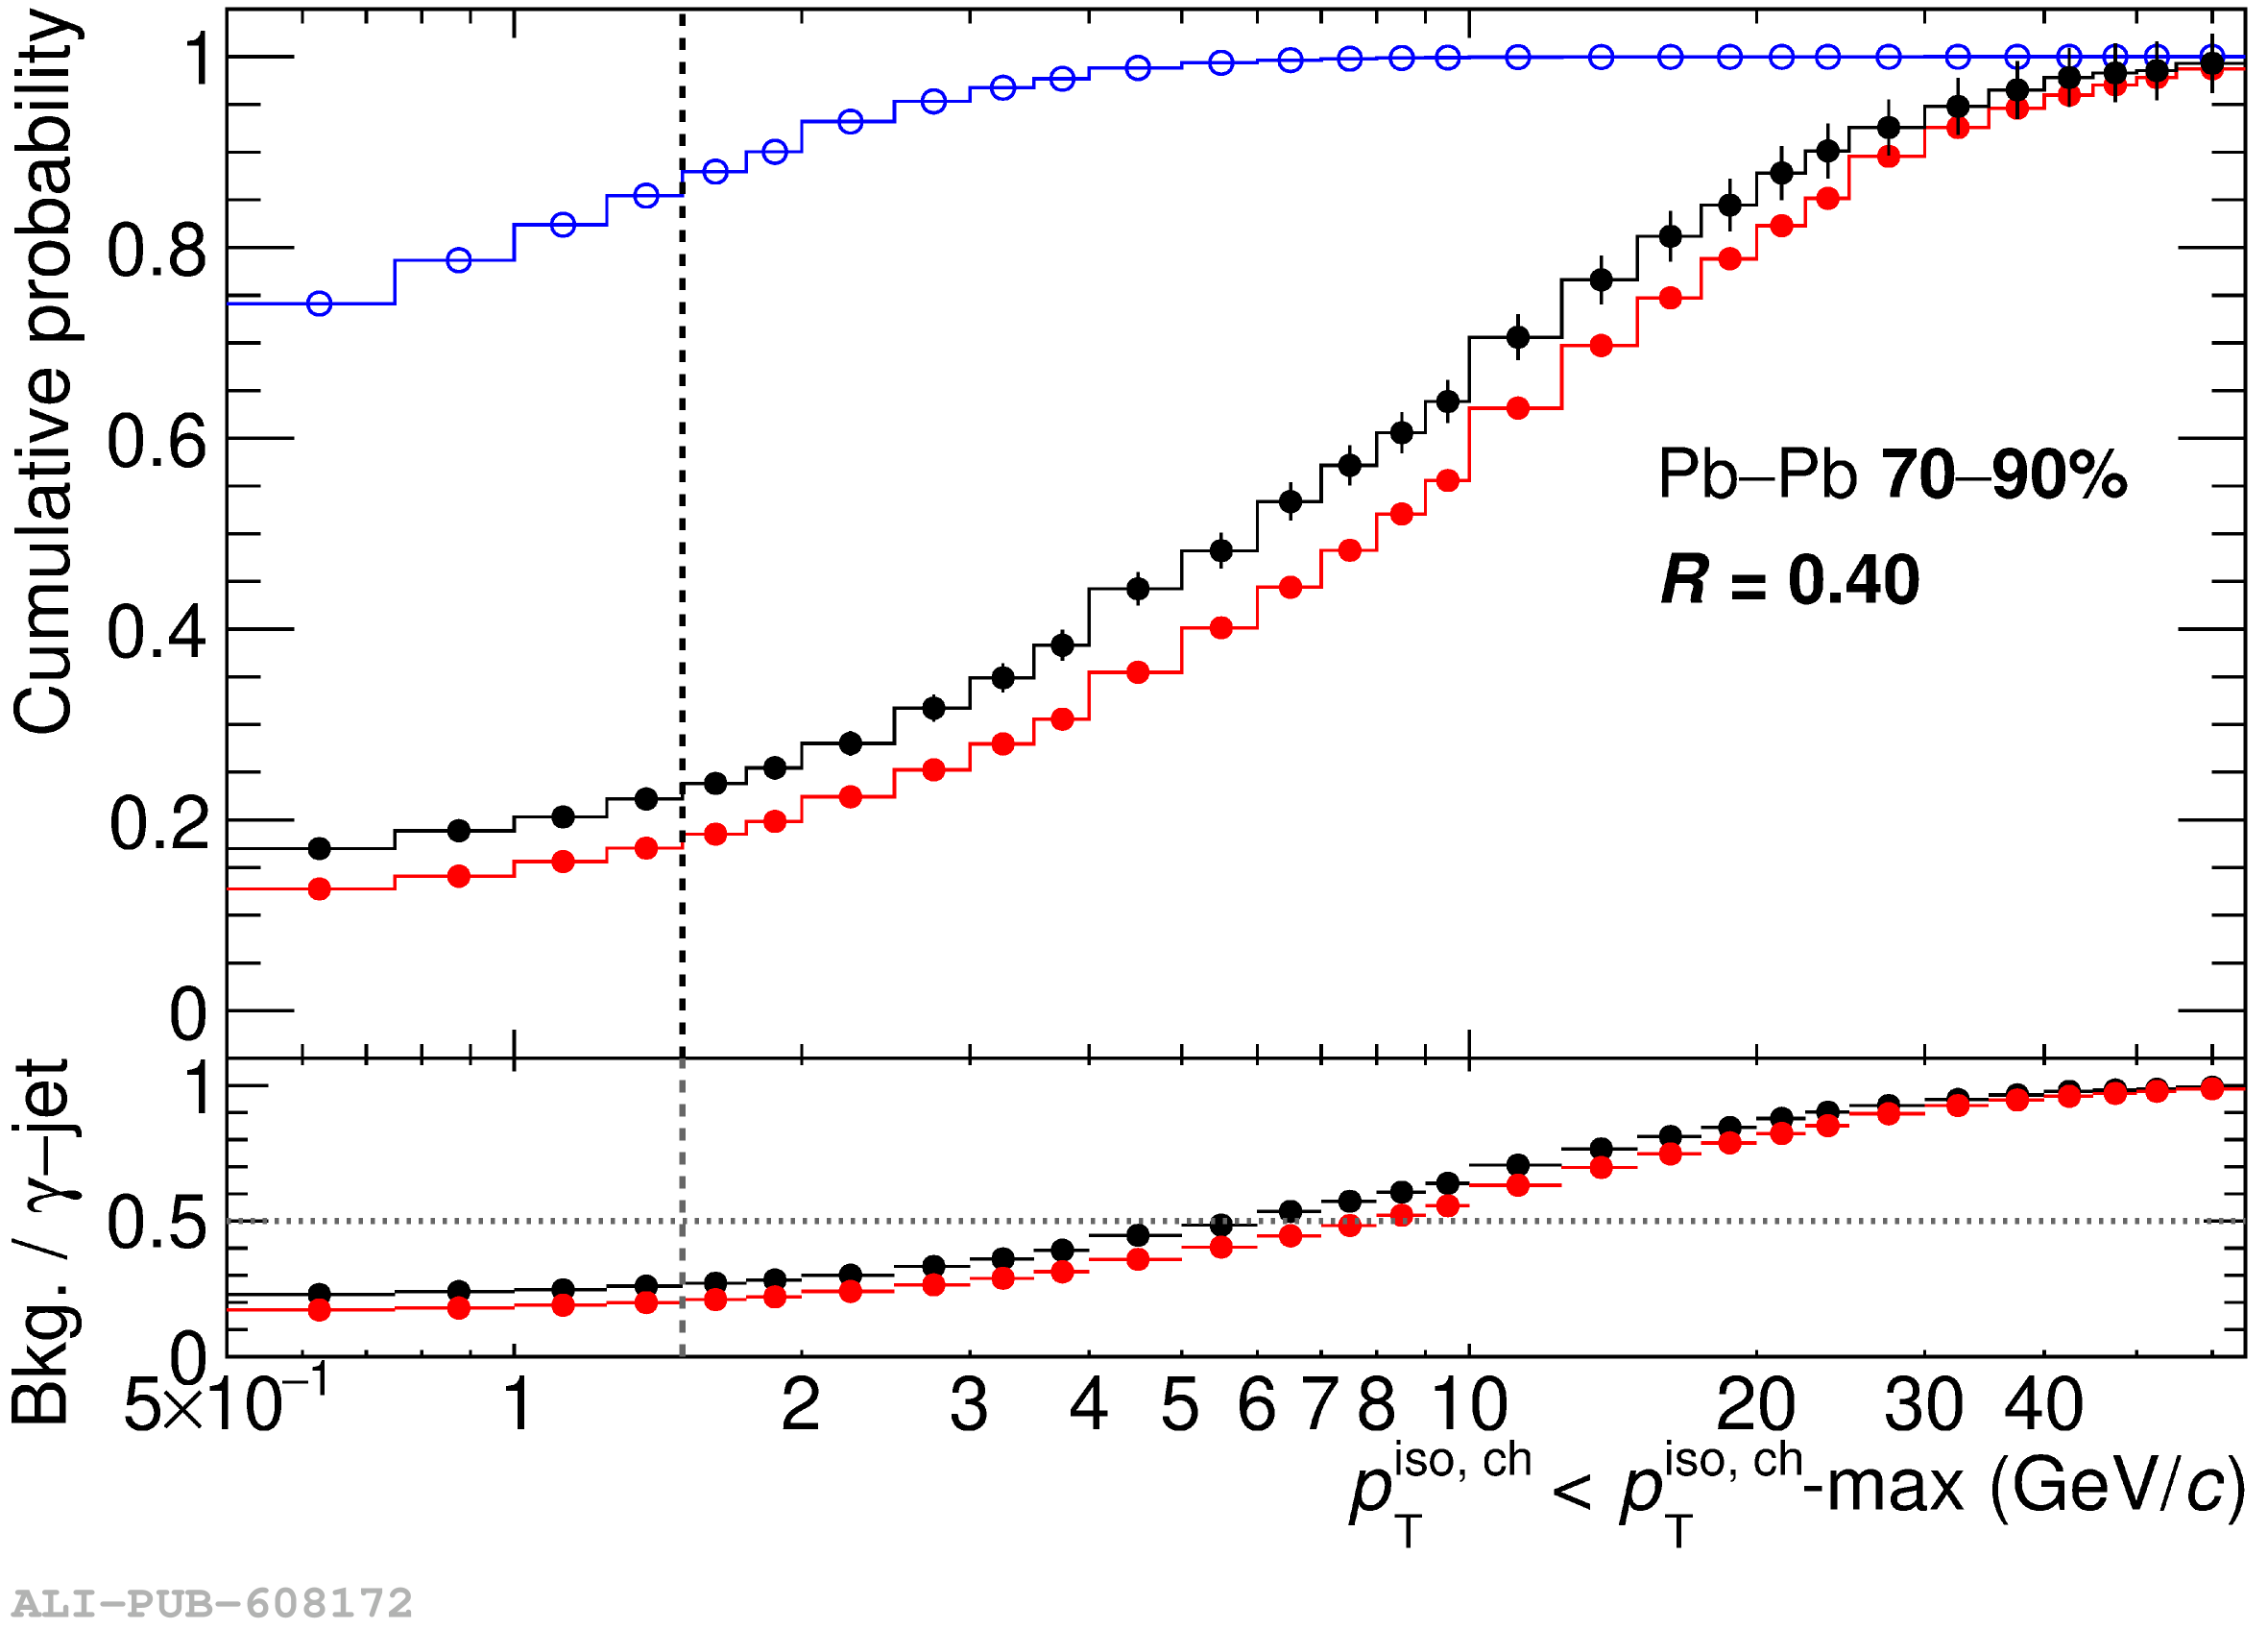 |
Figure P.N.8g
\ Fraction of inclusive clusters with $14\pt16$ \GeVc that pass the isolation selection as a function of the isolation momentum threshold for $R=0.2$ (left) and $R=0.4$ (right), for signal $\gamma$--jet MC narrow clusters ($0.1\sigmalongPb0.3$), and for data and background jet--jet MC (photon trigger with $\pt>3.5$ \GeVc in the calorimeter acceptance) wide clusters ($0.4\sigmalongPb2$). For \PbPb simulations, MC clusters are embedded into minimum bias \PbPb data. From top to bottom, 0--10\% \PbPb collisions, 30--50\% \PbPb collisions, 70--90\% \PbPb collisions and \pp collisions. Lower frame in each panel: ratio of the distribution for wide clusters in data and jet--jet MC over the distributions for $\gamma$--jet MC narrow clusters. Horizontal dashed line set at \ptIsoCh = 1.5 \GeVc. | 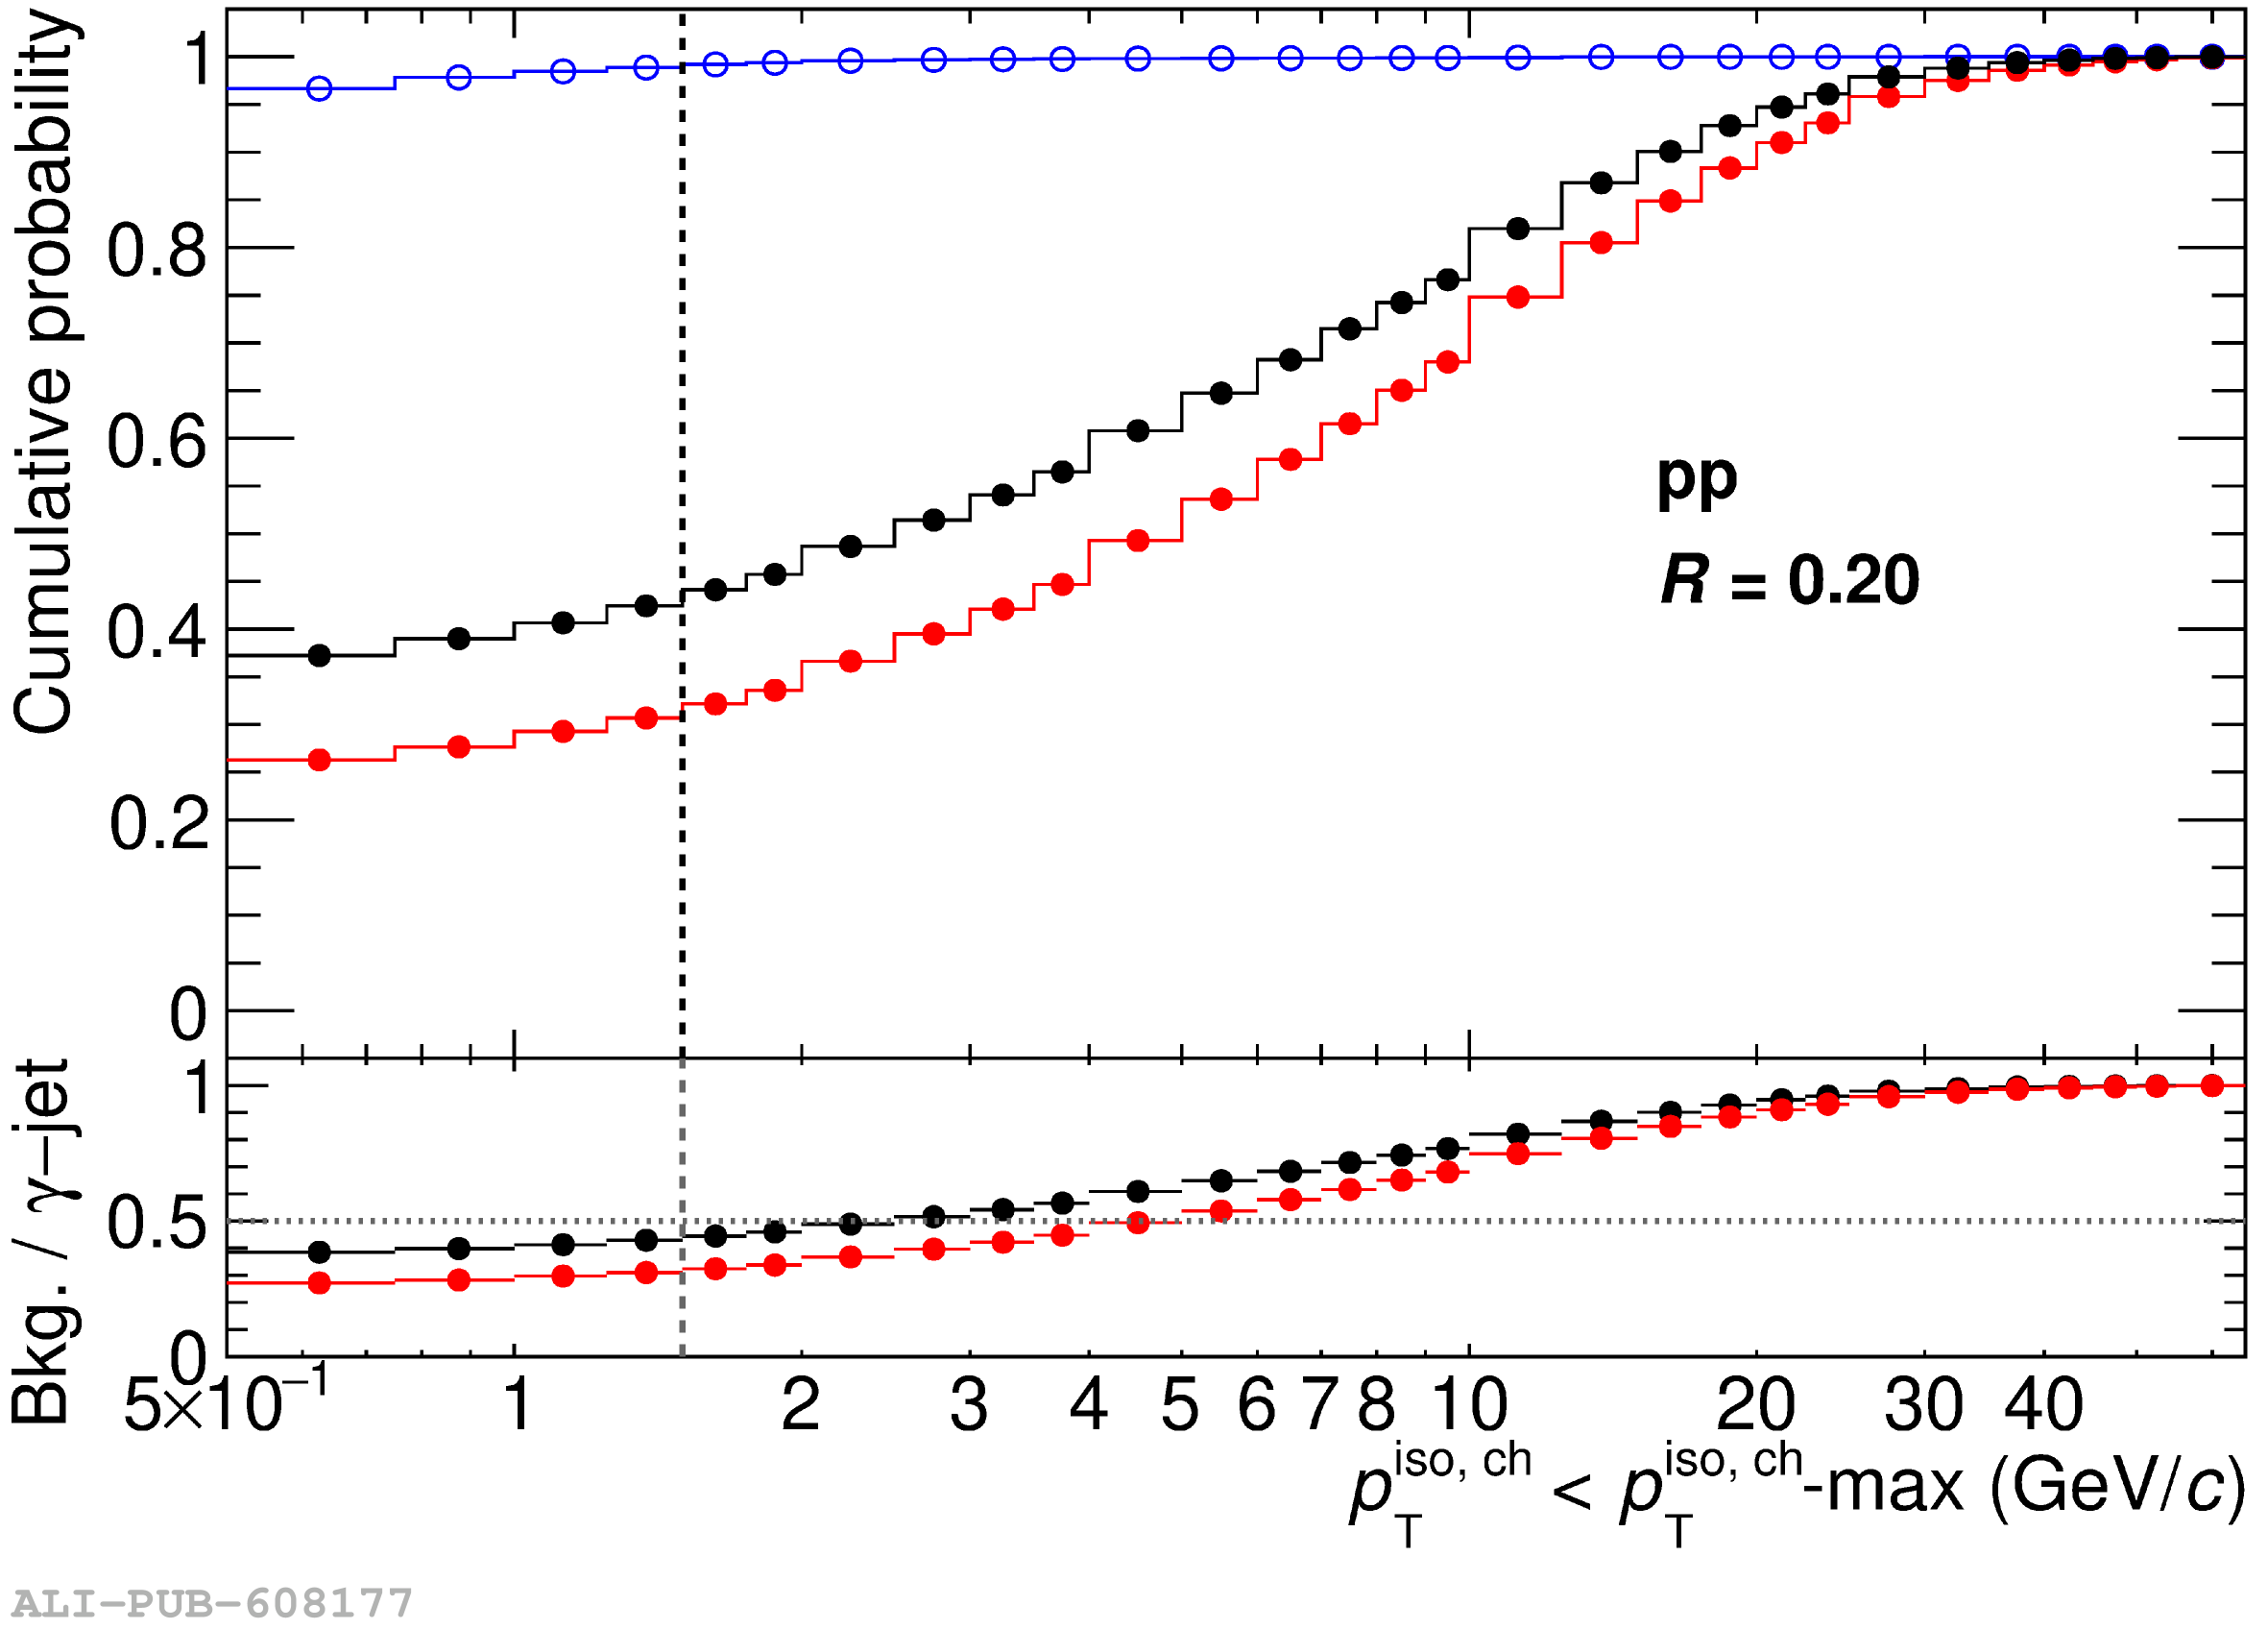 |
Figure P.N.8h
\ Fraction of inclusive clusters with $14\pt16$ \GeVc that pass the isolation selection as a function of the isolation momentum threshold for $R=0.2$ (left) and $R=0.4$ (right), for signal $\gamma$--jet MC narrow clusters ($0.1\sigmalongPb0.3$), and for data and background jet--jet MC (photon trigger with $\pt>3.5$ \GeVc in the calorimeter acceptance) wide clusters ($0.4\sigmalongPb2$). For \PbPb simulations, MC clusters are embedded into minimum bias \PbPb data. From top to bottom, 0--10\% \PbPb collisions, 30--50\% \PbPb collisions, 70--90\% \PbPb collisions and \pp collisions. Lower frame in each panel: ratio of the distribution for wide clusters in data and jet--jet MC over the distributions for $\gamma$--jet MC narrow clusters. Horizontal dashed line set at \ptIsoCh = 1.5 \GeVc. | 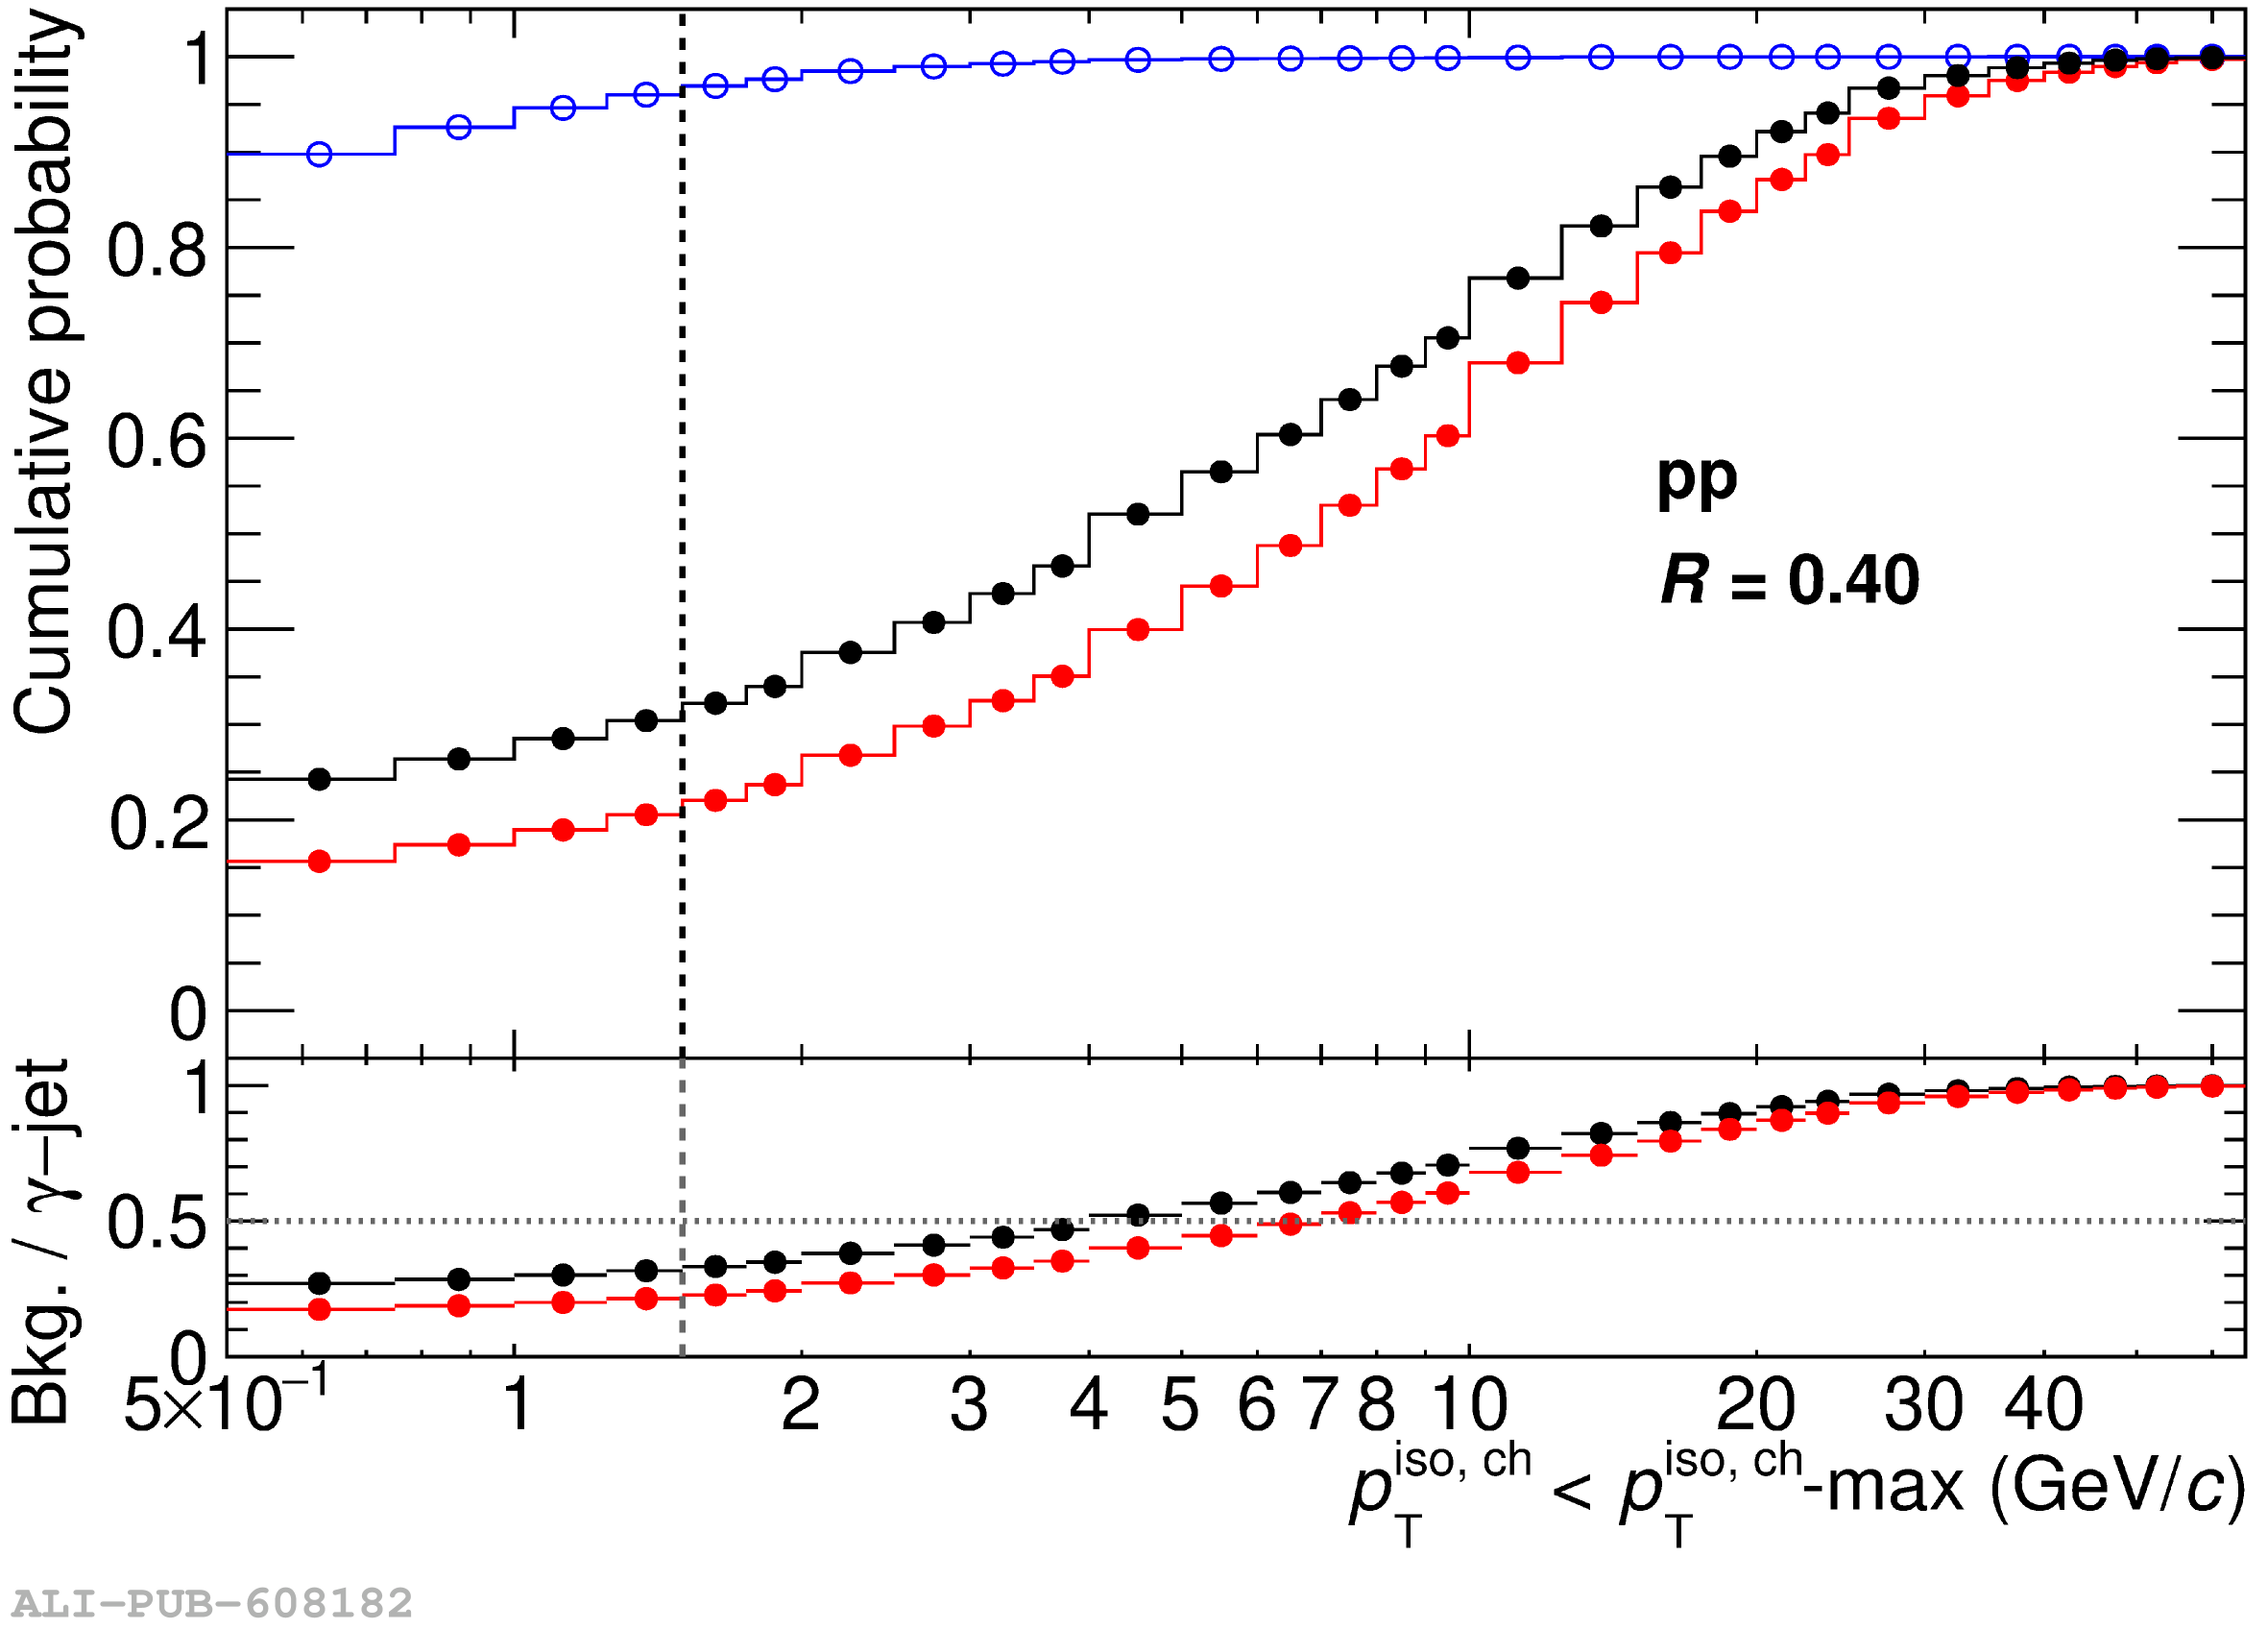 |
Figure P.N.9
\ Illustration of the parametric space of the photon isolation momentum and the shower width parameter (\sigmalong), used to estimate the background yield in the signal class (\textcolor{blue}{$\mathbb{A}$}) from the observed yields in the three control classes (\textcolor{red}{$\mathbb{B}$}, \textcolor{red}{$\mathbb{C}$}, and \textcolor{red}{$\mathbb{D}$}). The red regions indicate areas dominated by the background, and the blue regions are those that contain the photon signal. The colour gradient between these regions illustrates the presence of a signal contribution in the three background regions. See Figs. ??? and ??? for examples of this in data. | 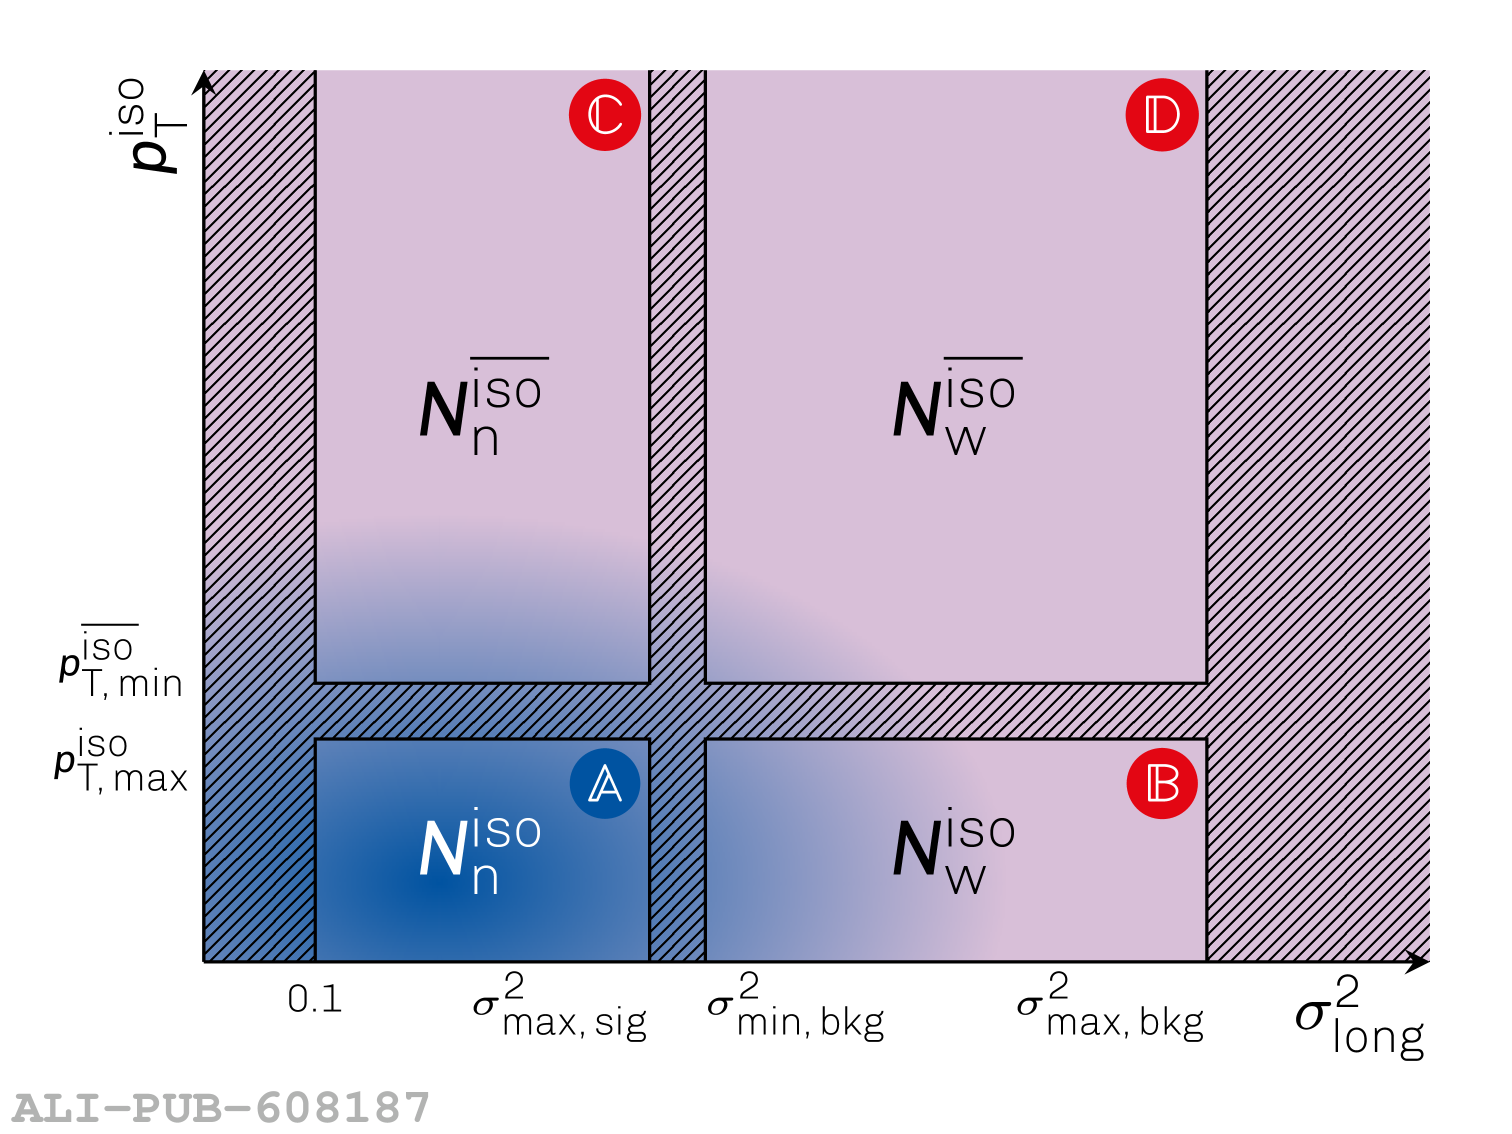 |
Figure P.N.10
\ The parametric space of the cluster isolation momentum and the shower width parameter (\sigmalongPb) in data for $R=0.2$ and $14\pt16$ \GeVc, used to estimate the background yield in the signal class (\textcolor{blue}{$\mathbb{A}$})from the observed yields in the three control classes (\textcolor{red}{$\mathbb{B}$}, \textcolor{red}{$\mathbb{C}$}, and \textcolor{red}{$\mathbb{D}$}). The dashed boxes indicate the limits of each class, the lower signal \ptIsoCh selection is open. | 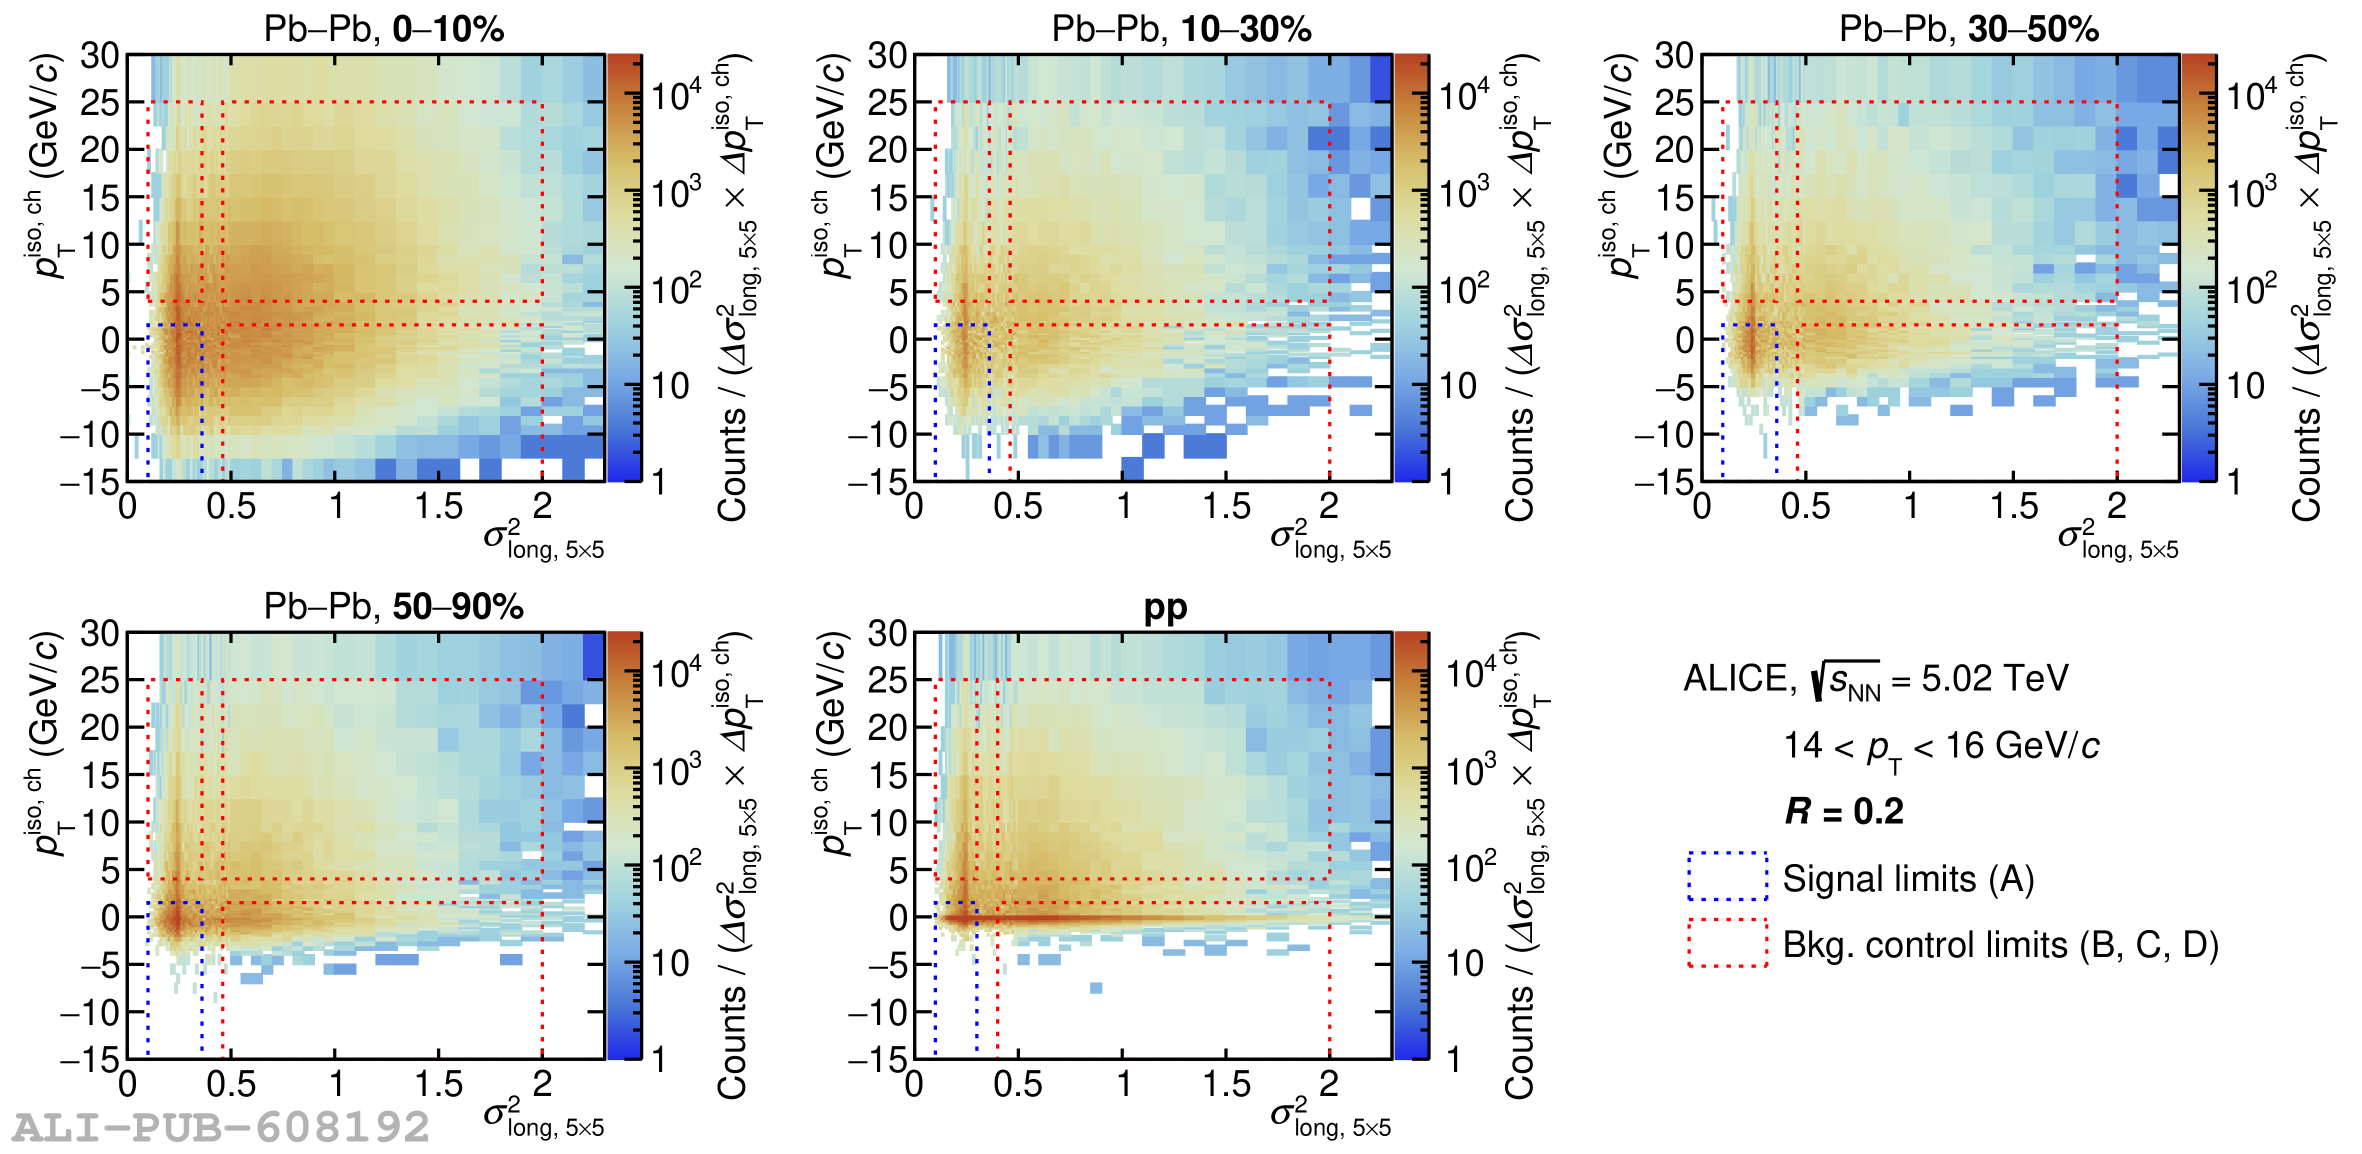 |
Figure P.N.11
\ The parametric space of the cluster isolation momentum and the shower width parameter (\sigmalongPb) in data for $R=0.4$ and $14\pt16$ \GeVc, used to estimate the background yield in the signal class (\textcolor{blue}{$\mathbb{A}$}) from the observed yields in the three control classes (\textcolor{red}{$\mathbb{B}$}, \textcolor{red}{$\mathbb{C}$}, and \textcolor{red}{$\mathbb{D}$}). The dashed boxes indicate the limits of each class, the lower signal \ptIsoCh selection is open. | 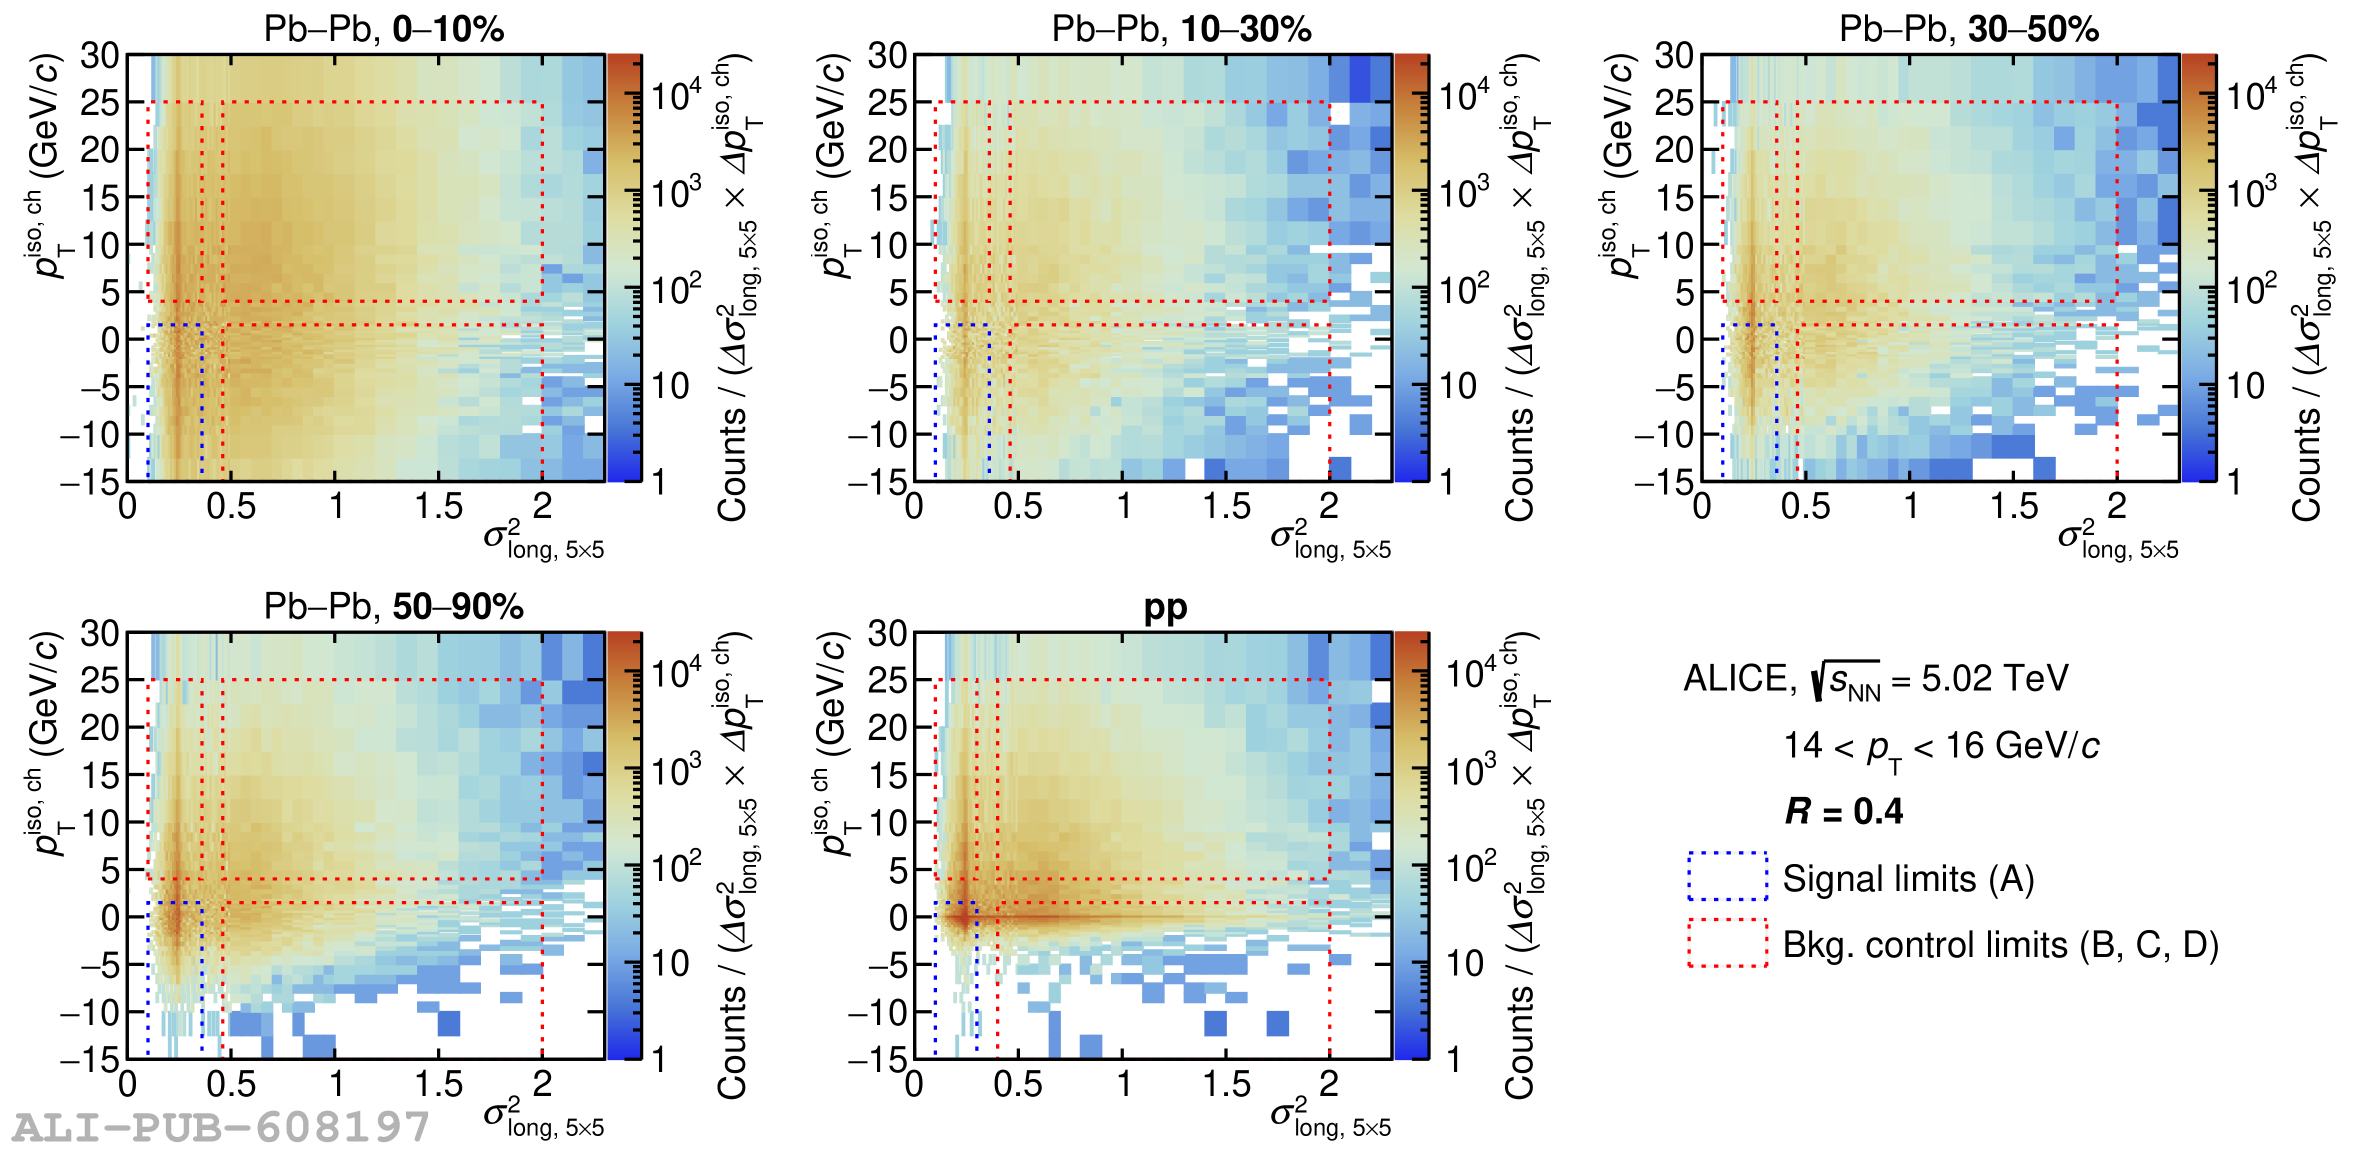 |
Figure P.N.12
\ For each panel: Top, ratio of isolated and anti-isolated \sigmalongPb\ distribution in data and simulation; Bottom, the ratio of the two, $f$(\sigmalongPb). Top row for $12\pt14$ \GeVc and bottom row for $30\pt40$ \GeVc. Each row reports results for 0--10\% (left) and 30--50\% (middle) \PbPb collisions and \pp collisions (right) for $R=0.2$. | 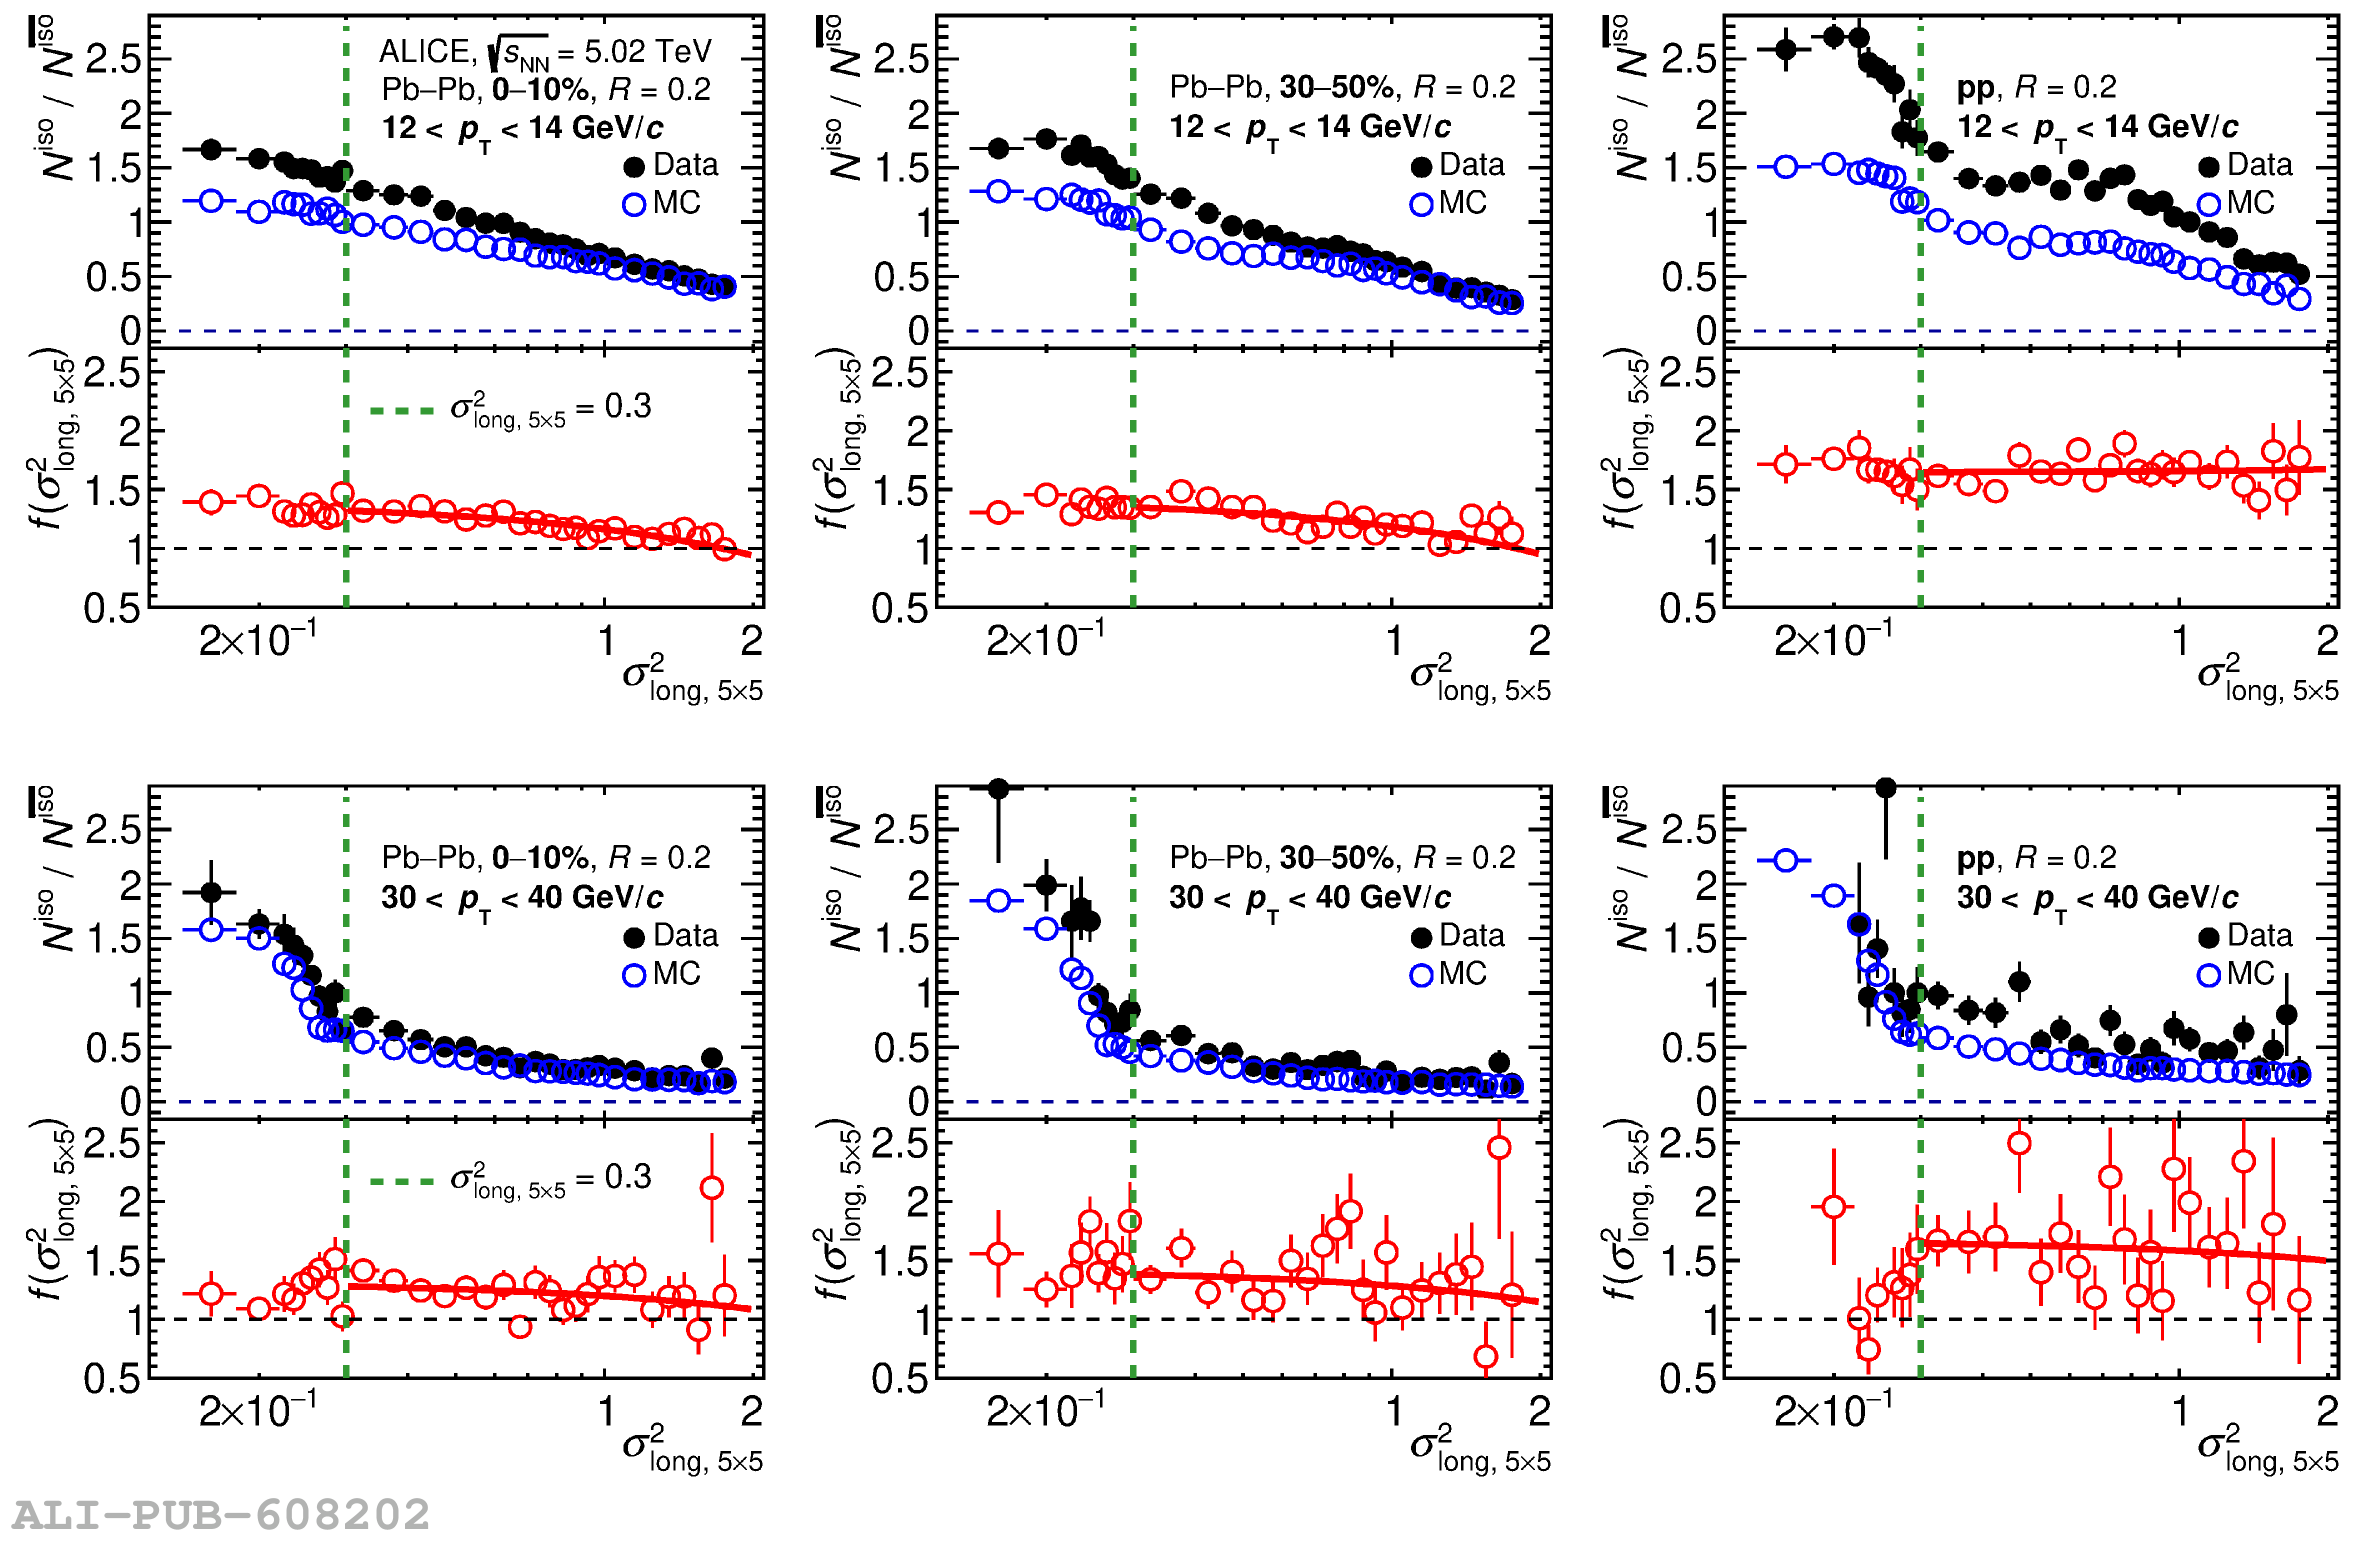 |
Figure P.N.13
\ For each panel: Top, ratio of isolated and anti-isolated \sigmalongPb\ distribution in data and simulation; Bottom, the ratio of the two, $f$(\sigmalongPb). Top row for $12\pt14$ \GeVc and bottom row for $30\pt40$ \GeVc. Each row reports results for 0--10\% (left) and 30--50\% (middle) \PbPb collisions and \pp collisions (right) for $R=0.4$. | 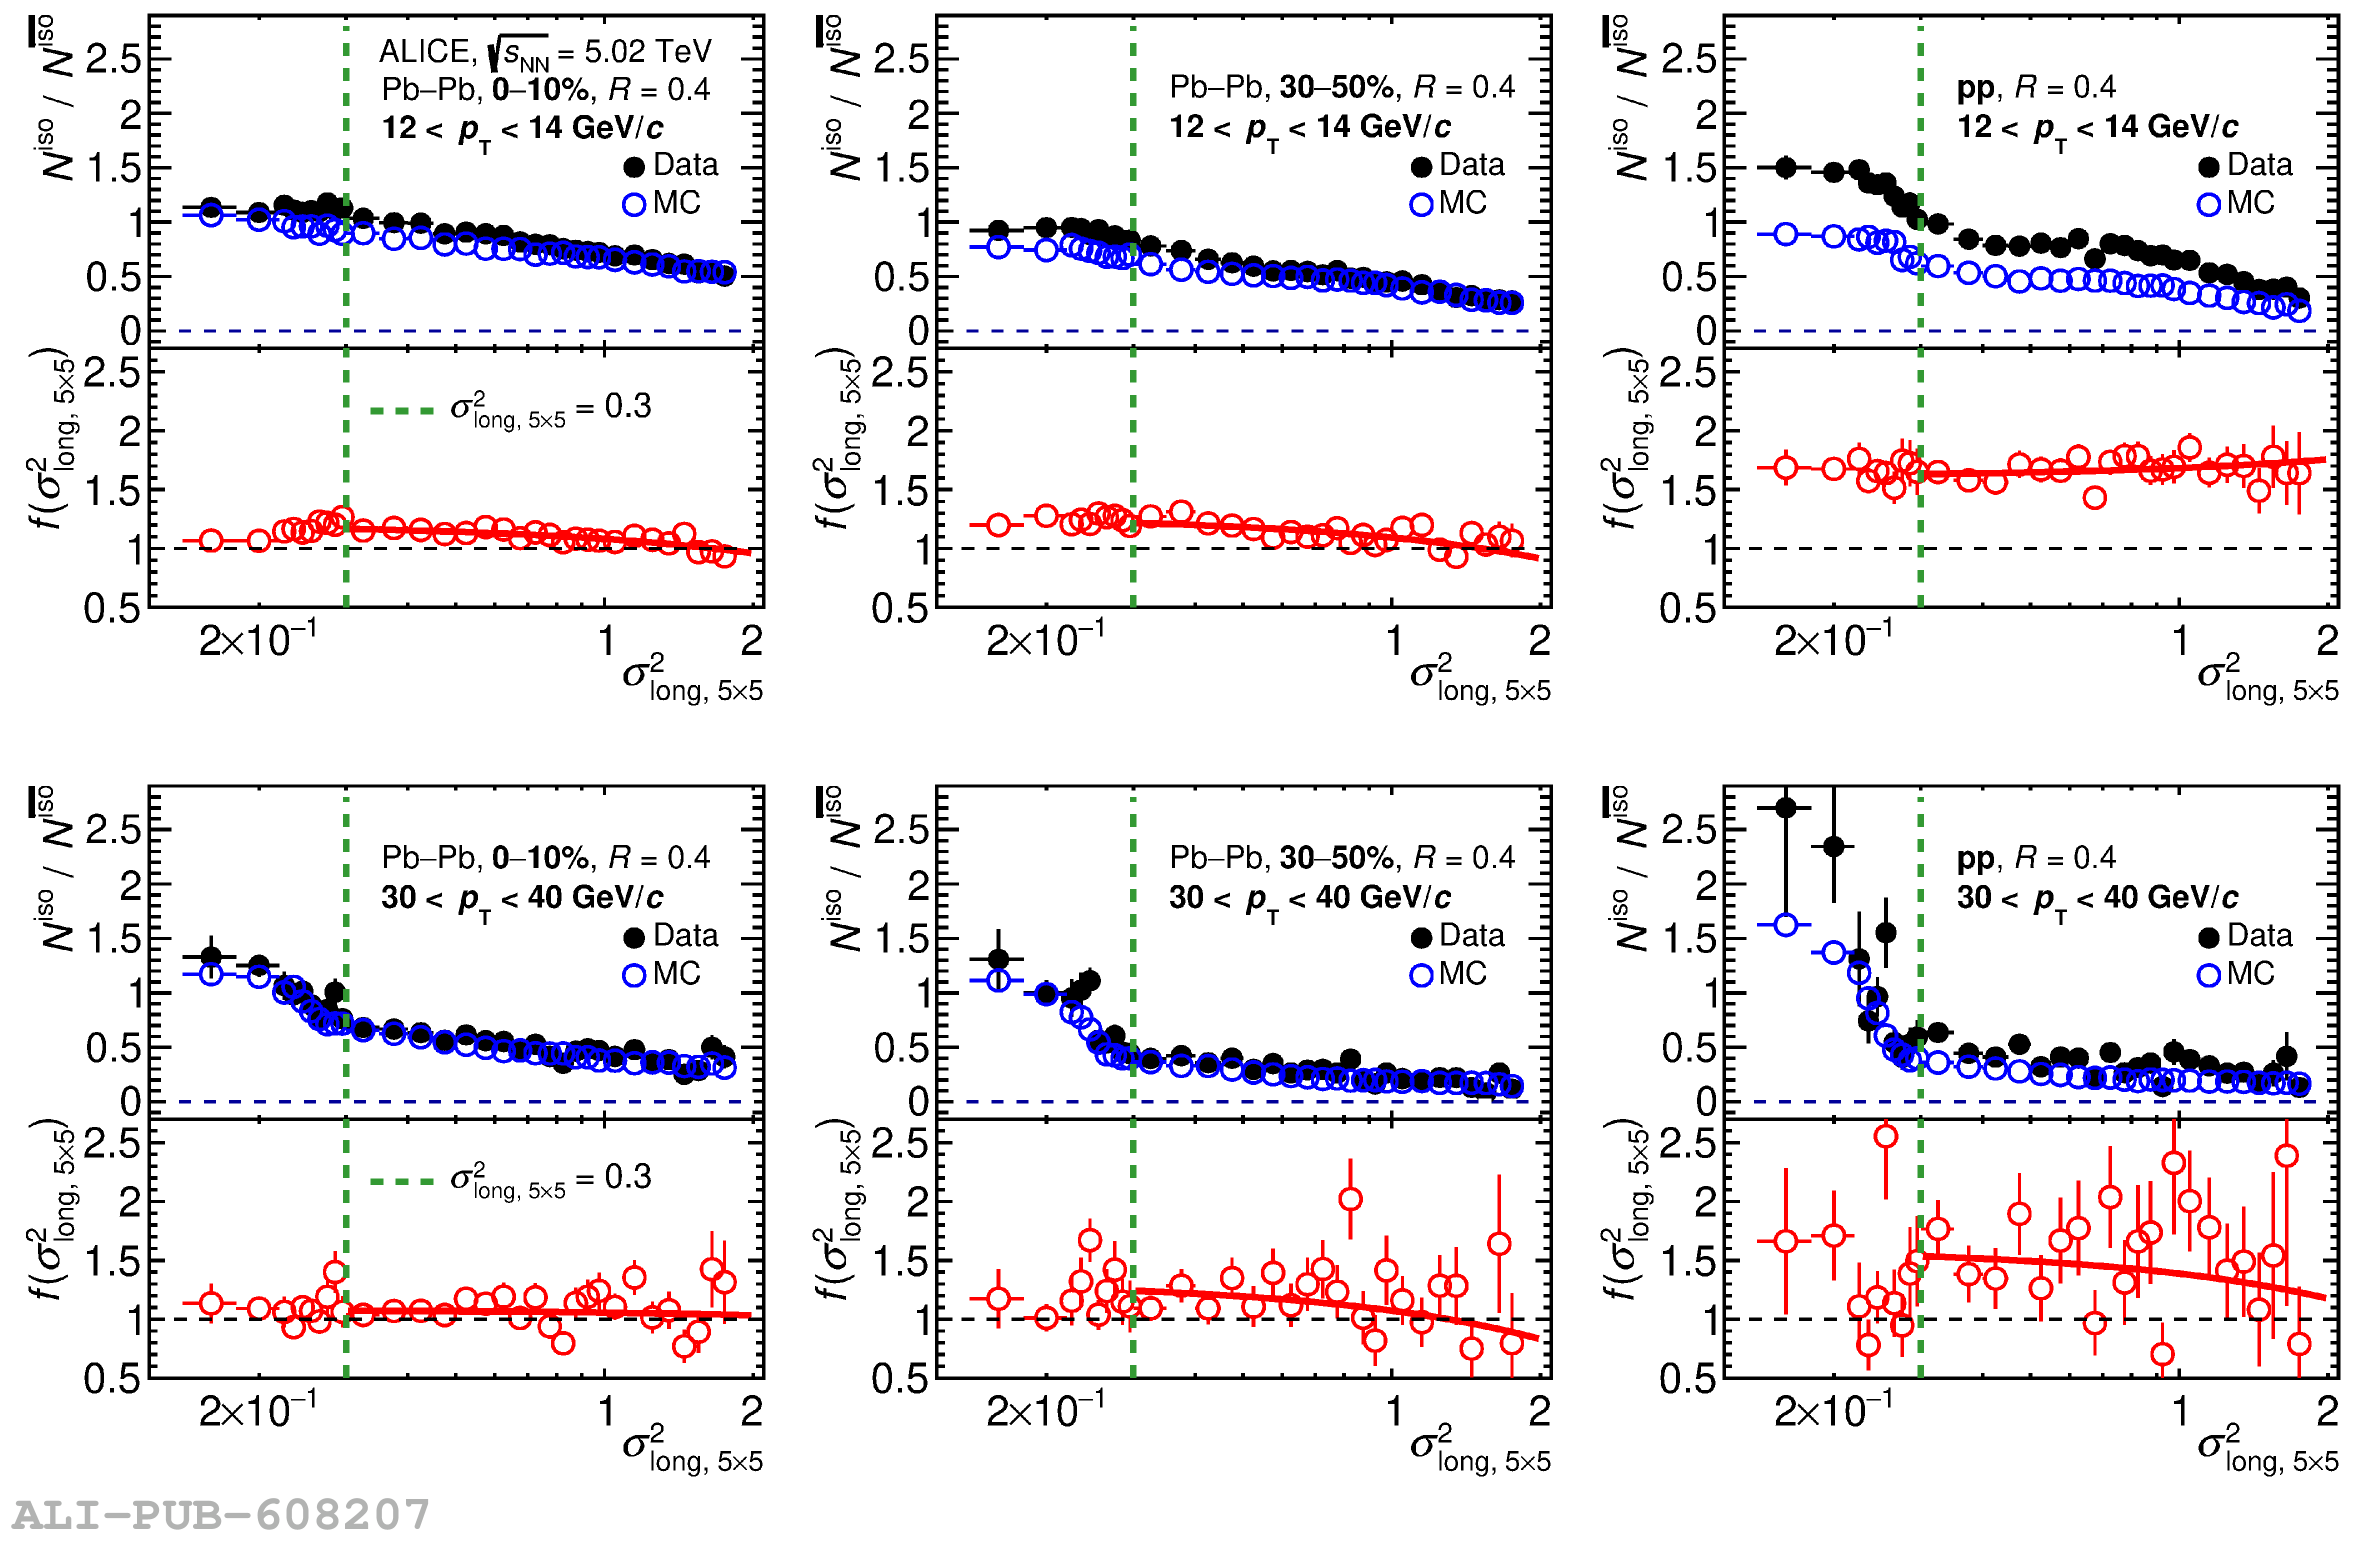 |
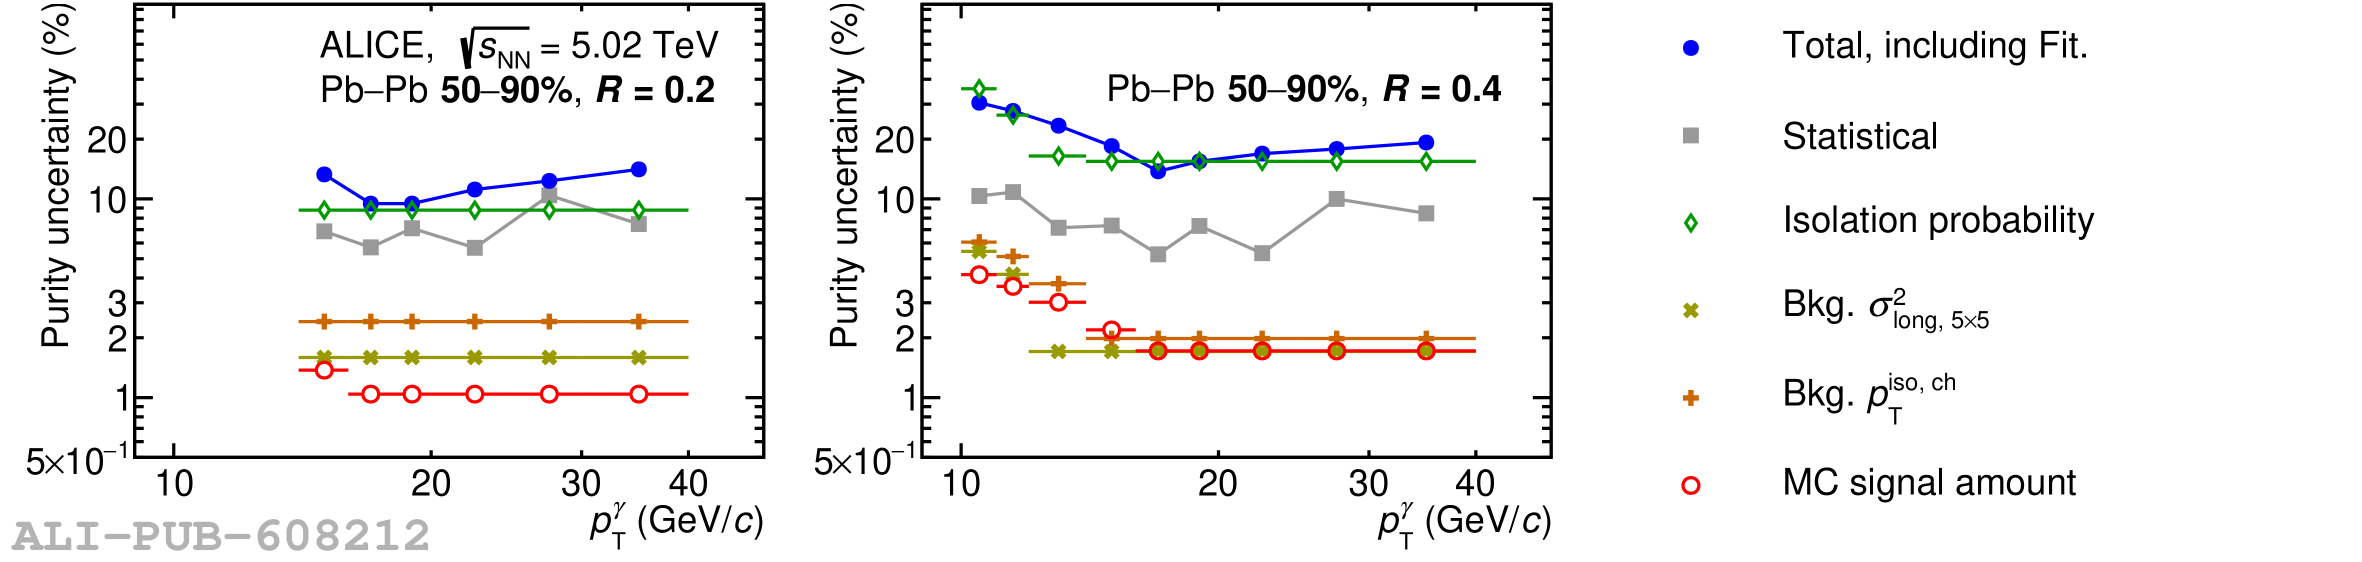
Figure P.N.15
Contributions to the systematic uncertainty of the isolated-photon cross section and their quadratic sum as a function of \ptg for $R=0.2$ (left) and $R=0.4$ (right), in \PbPb collisions for the 50--90\% centrality class Total uncertainty (black dots) is calculated as the quadratic sum of all of the inputs. The statistical uncertainty (grey squares) is also shown. | 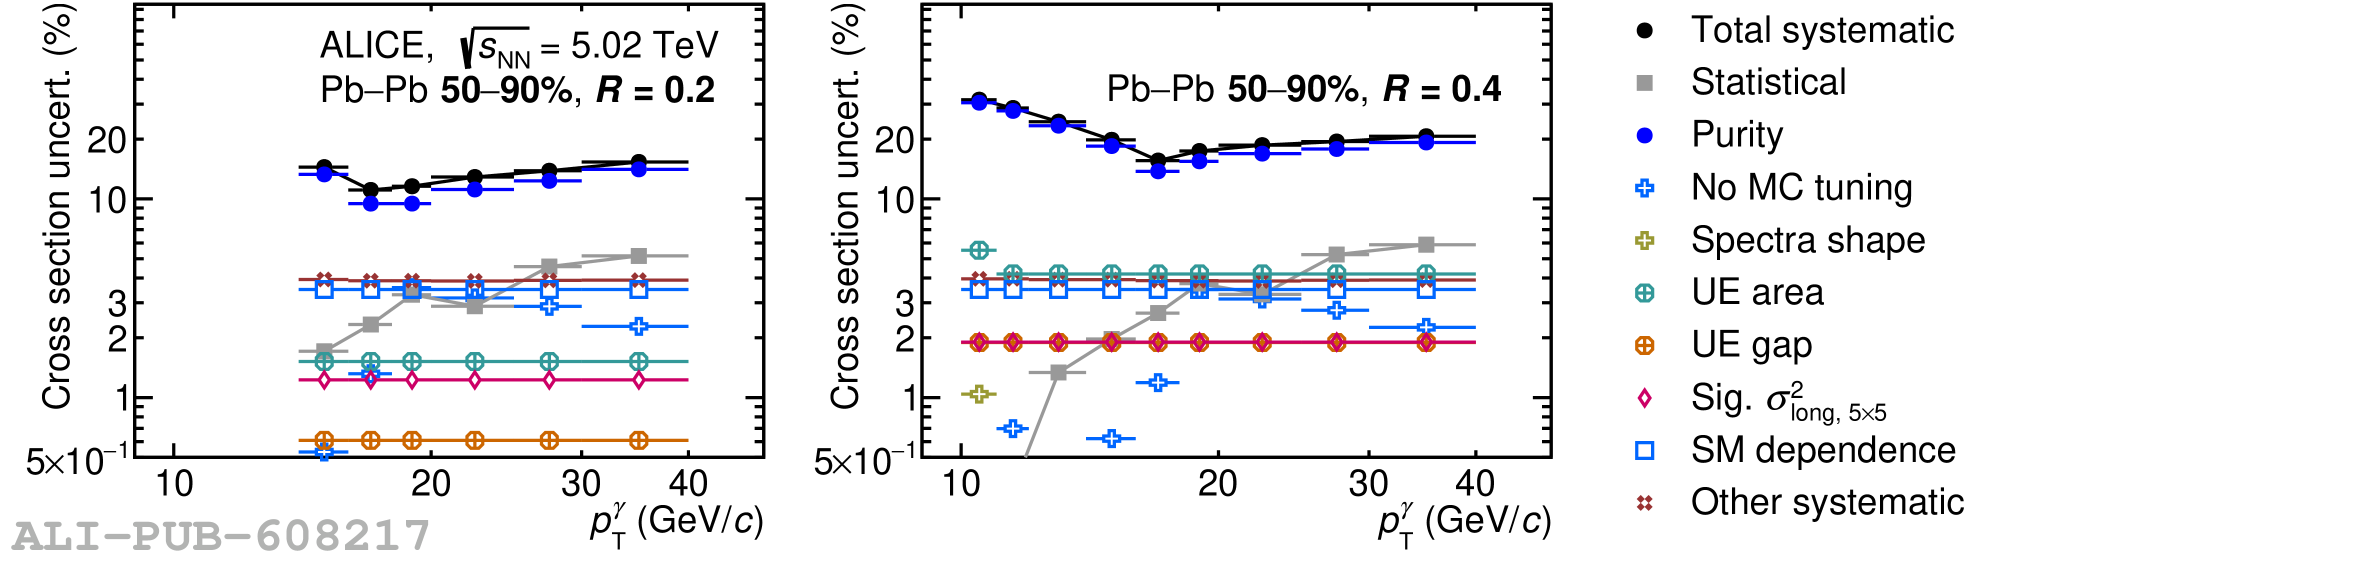 |
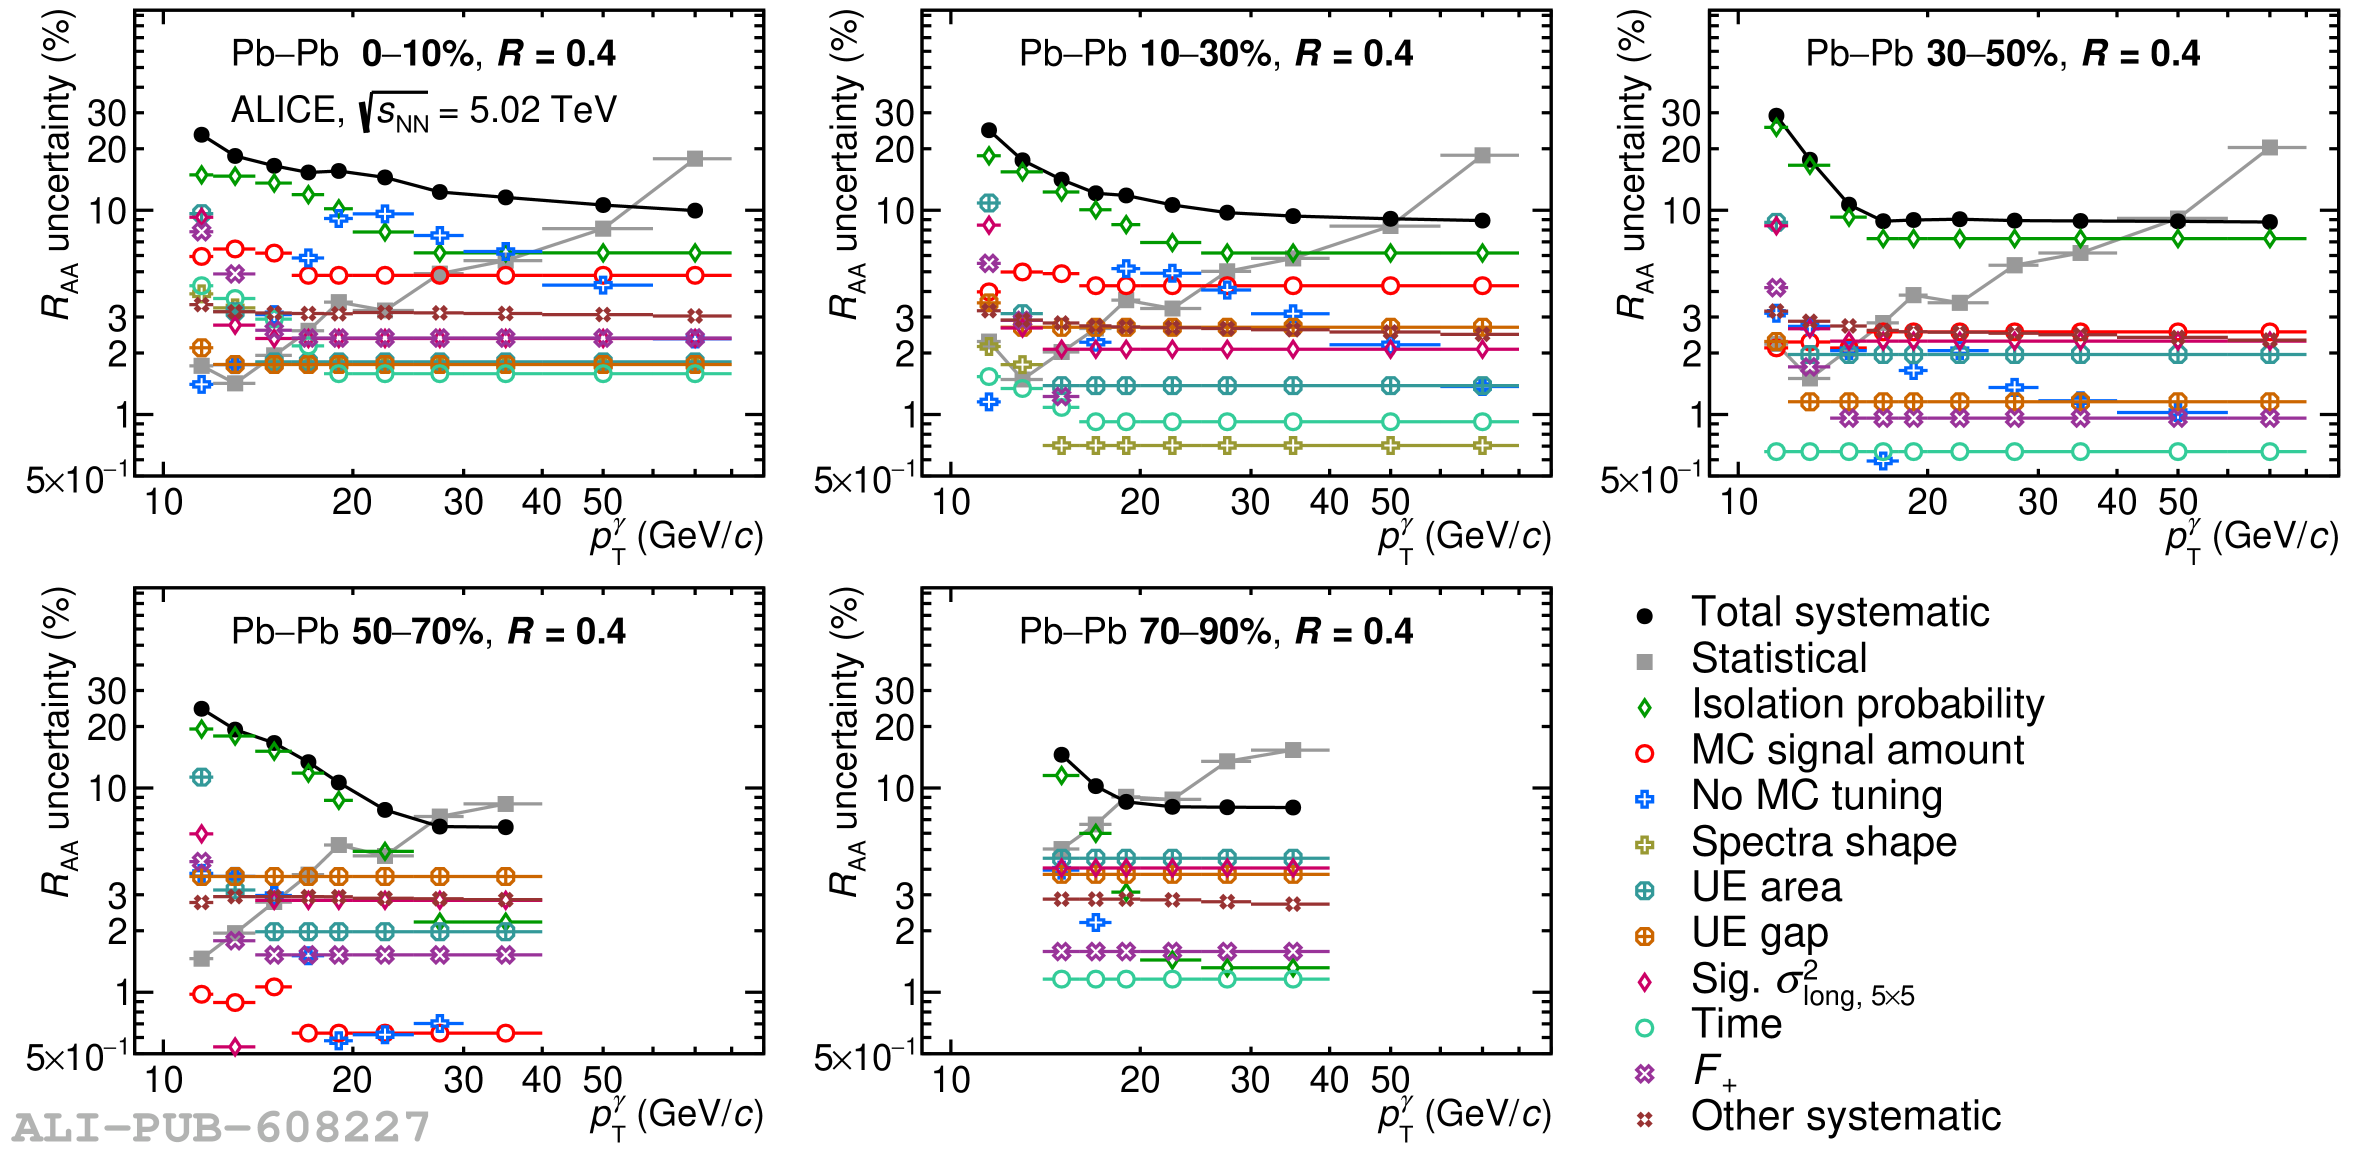
Figure P.N.18
\ Nuclear modification factor \raa for isolated photons at \snnfive for isolation-cone radii $R=0.2$ (black) and $R=0.4$ (blue). In data, the denominator is replaced by the \pp collisions NLO pQCD calculation with JETPHOX Error bars and boxes are the statistical and systematic uncertainties, respectively. The bands correspond to pQCD calculations with JETPHOX for \PbPb collisions (nPDF) for 0--100\% centrality over pp collisions (PDF). The pQCD band ratio is shown only for $R=0.2$ (similar to $R=0.4$) The width of each band corresponds to the scale and PDF uncertainties The normalisation uncertainties are represented as a red box centred at unity The solid line in the most peripheral centrality class 70--90\% at \raa = 0.82 corresponds to the HG-PYTHIA model expectation . | 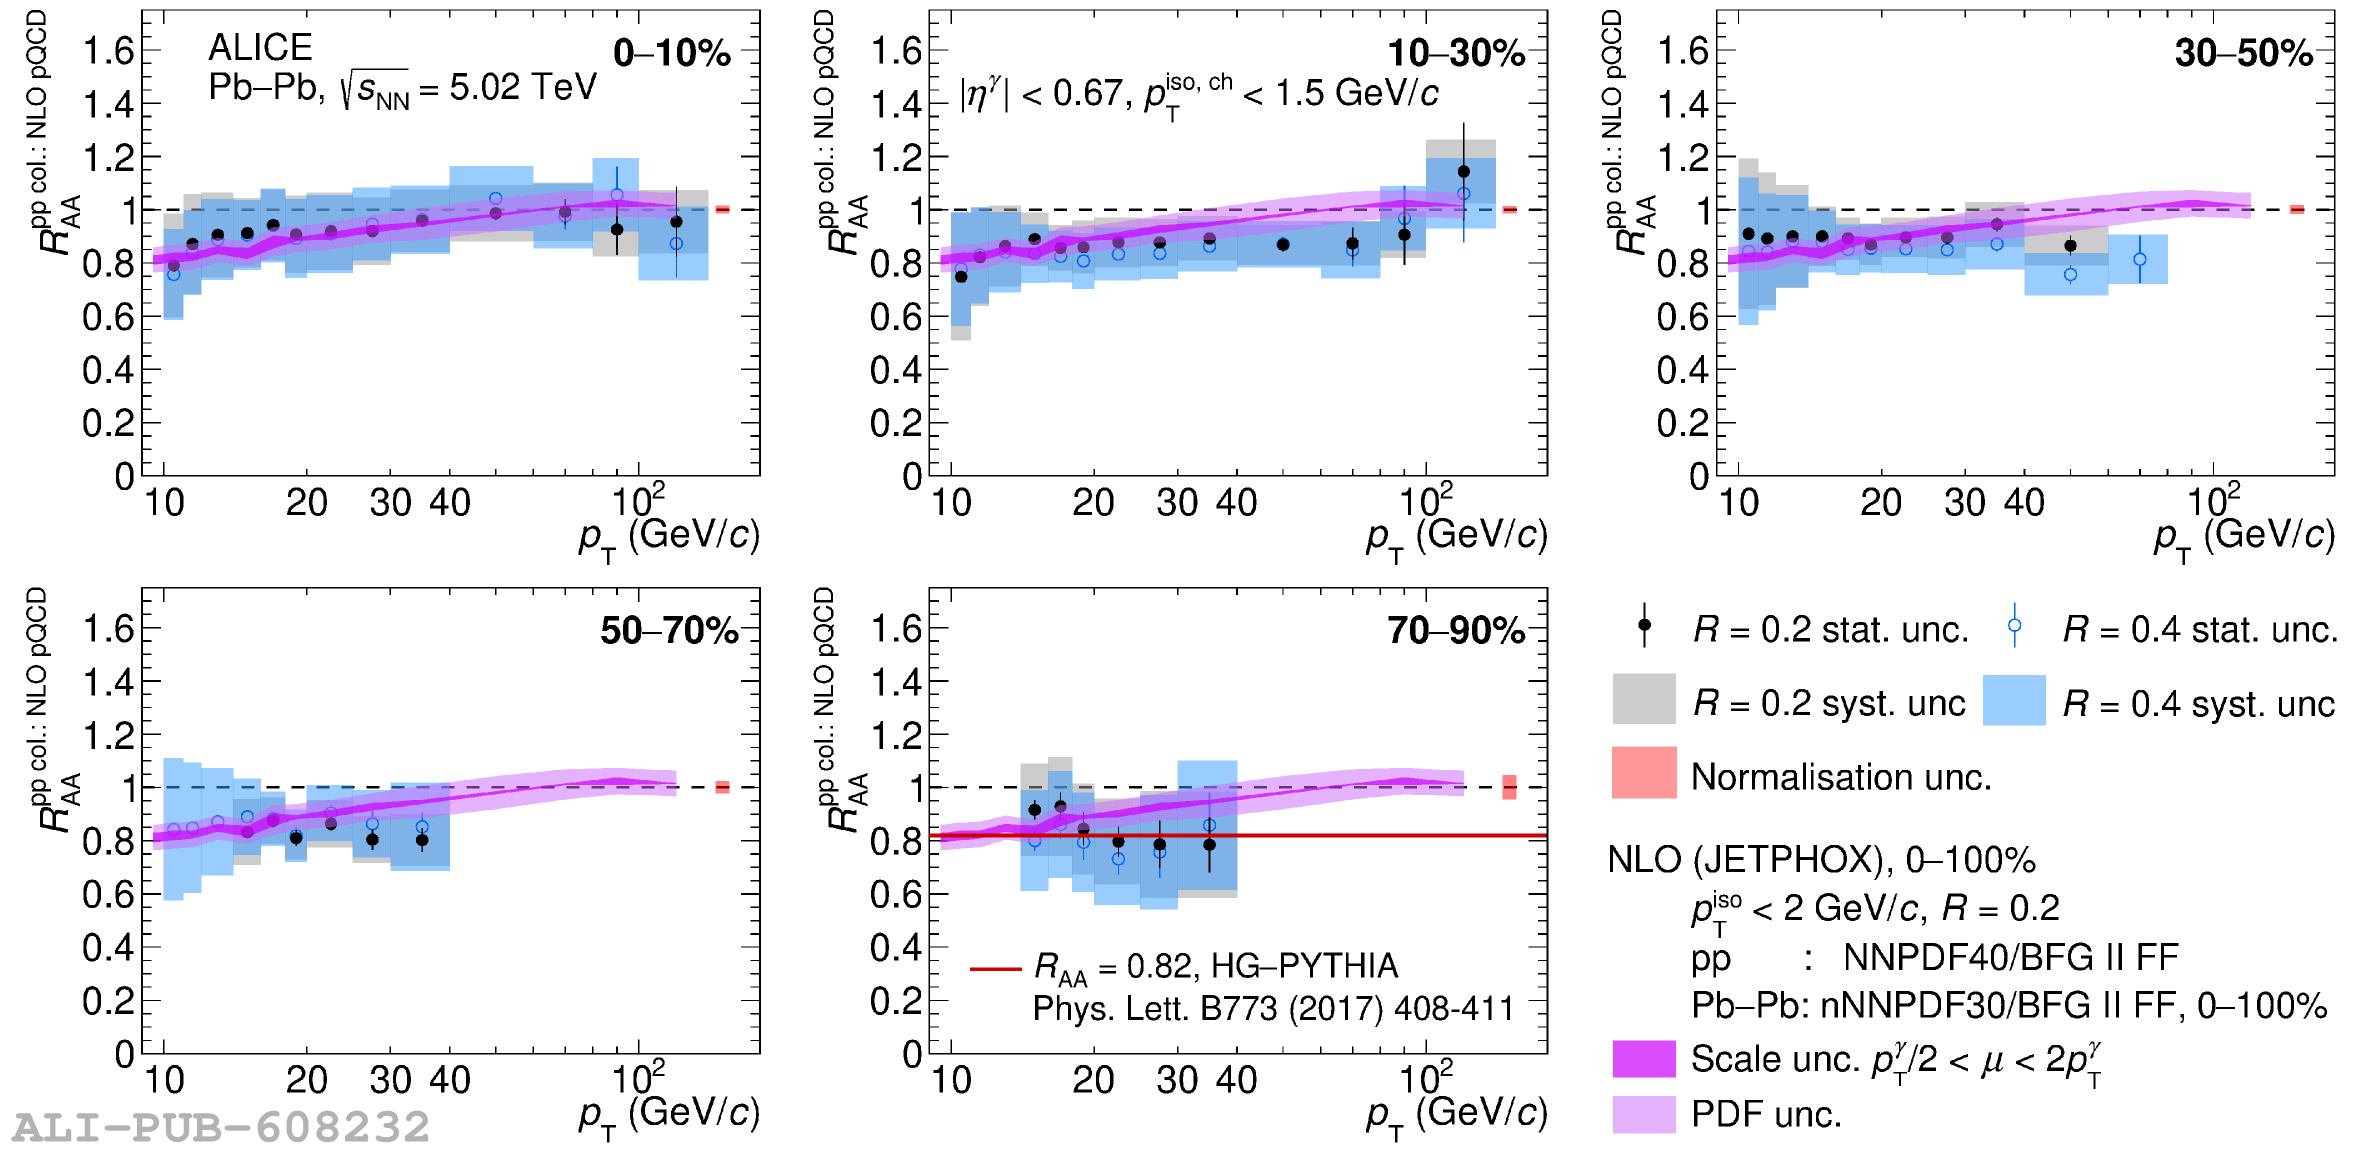 |
Figure P.N.19a
\ Isolated-photon purity (left) and efficiency (right) as a function of \ptg\ for peripheral \PbPb collisions in the 50--90\% centrality class for $R=0.2$ and $R=0.4$. The points are shown with systematic and statistical uncertainties discussed in Sect. 4 of Ref. The purity is calculated using Eq. (???), and the uncertainties are calculated by adding in quadrature all the sources shown in Fig. ??? but considering the fit variation discussed in Sect. ??? The lines in the purity plot are the result of the fit with two sigmoid functions, Eq. (???), for each cone radius The efficiency and its uncertainties are obtained as explained in Sect. 3.5 and Sect. 4 of Ref. . | 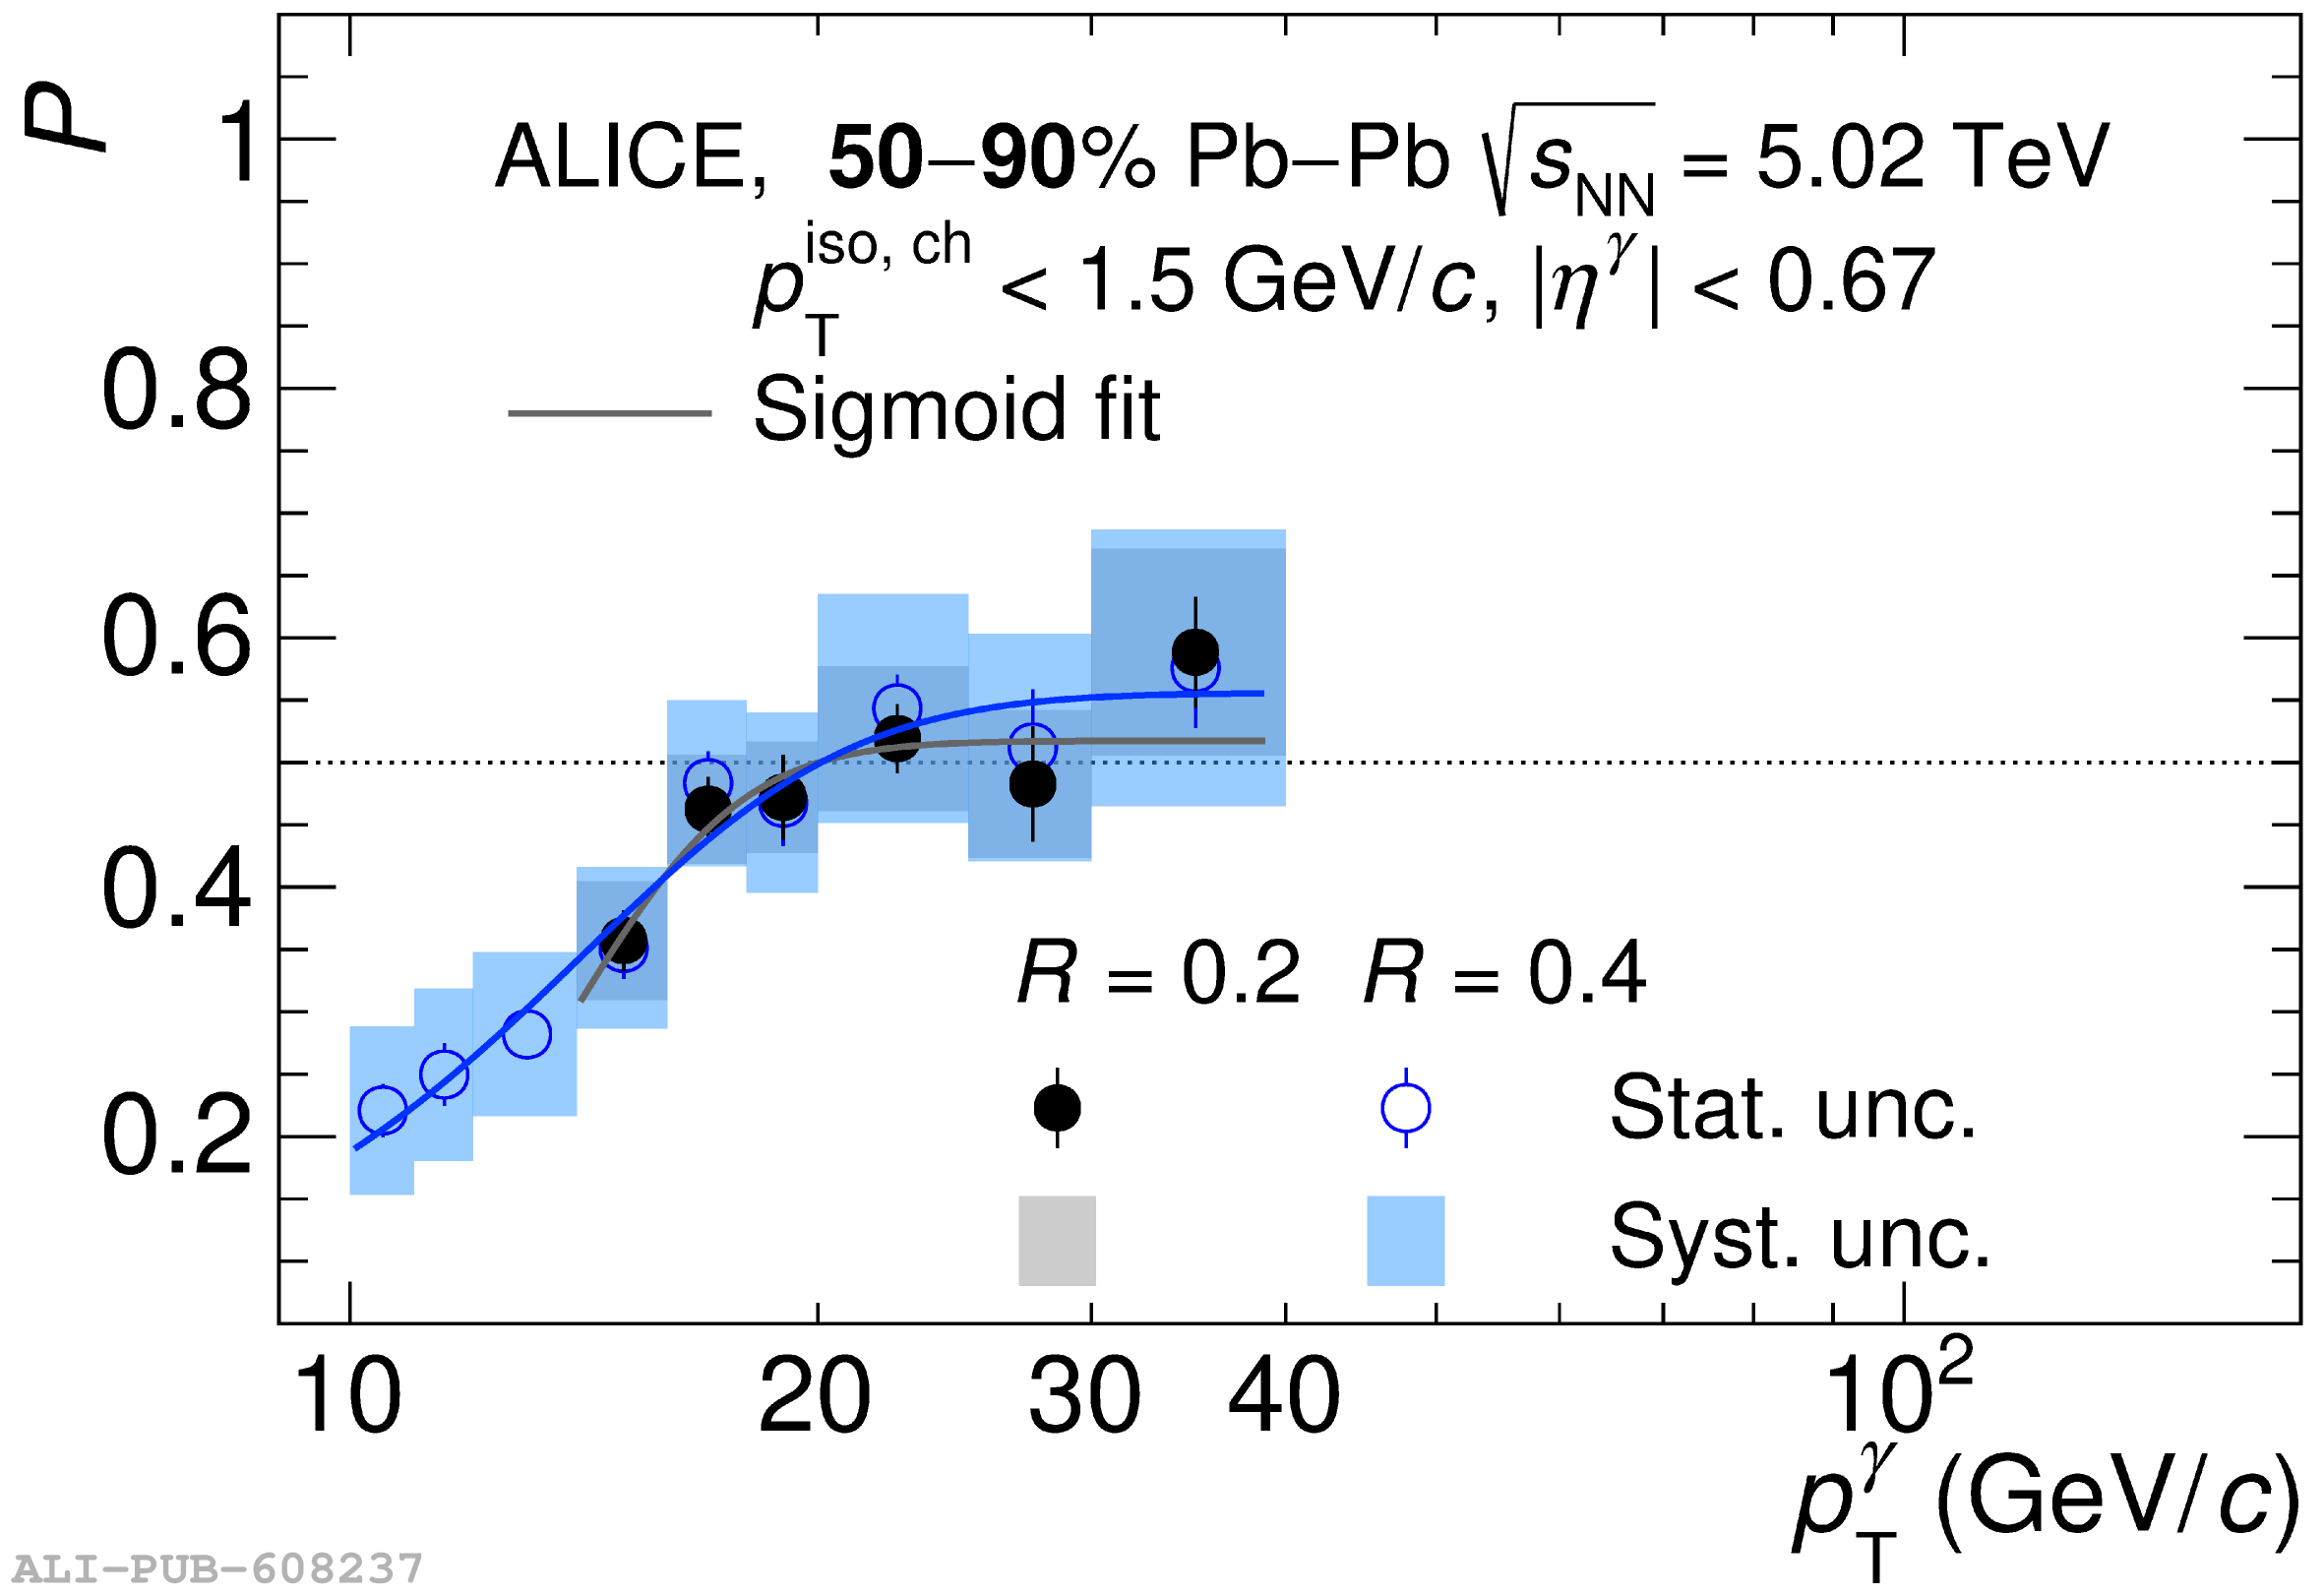 |
Figure P.N.19b
\ Isolated-photon purity (left) and efficiency (right) as a function of \ptg\ for peripheral \PbPb collisions in the 50--90\% centrality class for $R=0.2$ and $R=0.4$. The points are shown with systematic and statistical uncertainties discussed in Sect. 4 of Ref. The purity is calculated using Eq. (???), and the uncertainties are calculated by adding in quadrature all the sources shown in Fig. ??? but considering the fit variation discussed in Sect. ??? The lines in the purity plot are the result of the fit with two sigmoid functions, Eq. (???), for each cone radius The efficiency and its uncertainties are obtained as explained in Sect. 3.5 and Sect. 4 of Ref. . | 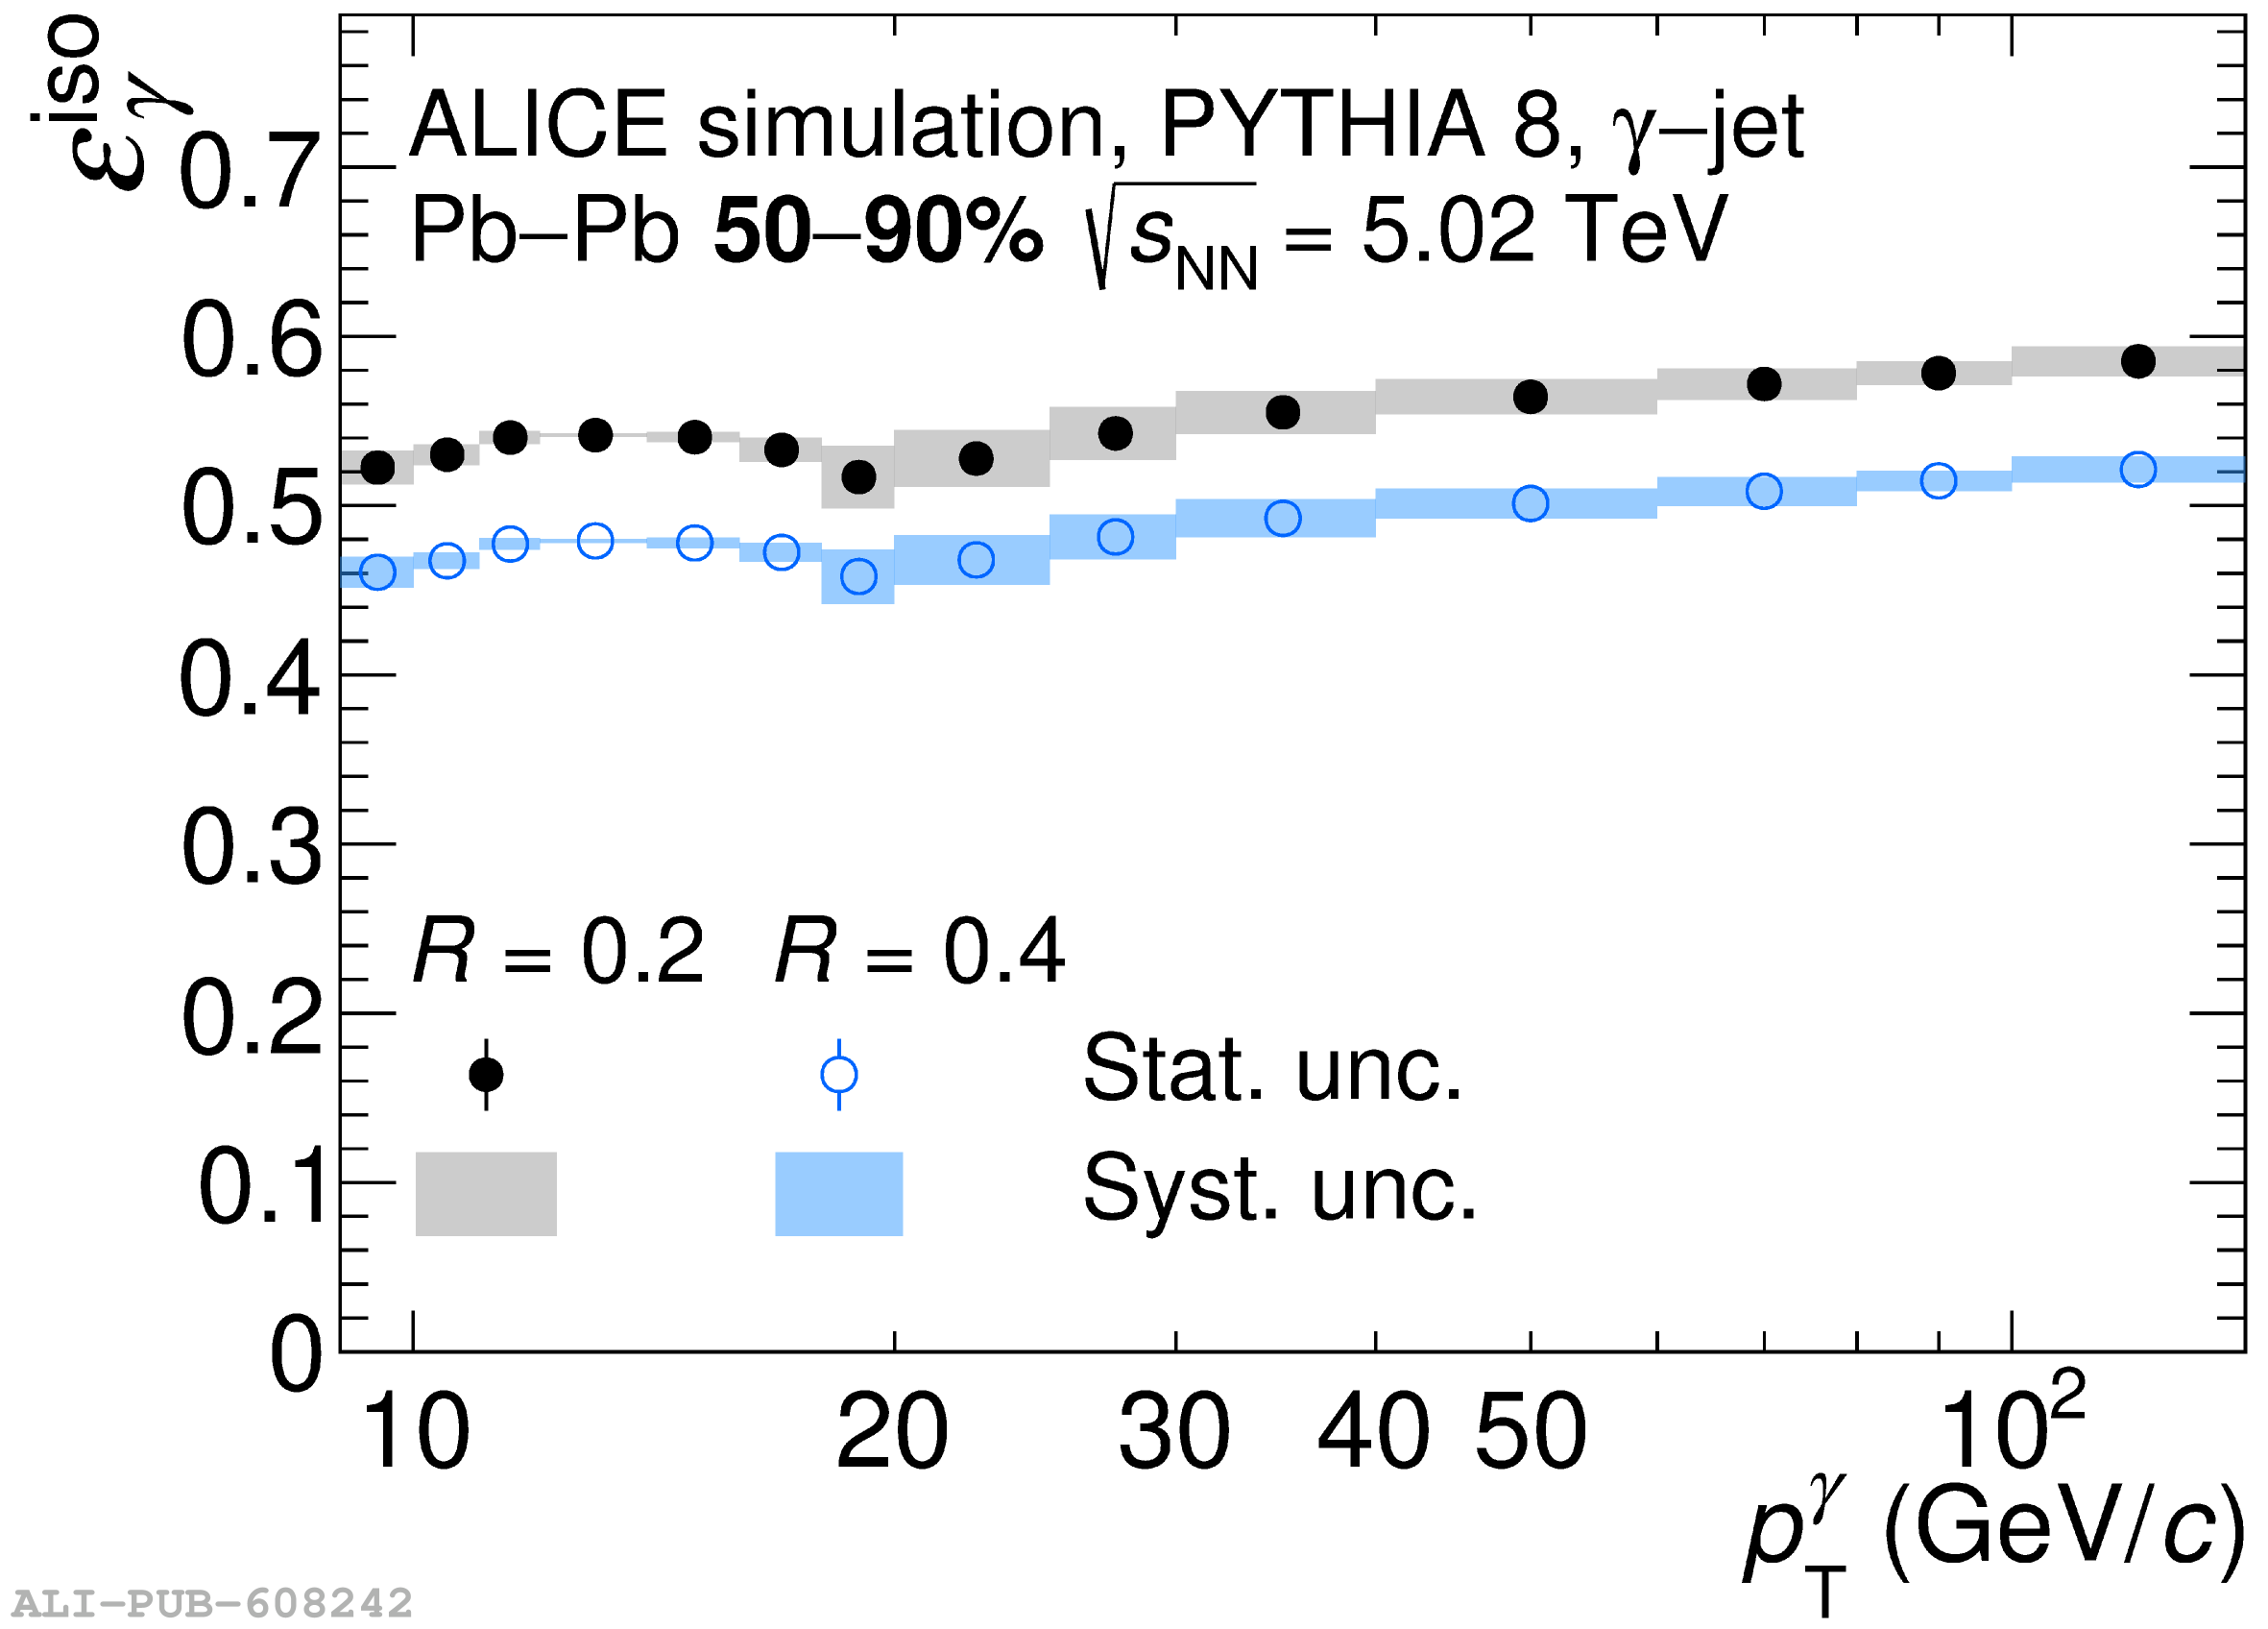 |
Figure P.N.20a
Left: Isolated-photon differential cross section measured in \PbPb collisions at \snnfive for the 50--90\% centrality class, for $R=0.2$ (scaled by a factor 10) and $R=0.4$ (not scaled). Error bars and boxes are the statistical and systematic uncertainties, respectively. The bands correspond to NLO pQCD calculations with JETPHOX, for \PbPb collisions calculated for the 0--100\% centrality class but scaled by \Ncoll. Right: Ratio of data over JETPHOX NLO pQCD calculations for $R=0.2$ (top) and $R=0.4$ (bottom). The bands centred at unity correspond to the JETPHOX NLO pQCD calculation uncertainties. The normalisation uncertainty of 2\% is not included in the left panel but it is shown as a grey box in the right of each frame around unity. | 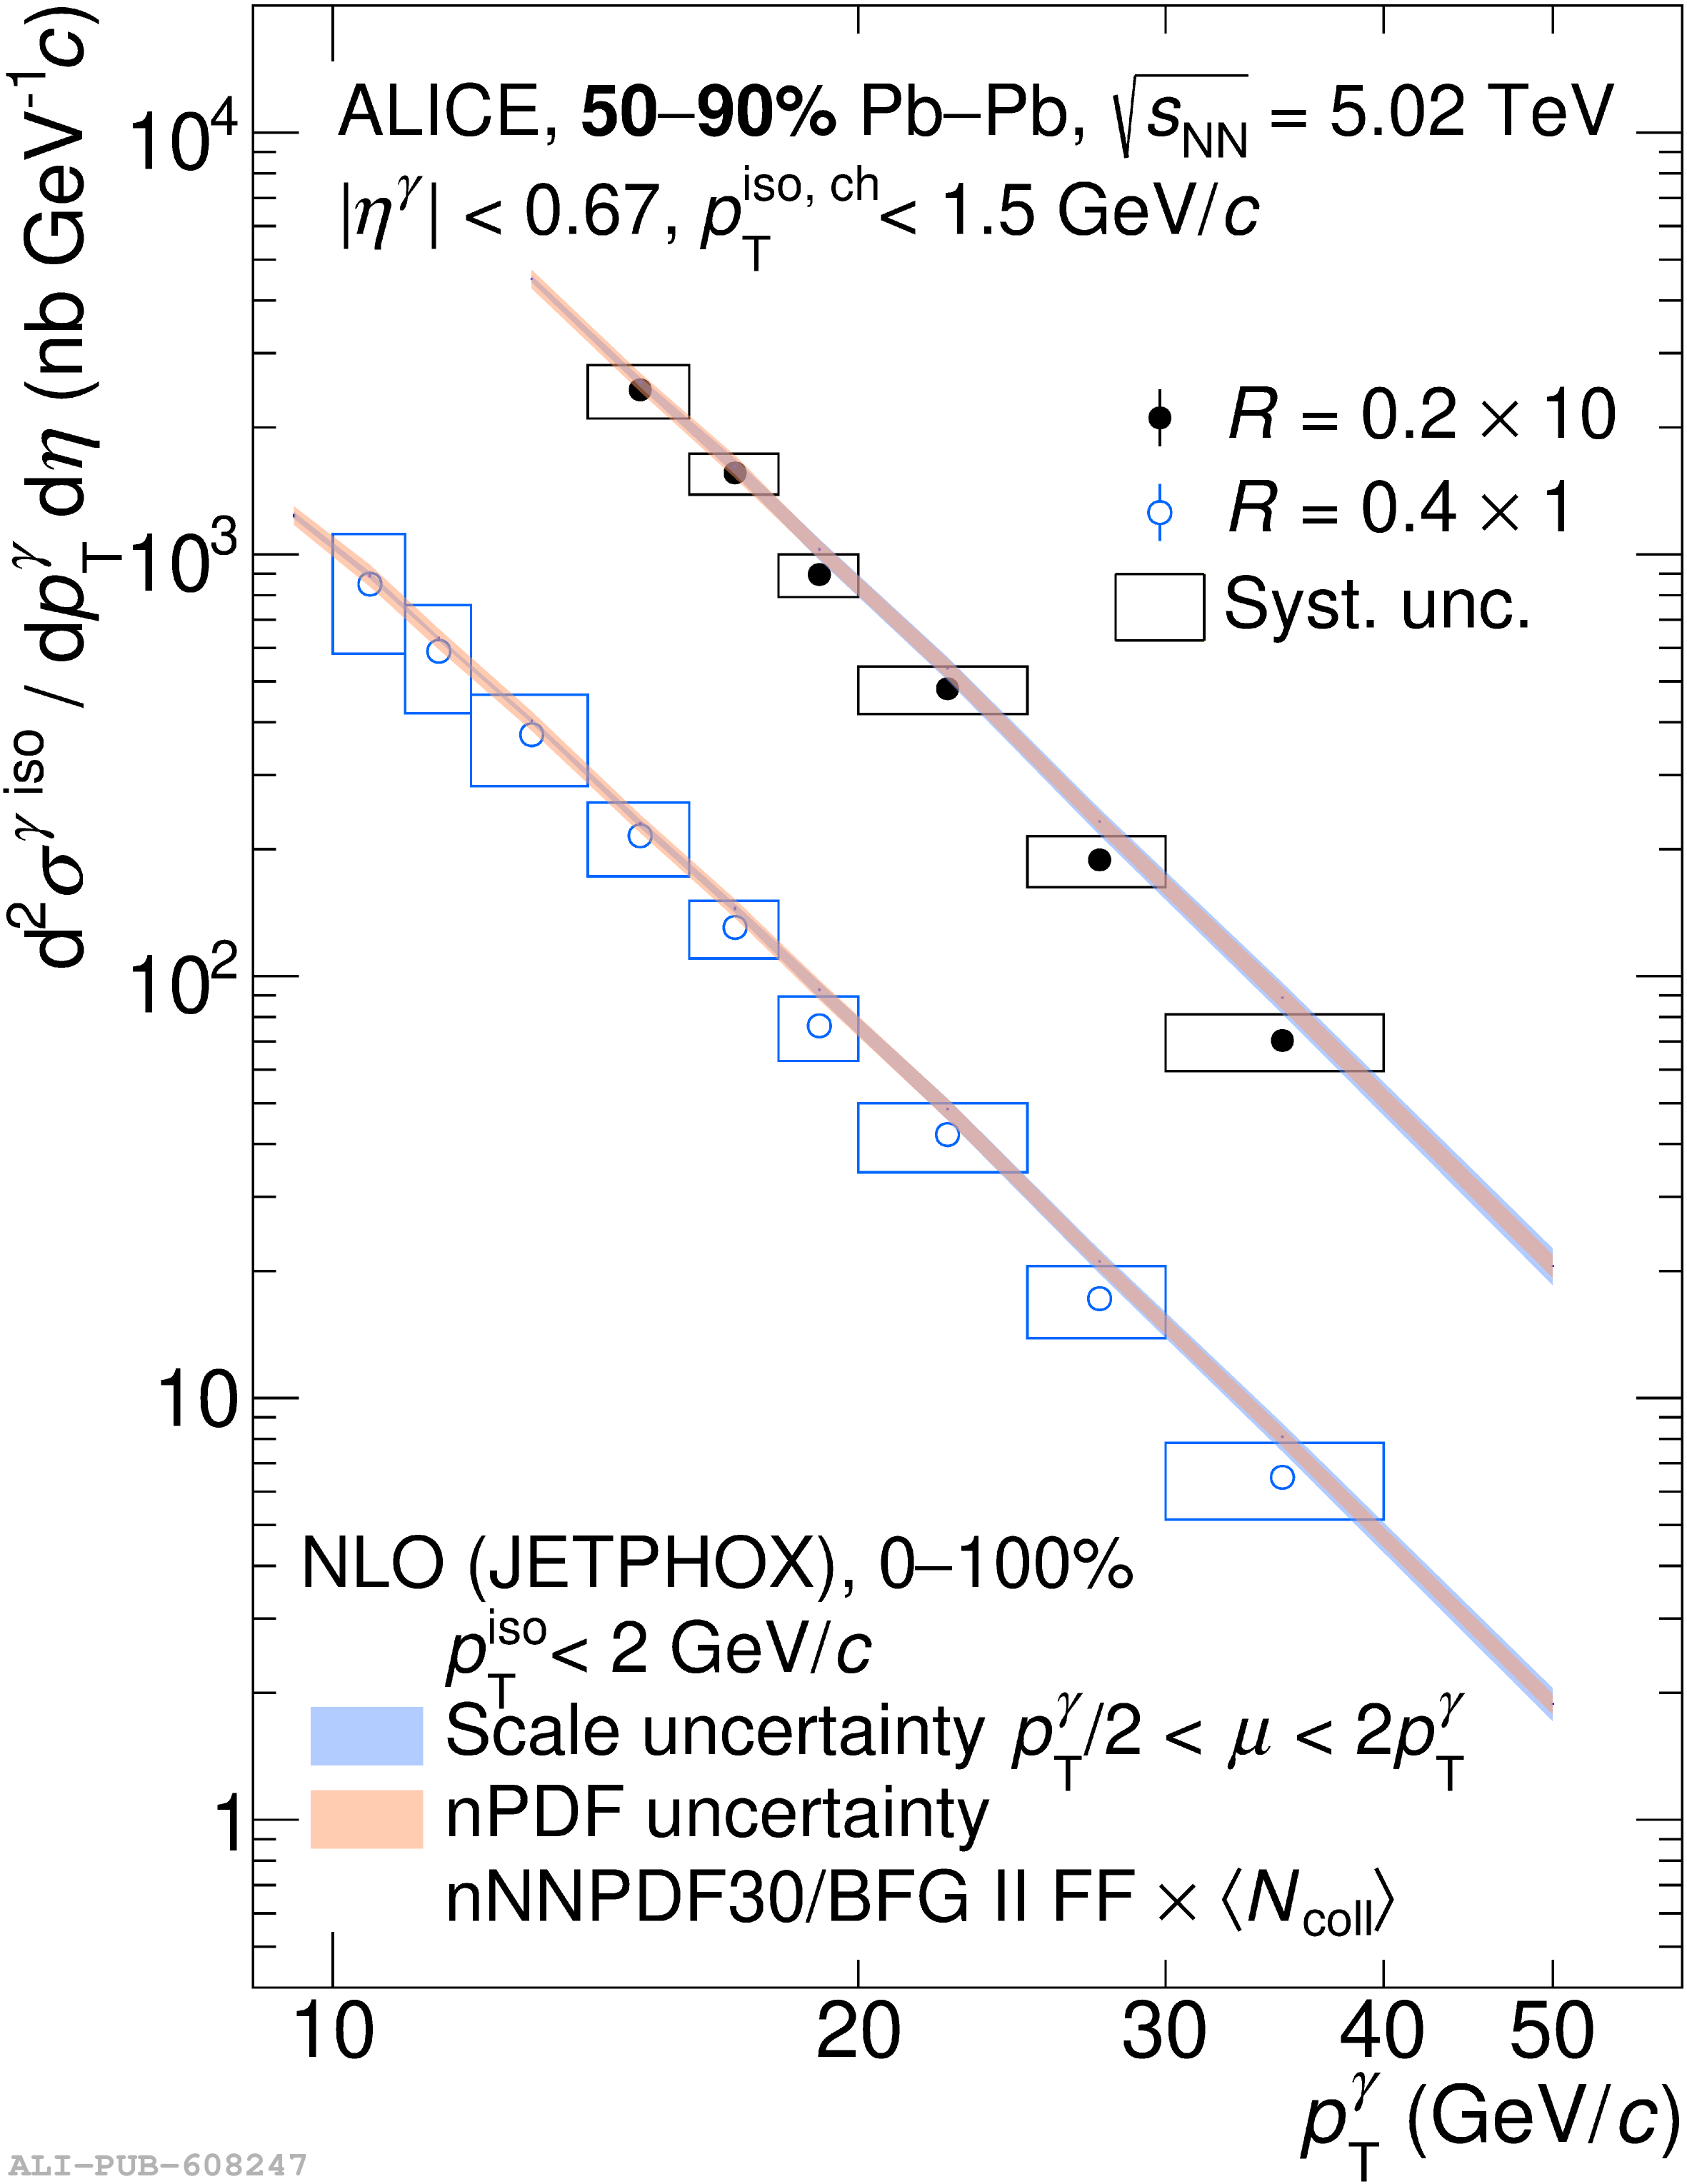 |
Figure P.N.20b
Left: Isolated-photon differential cross section measured in \PbPb collisions at \snnfive for the 50--90\% centrality class, for $R=0.2$ (scaled by a factor 10) and $R=0.4$ (not scaled). Error bars and boxes are the statistical and systematic uncertainties, respectively. The bands correspond to NLO pQCD calculations with JETPHOX, for \PbPb collisions calculated for the 0--100\% centrality class but scaled by \Ncoll. Right: Ratio of data over JETPHOX NLO pQCD calculations for $R=0.2$ (top) and $R=0.4$ (bottom). The bands centred at unity correspond to the JETPHOX NLO pQCD calculation uncertainties. The normalisation uncertainty of 2\% is not included in the left panel but it is shown as a grey box in the right of each frame around unity. | 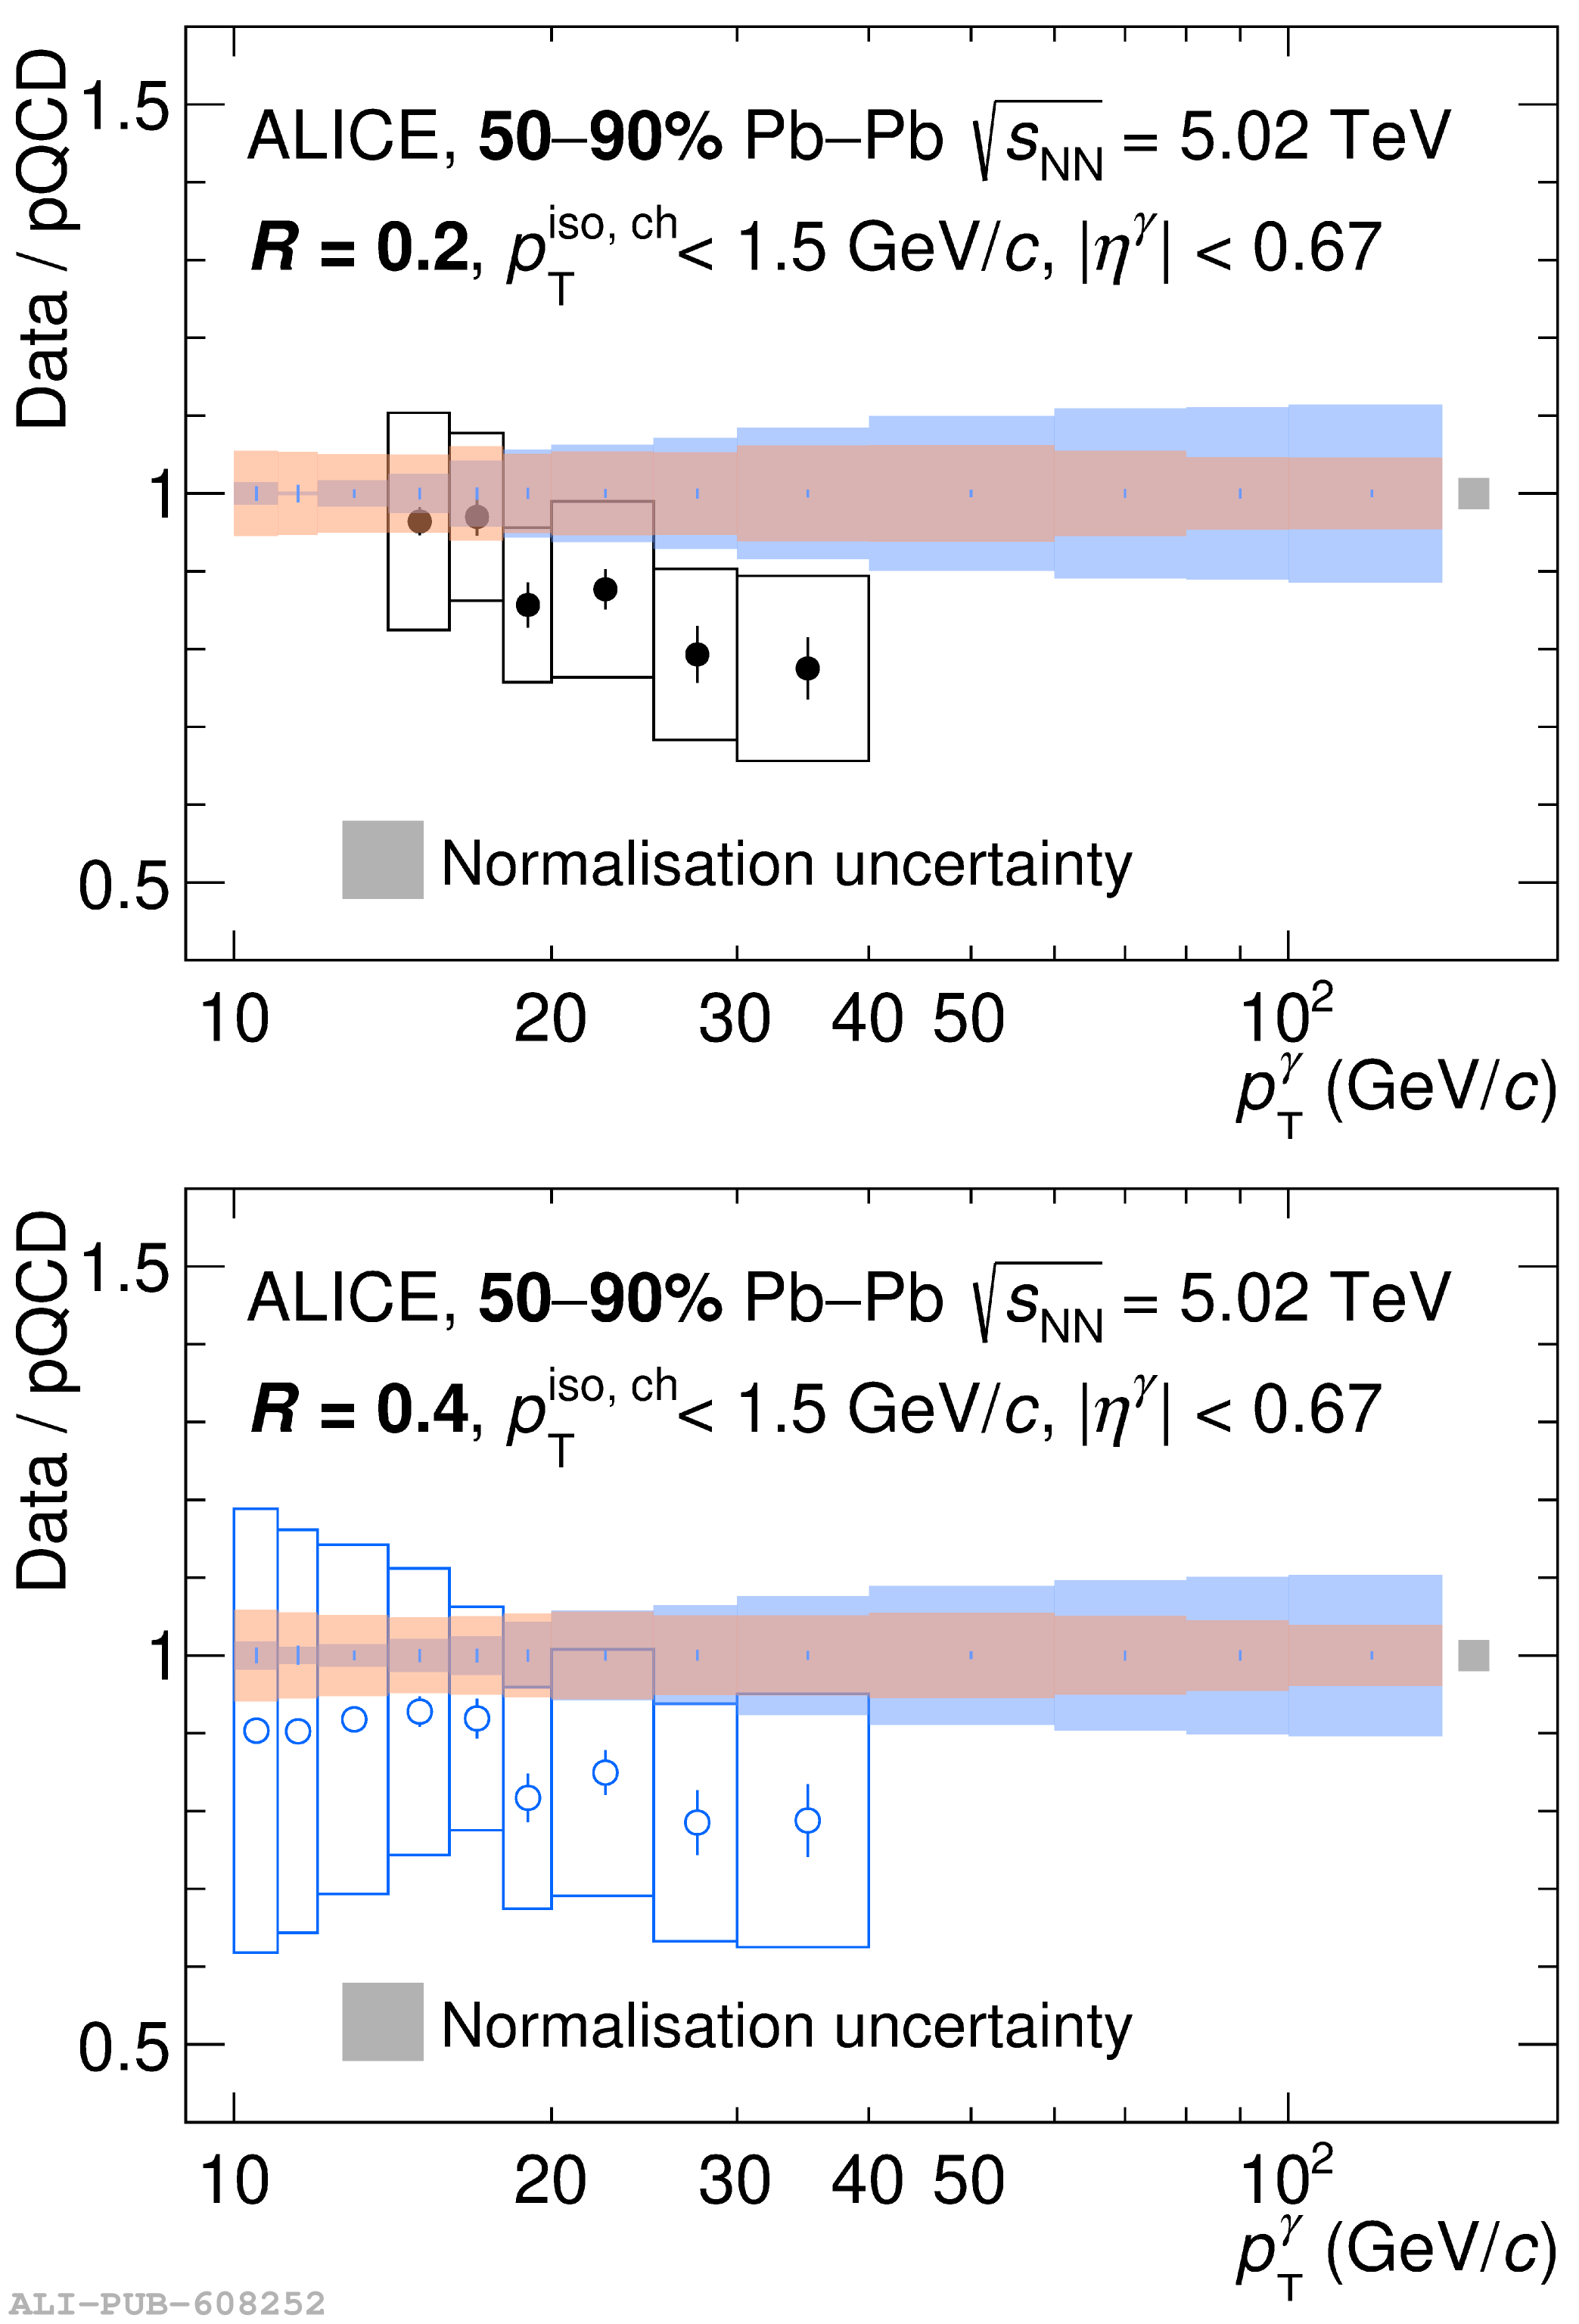 |
Figure P.N.21
\ Ratio of isolated-photon \ptg-differential cross sections measured with $R=0.4$ over $R=0.2$, $f_{R(\frac{0.4}{0.2})}$, for \PbPb collisions at \snnfive and for the 50--90\% centrality class. Error bars and boxes are the statistical and systematic uncertainties, respectively. The pink band corresponds to pQCD calculations with JETPHOX, the width represents the PDF uncertainty, and the blue vertical bars indicate the statistical uncertainty of the calculations. | 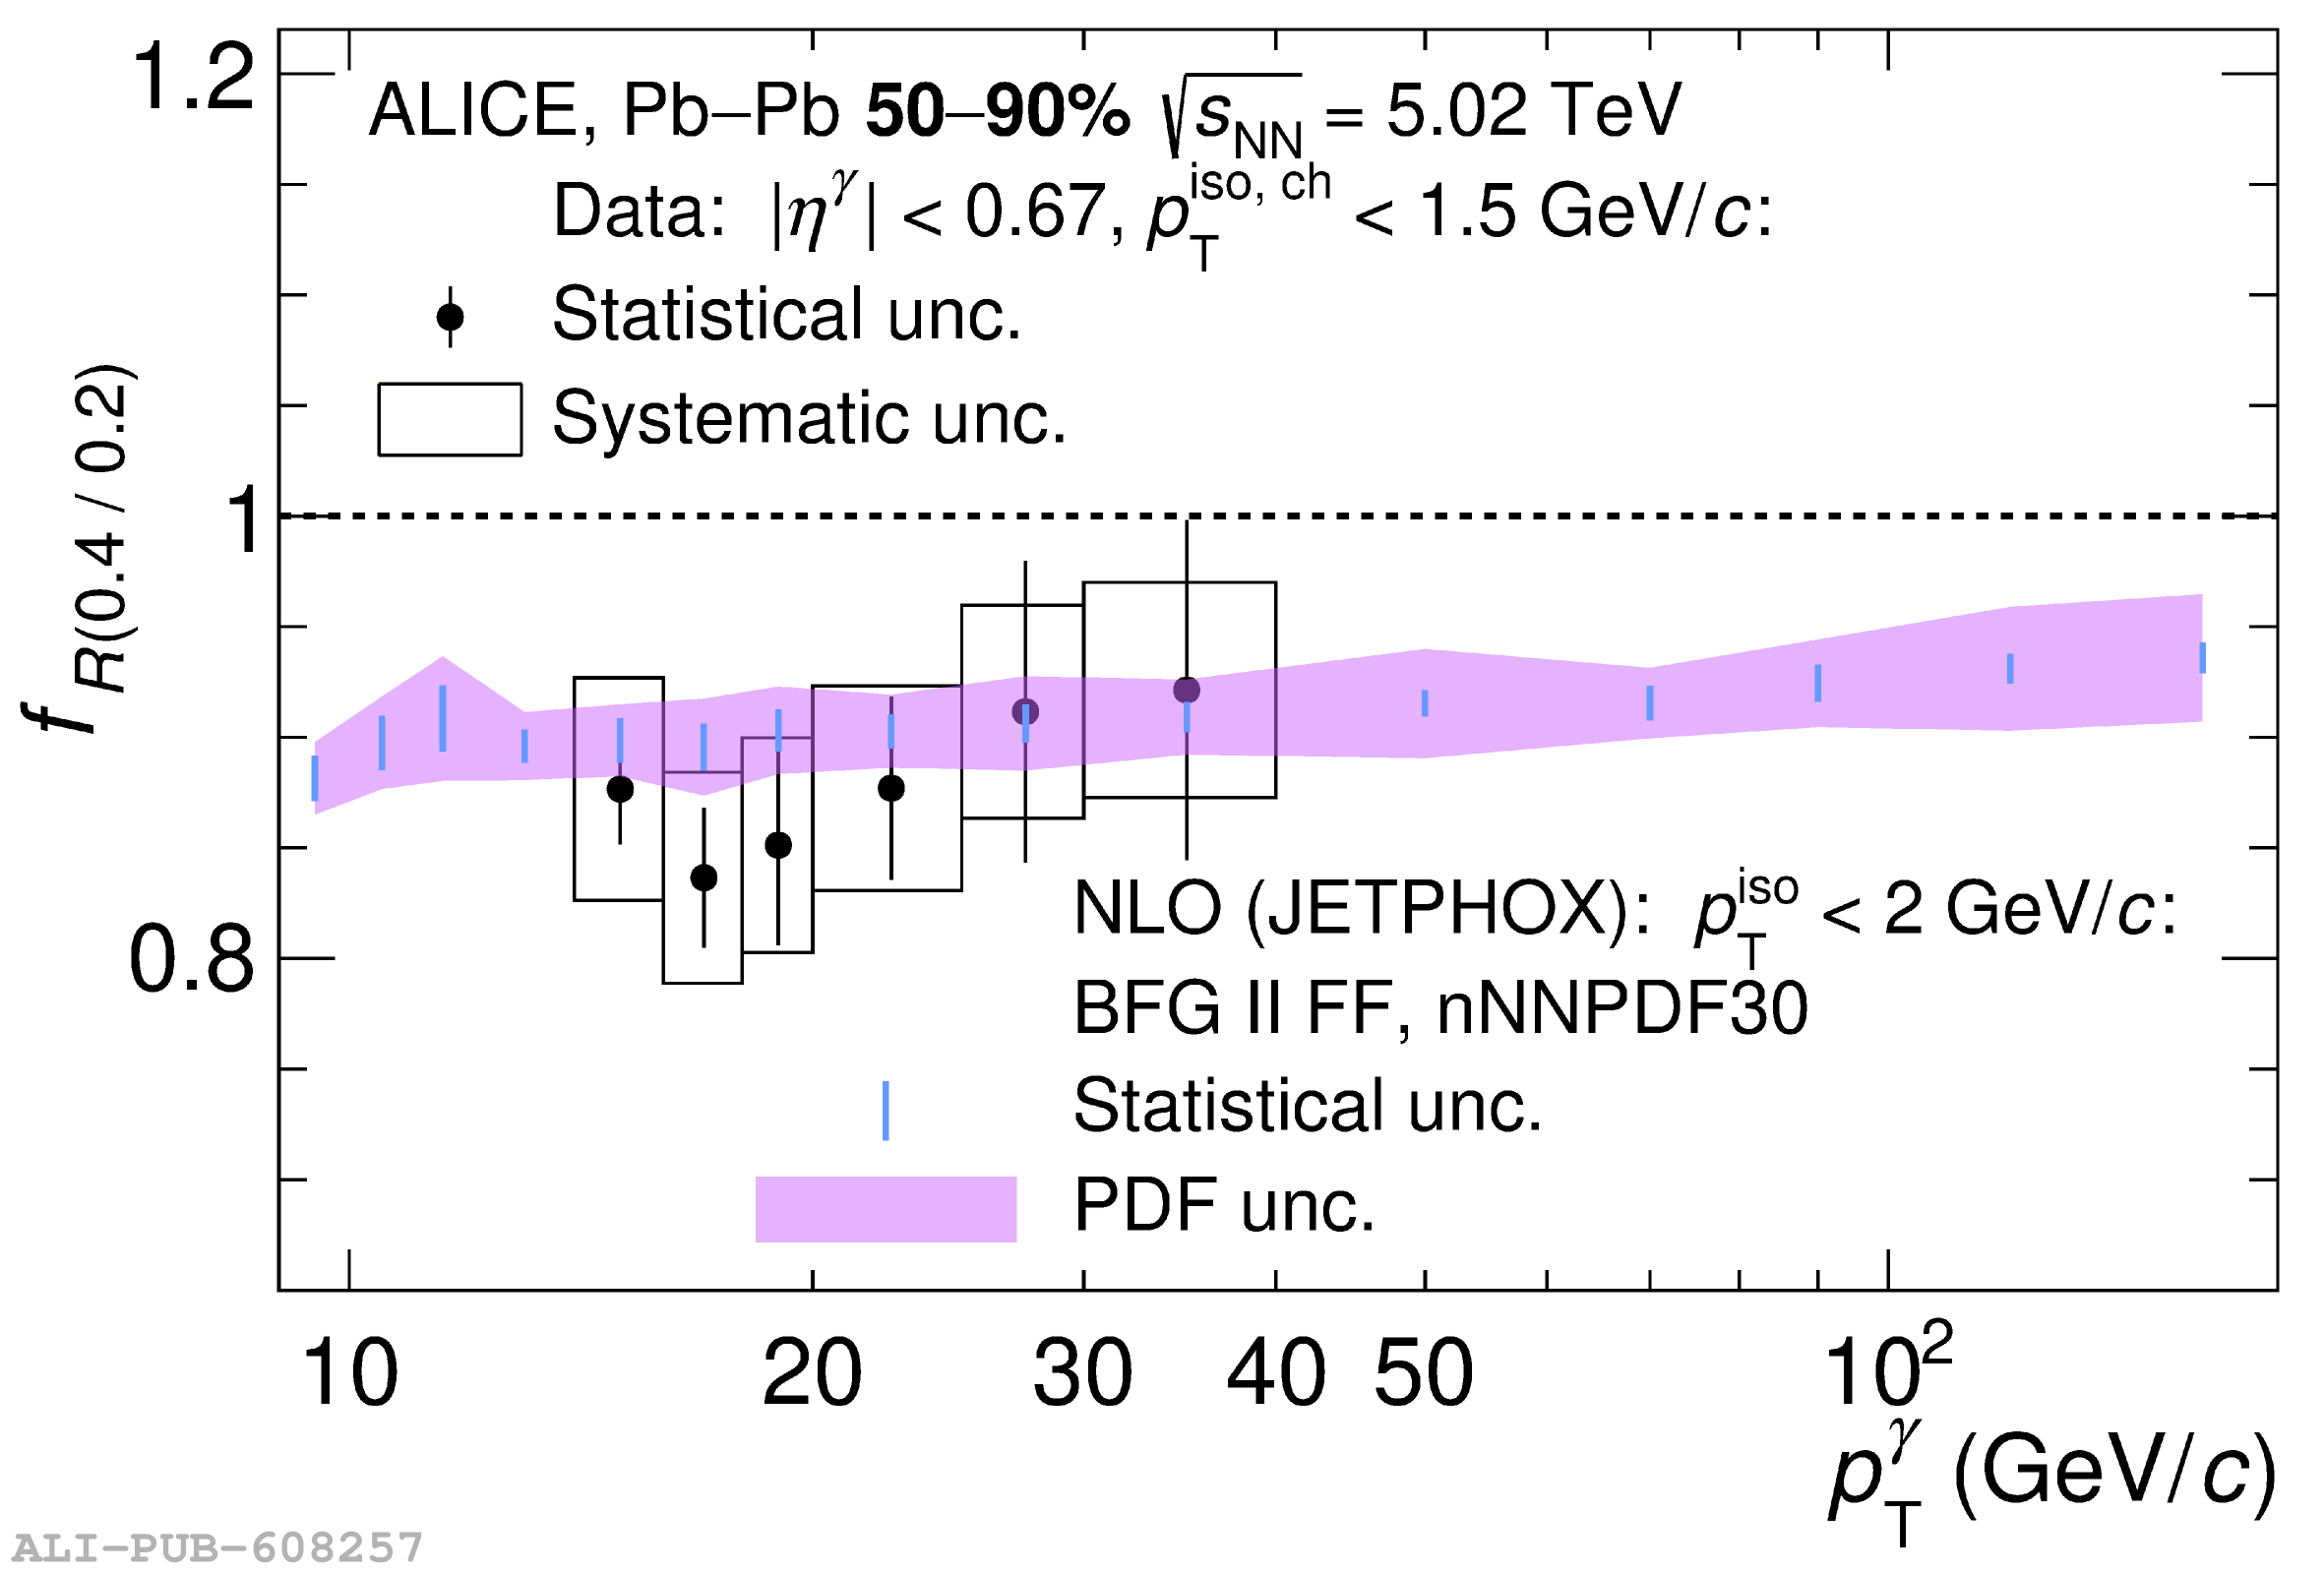 |
Figure P.N.22
\ Nuclear modification factor \raa for isolated photons at \snnfive for the 50--90\% centrality class, and for isolation-cone radii $R=0.2$ (black) and $R=0.4$ (blue). In data, the denominator is replaced by the \pp collisions NLO pQCD calculation with JETPHOX Error bars and boxes are the statistical and systematic uncertainties, respectively. The bands correspond to pQCD calculations with JETPHOX for \PbPb collisions (nPDF) for 0--100\% centrality over pp collisions (PDF). The pQCD band ratio is shown only for $R=0.2$ (similar to $R=0.4$) The width of each band corresponds to the scale and PDF uncertainties The normalisation uncertainties are represented as a red box centred at unity The solid line in the most peripheral centrality class 70--90\% at \raa = 0.91 corresponds to the HG-PYTHIA model expectation . | 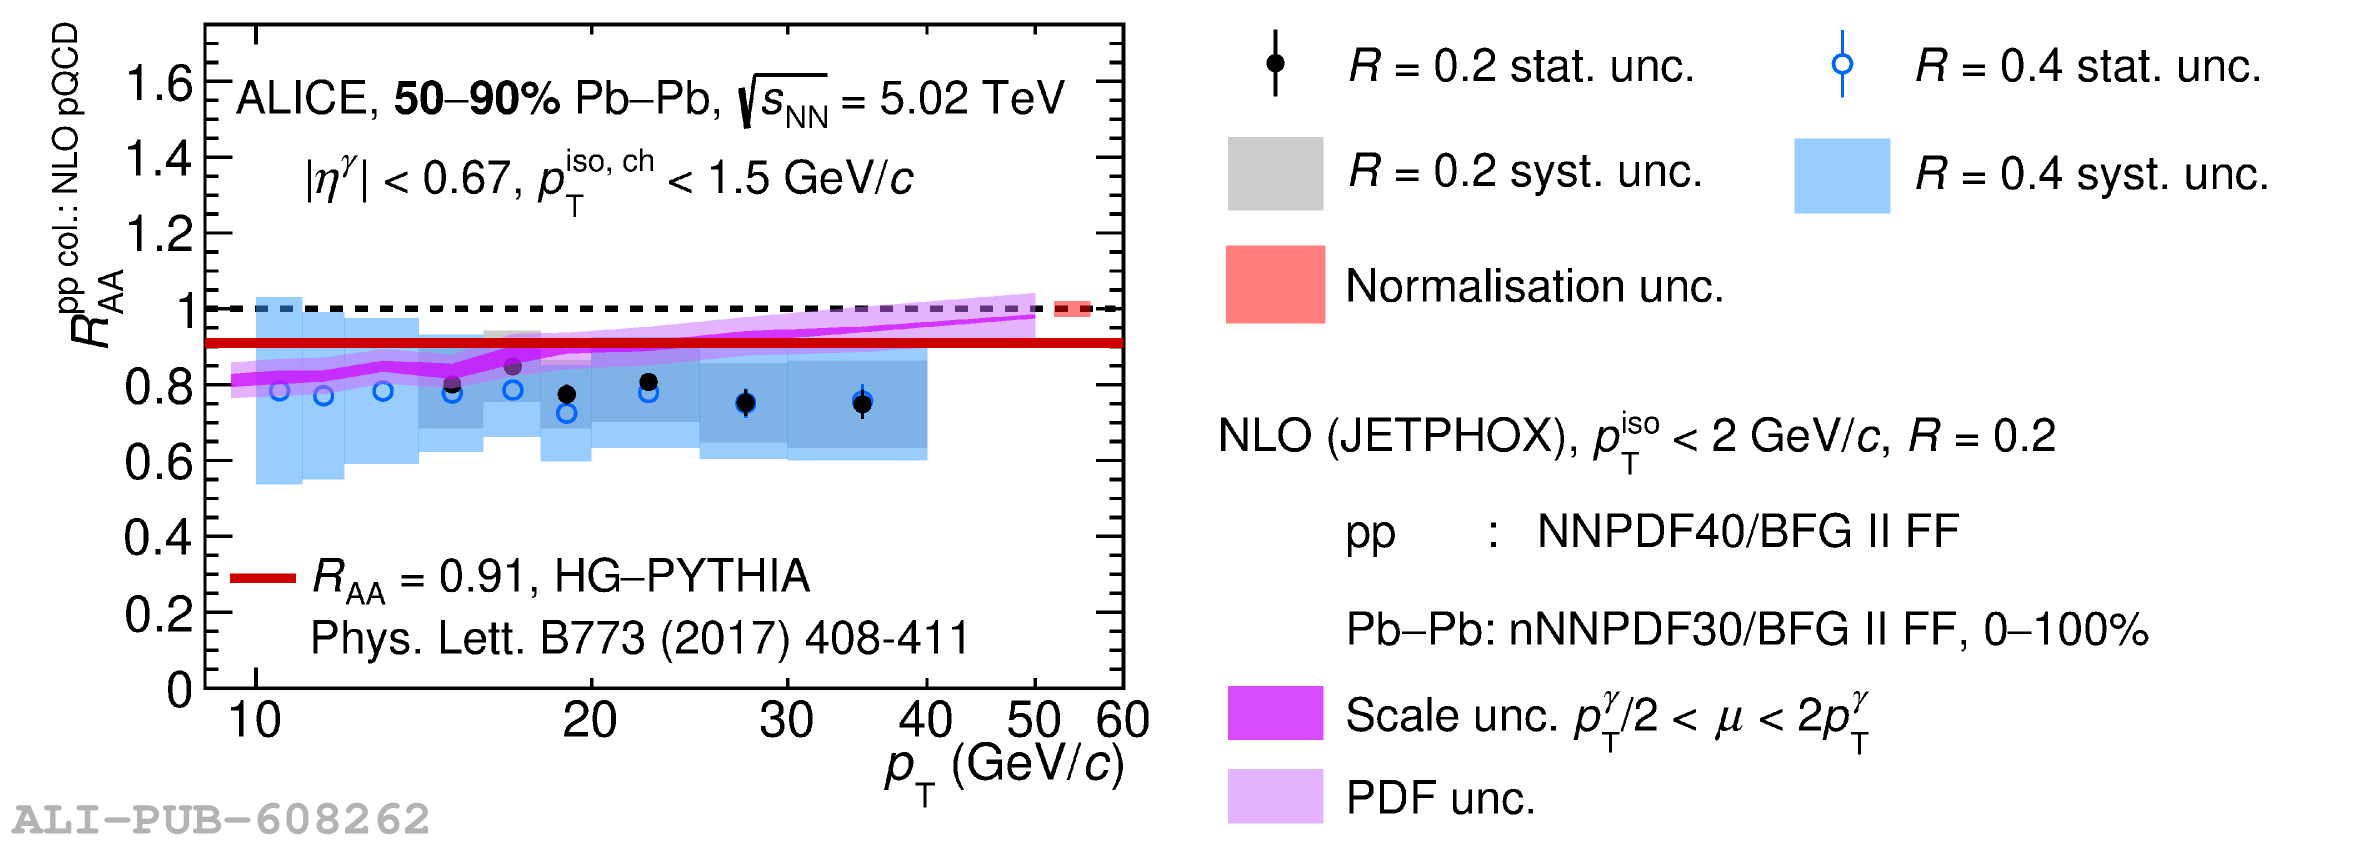 |
Figure P.N.23
\ Nuclear modification factor \raa for isolated photons measured by ALICE and CMS for isolation-cone radius $R=0.4$ at \snnfive and for four centrality classes. Error bars and boxes are the statistical and systematic uncertainties, respectively. The solid line in the peripheral centrality class 50--90\% at \raa = 0.91 is the result of the HG-PYTHIA model . The ALICE normalisation uncertainties are represented as a red box centred at unity. For CMS, the normalisation uncertainties are displayed as a violet box for the integrated luminosity and a green box for the nuclear overlap function $\langle T_{\rm AA}\rangle=\Ncoll / \sigma_{\rm NN}^{\rm INEL}$ The bands correspond to pQCD calculations with JETPHOX for \PbPb collisions (nPDF) for 0--100\% centrality over pp collisions (PDF). The width of each band corresponds to the scale and PDF uncertainties. | 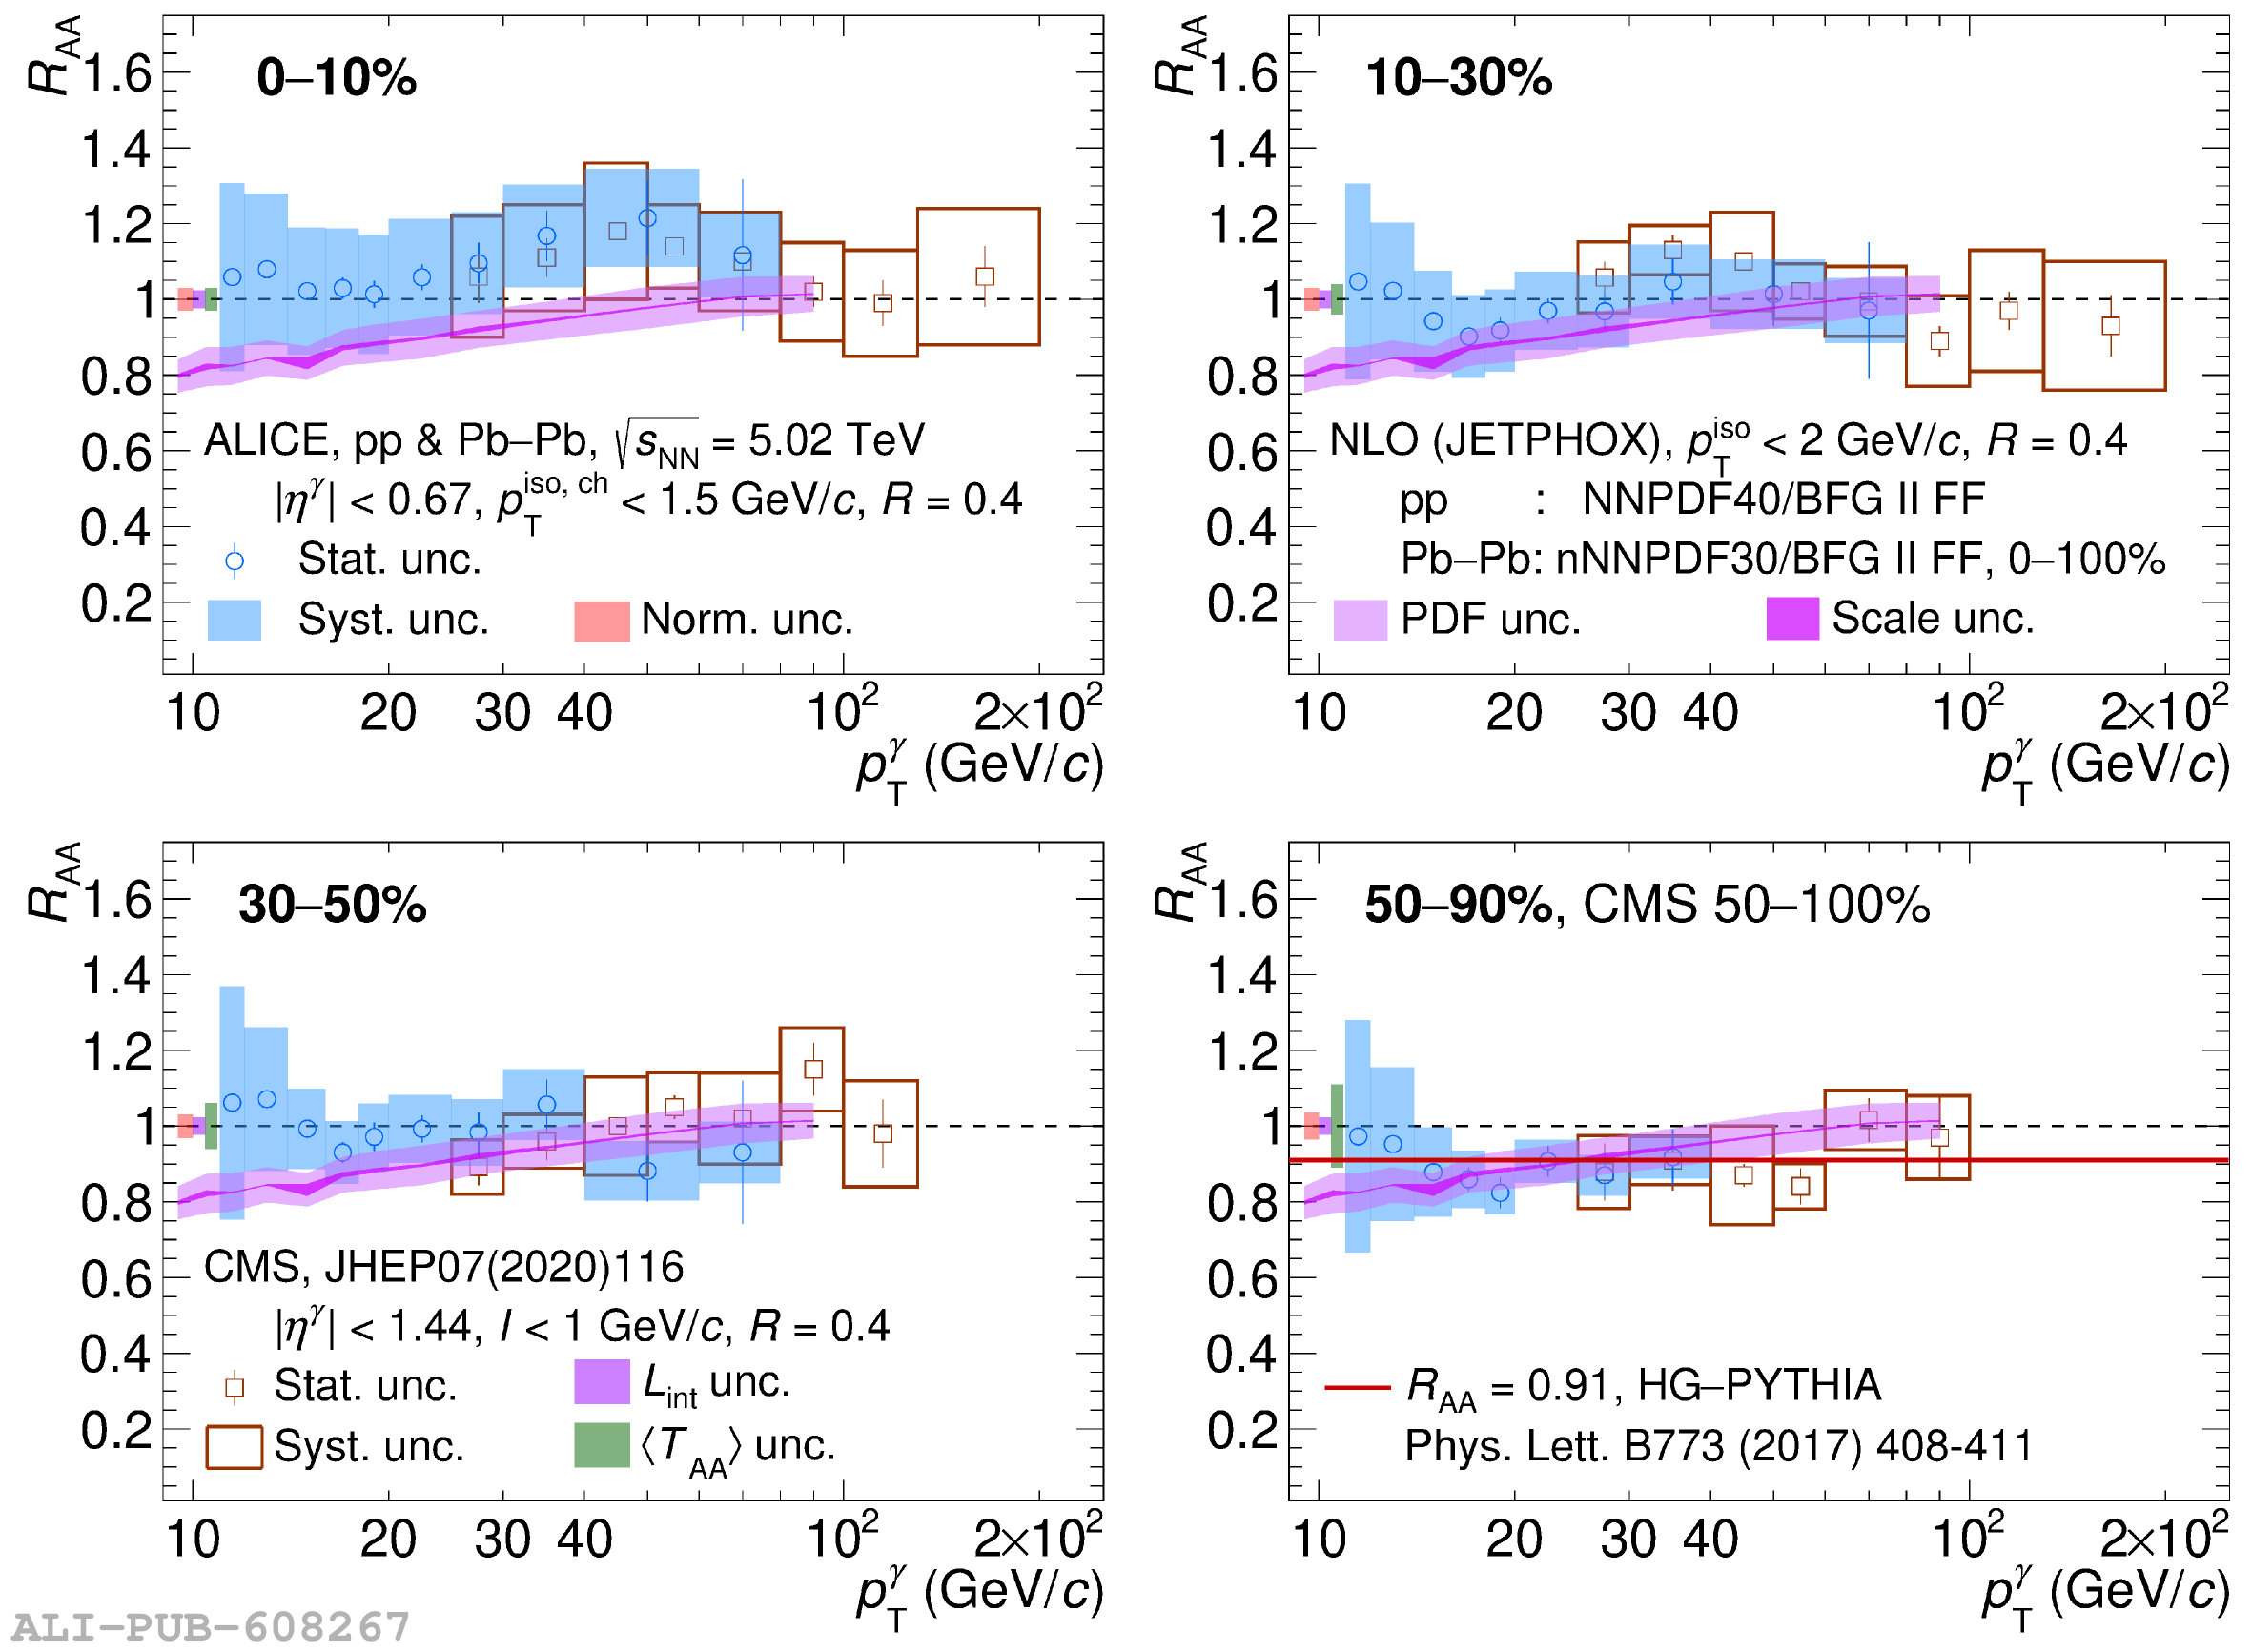 |
Figure P.N.24
\ Left: Cross section of isolated photons with $20\ptg25$ \GeVc for $R=0.2$ and 0.4 as a function of the centrality class or collision system, in \PbPb and \pp collisions at \snnfive from Figs. 12 and 13 of Ref. Also shown is the $p_{\rm T}^{\rm Z}$-integrated cross section of \zz bosons measured by CMS for \PbPb collisions at \snnfive and ATLAS for pp and \PbPb collisions at \snnfive. The 0--90\% centrality class for isolated photons is calculated as the \Ncoll weighted average of the other centrality classes. The dotted lines indicate the value of the 0--90\% centrality class centre for ALICE and CMS measurements and 0--100\% for the ATLAS \zz boson measurement, ``All Cen.'' interval in the figure. The last interval point in the figure is the measurement in pp collisions, only provided for ALICE isolated photons and ATLAS \zz bosons Right: \raa for isolated photons (from Fig. 16 of Ref. ) and ATLAS \zz bosons, and ratio of the CMS \zz boson cross sections in each centrality class to the one in the 0--90\% centrality class. The red solid line in peripheral centrality class 70--90\% at $\raa = 0.82$ corresponds to the expectation from the HG-PYTHIA model . In addition, the charged hadrons \raa\ in \PbPb and \pp collisions at \snnfive with $8\pt 20$ \GeVc measured by the ALICE Collaboration is shown for comparison. | 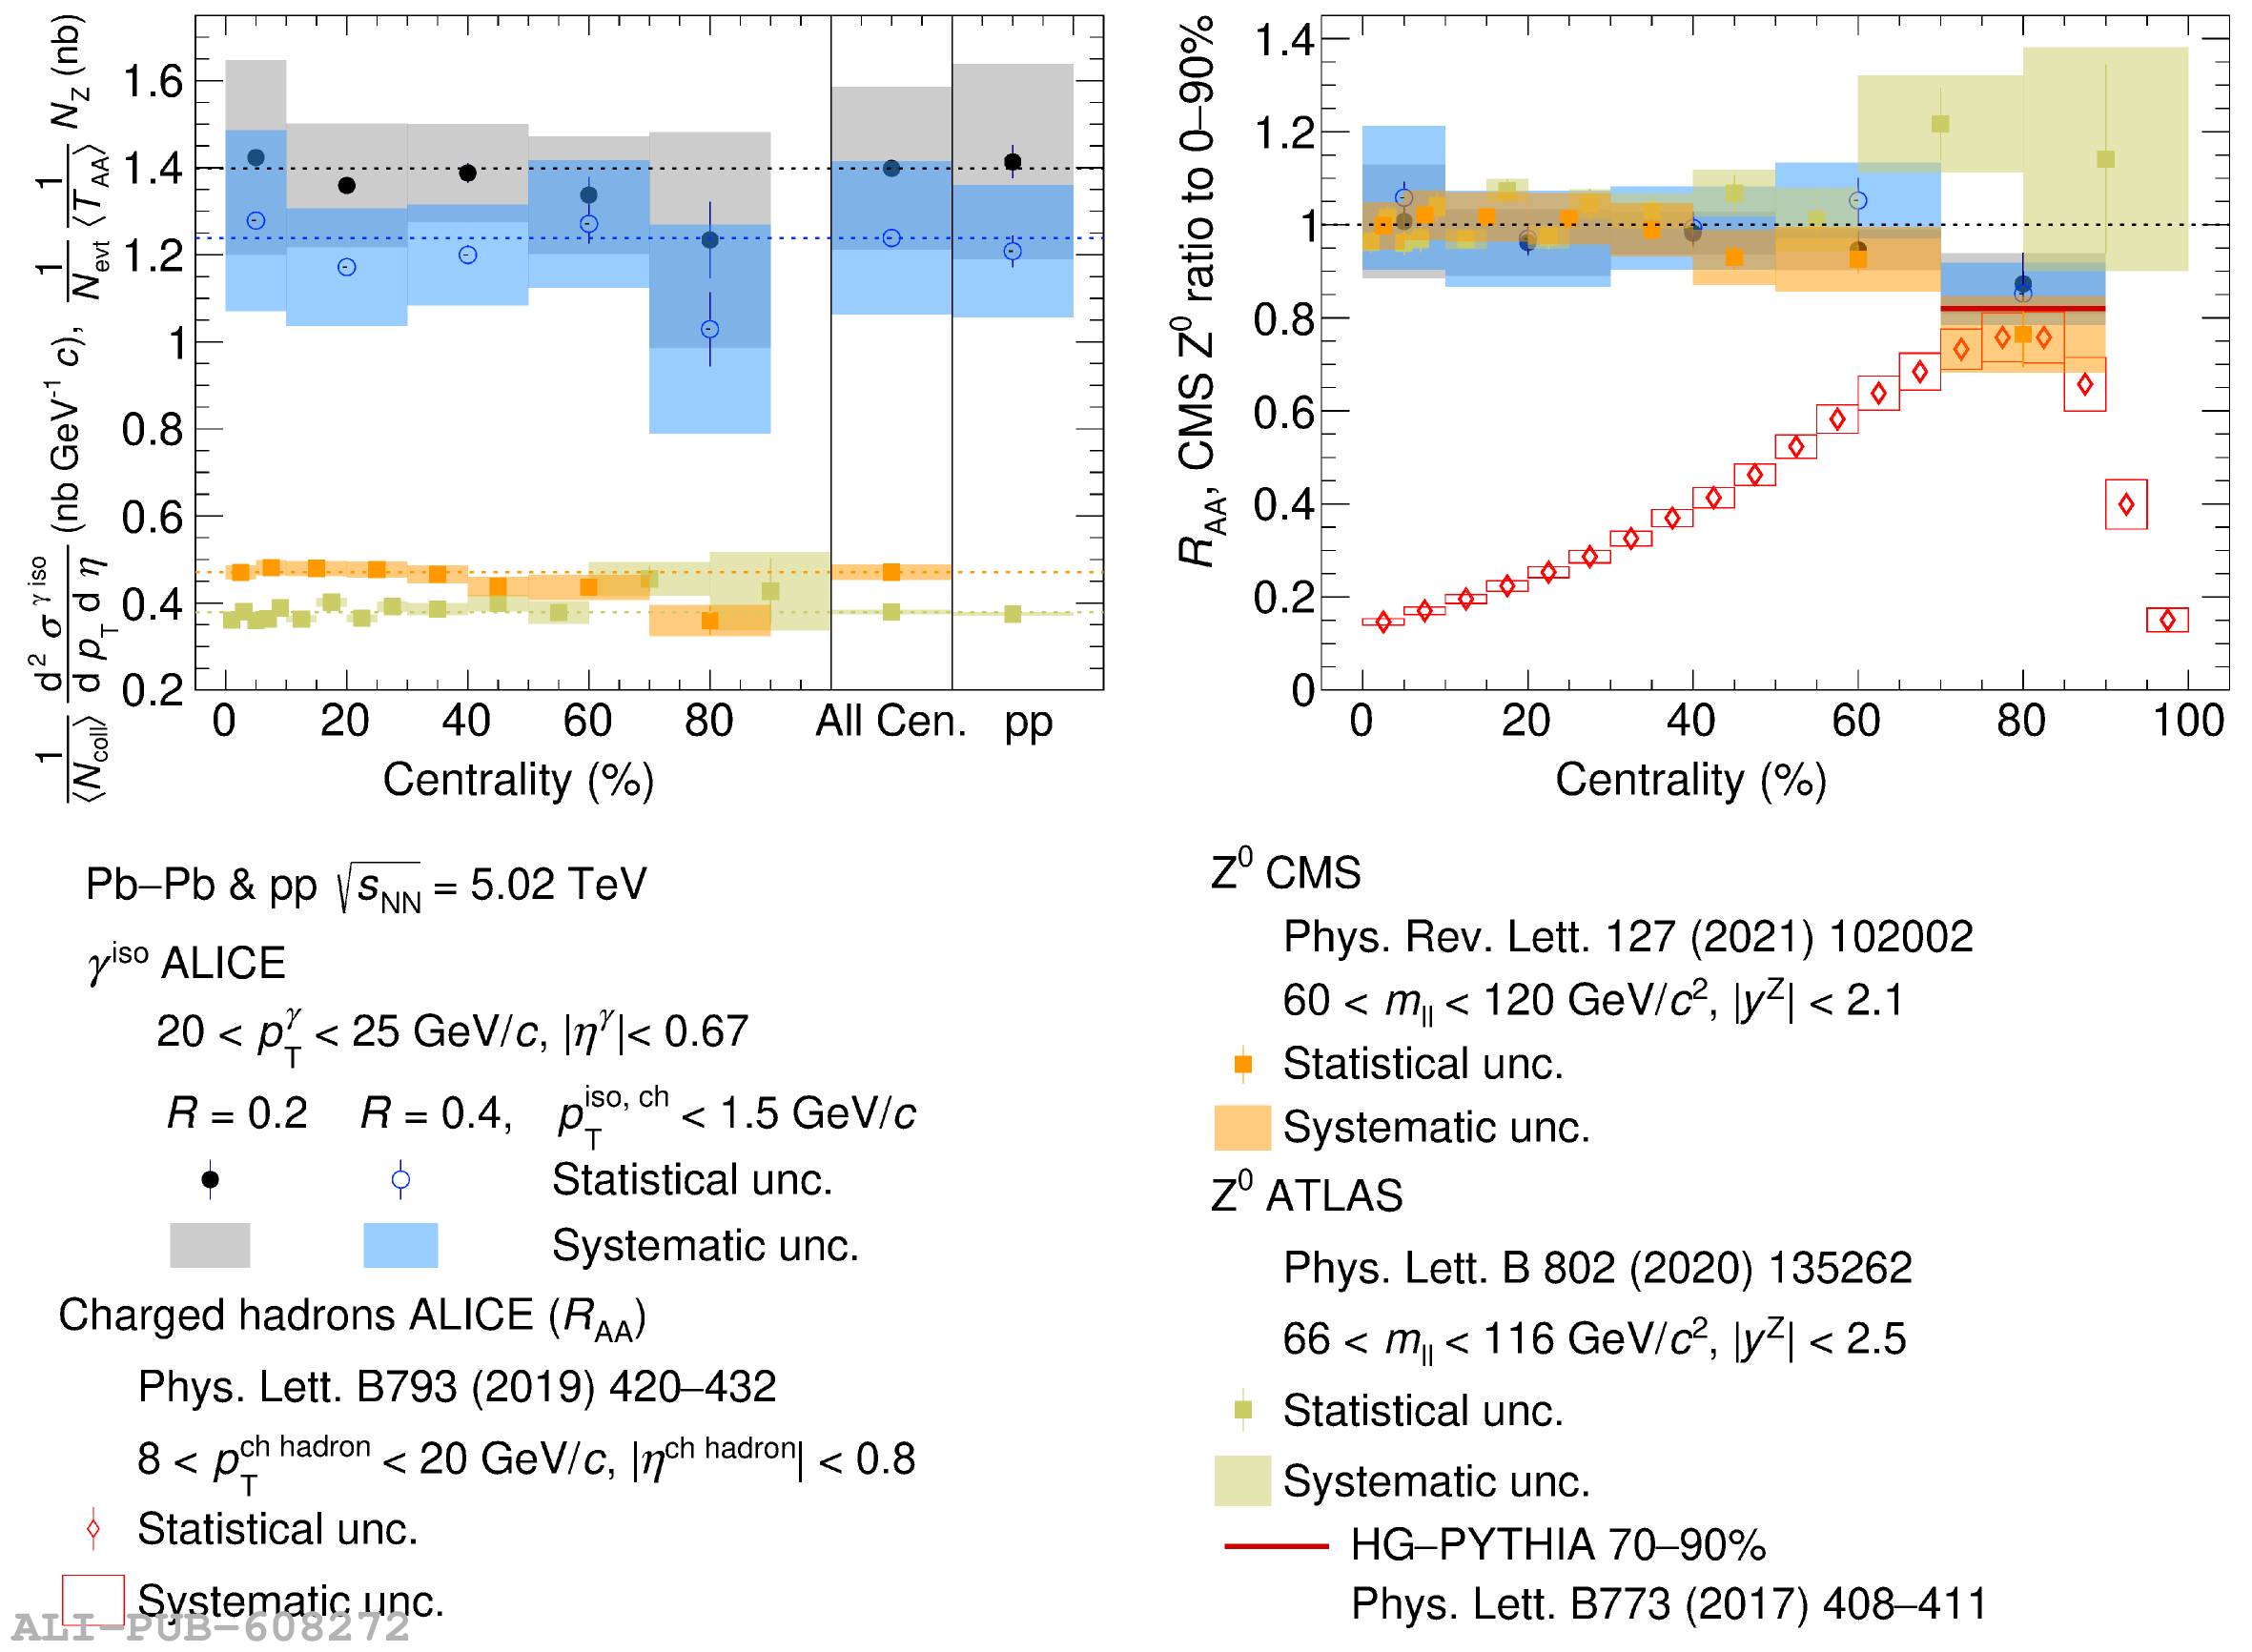 |