\ Fraction of inclusive clusters with $14\pt16$ \GeVc that pass the isolation selection as a function of the isolation momentum threshold for $R=0.2$ (left) and $R=0.4$ (right), for signal $\gamma$--jet MC narrow clusters ($0.1\sigmalongPb0.3$), and for data and background jet--jet MC (photon trigger with $\pt>3.5$ \GeVc in the calorimeter acceptance) wide clusters ($0.4\sigmalongPb2$). For \PbPb simulations, MC clusters are embedded into minimum bias \PbPb data. From top to bottom, 0--10\% \PbPb collisions, 30--50\% \PbPb collisions, 70--90\% \PbPb collisions and \pp collisions. Lower frame in each panel: ratio of the distribution for wide clusters in data and jet--jet MC over the distributions for $\gamma$--jet MC narrow clusters. Horizontal dashed line set at \ptIsoCh = 1.5 \GeVc. | 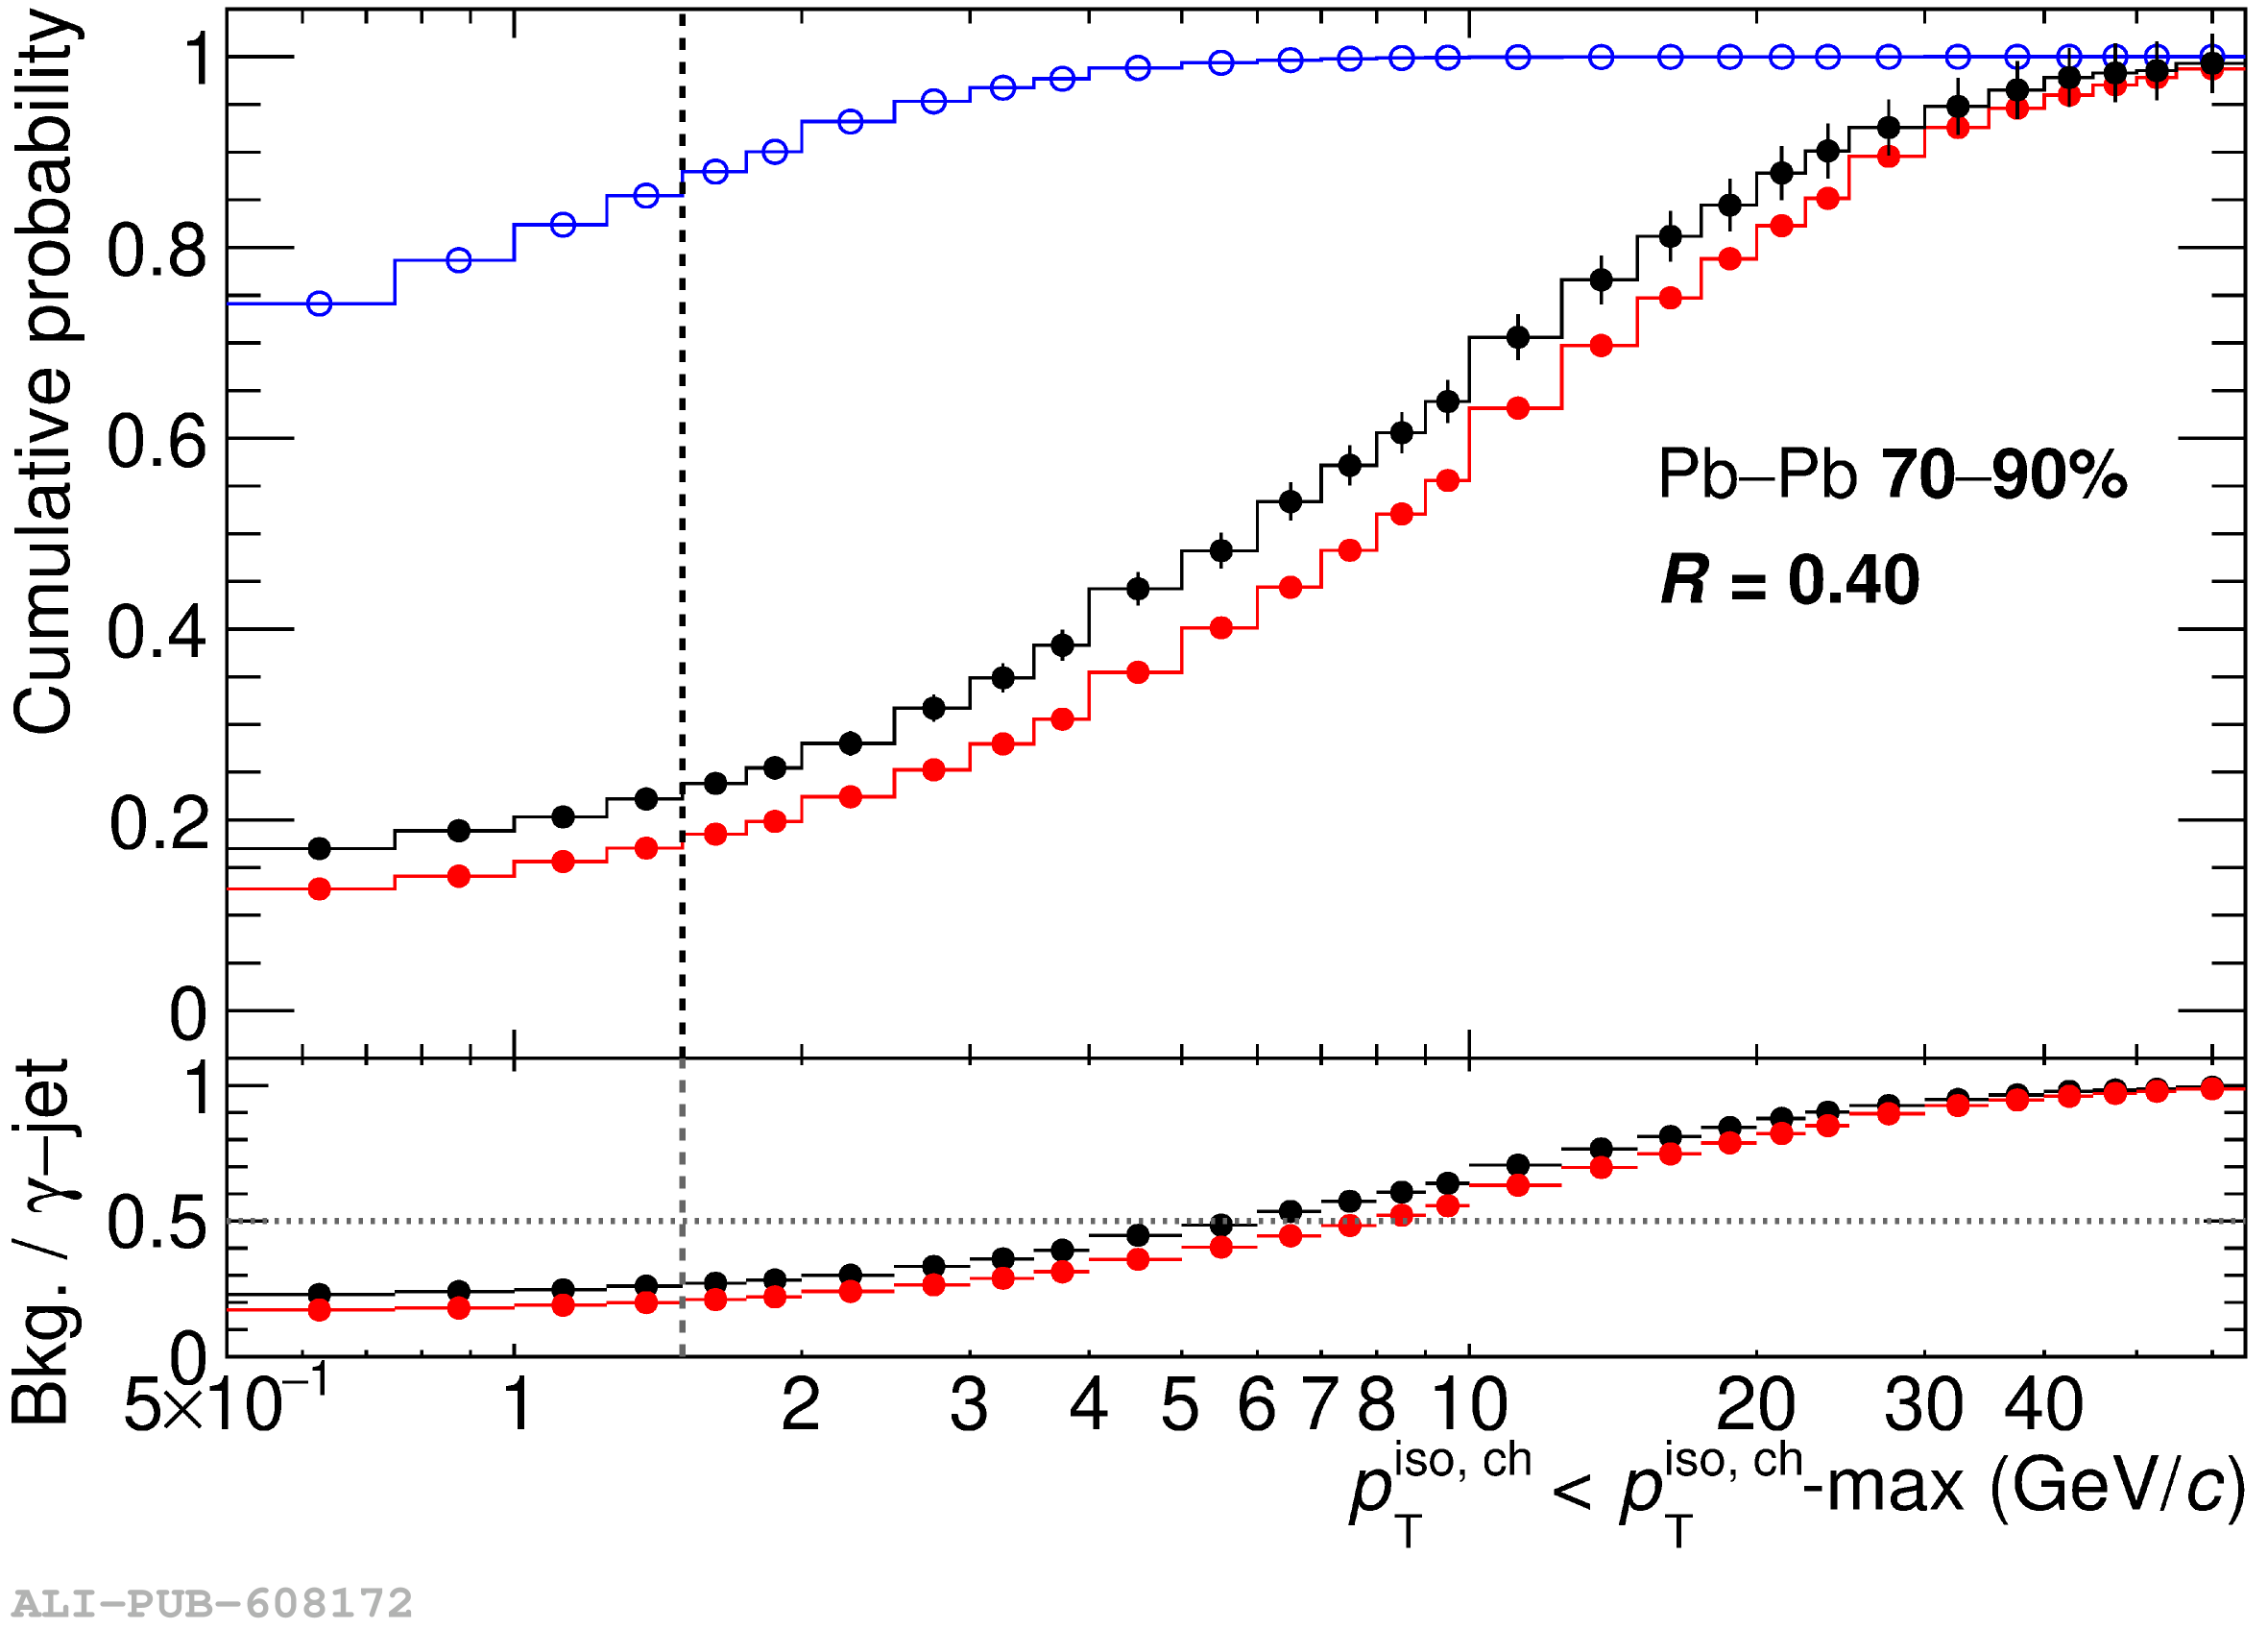 |