\ Inclusive-cluster \sigmalongPb\ distribution in data (black bullets) and PYTHIA 8 simulation (jet--jet + $\gamma$--jet processes). Three different treatments of cross talk (x-talk) are considered in the simulation: ``no x-talk'' (open red squares); ``x-talk high'' (open magenta squares), stronger cross talk obtained for the previous isolated-photon measurements ; and ``x-talk'' (open blue squares), obtained for this measurement. The four panels display these distributions for two selected cluster \pt\ ranges, $12\pt14$ \GeVc on the left and $40\pt60$ \GeVc on the right, and two collision systems: \pp (top) and \PbPb 0--10\% central (bottom). The simulation is also shown for signal prompt $\gamma$ ($\gamma^{\rm prompt}$) for the different x-talk cases (lines with the same colour code as for the full simulation) The narrow cluster range maximum value $\sigmalongPb = 0.3$ (tight) or 0.392 (loose, corresponding to $\sigma_{\rm max}^{2}$(13 \GeVc)) is shown on all plots as a dotted or dashed vertical line, respectively. | 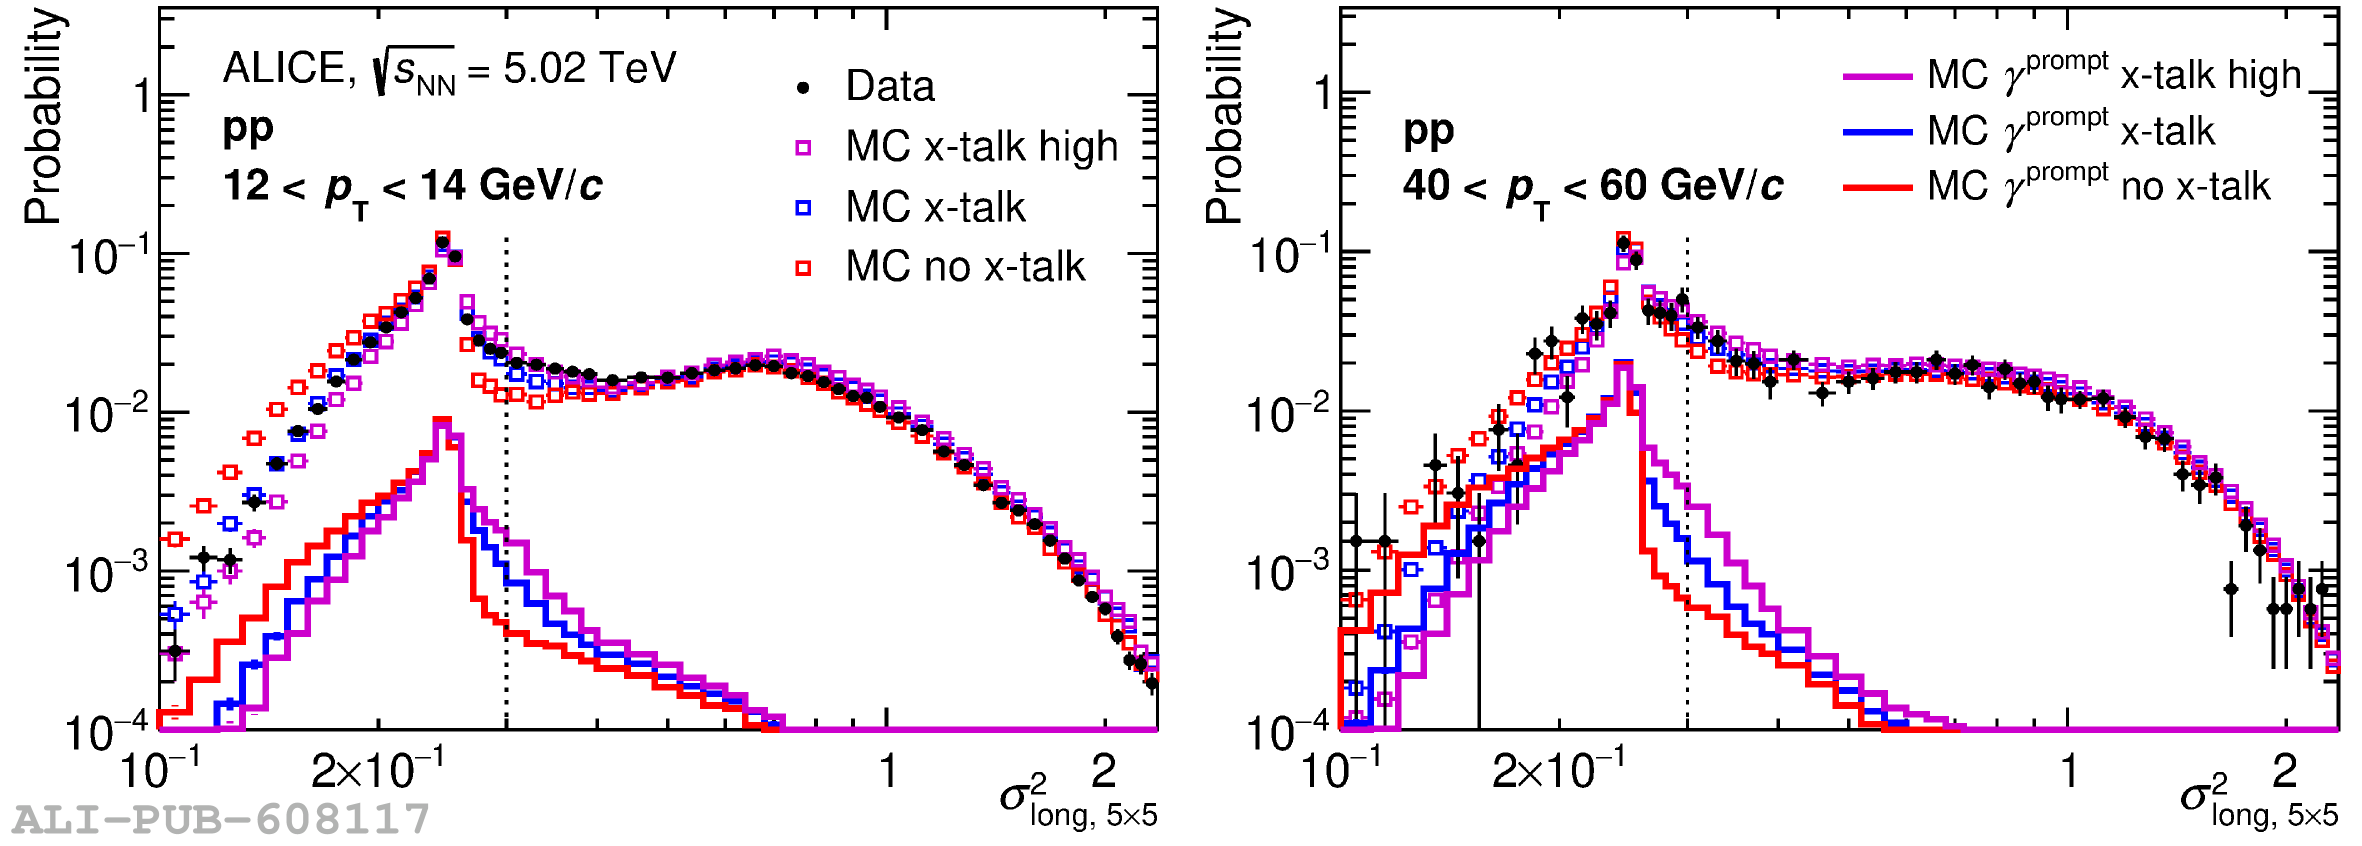 |