\ Illustration of the parametric space of the photon isolation momentum and the shower width parameter (\sigmalong), used to estimate the background yield in the signal class (\textcolor{blue}{$\mathbb{A}$}) from the observed yields in the three control classes (\textcolor{red}{$\mathbb{B}$}, \textcolor{red}{$\mathbb{C}$}, and \textcolor{red}{$\mathbb{D}$}). The red regions indicate areas dominated by the background, and the blue regions are those that contain the photon signal. The colour gradient between these regions illustrates the presence of a signal contribution in the three background regions. See Figs. \ref{fig:abcdIsoPhoton_Data_R02} and \ref{fig:abcdIsoPhoton_Data_R04} for examples of this in data. | 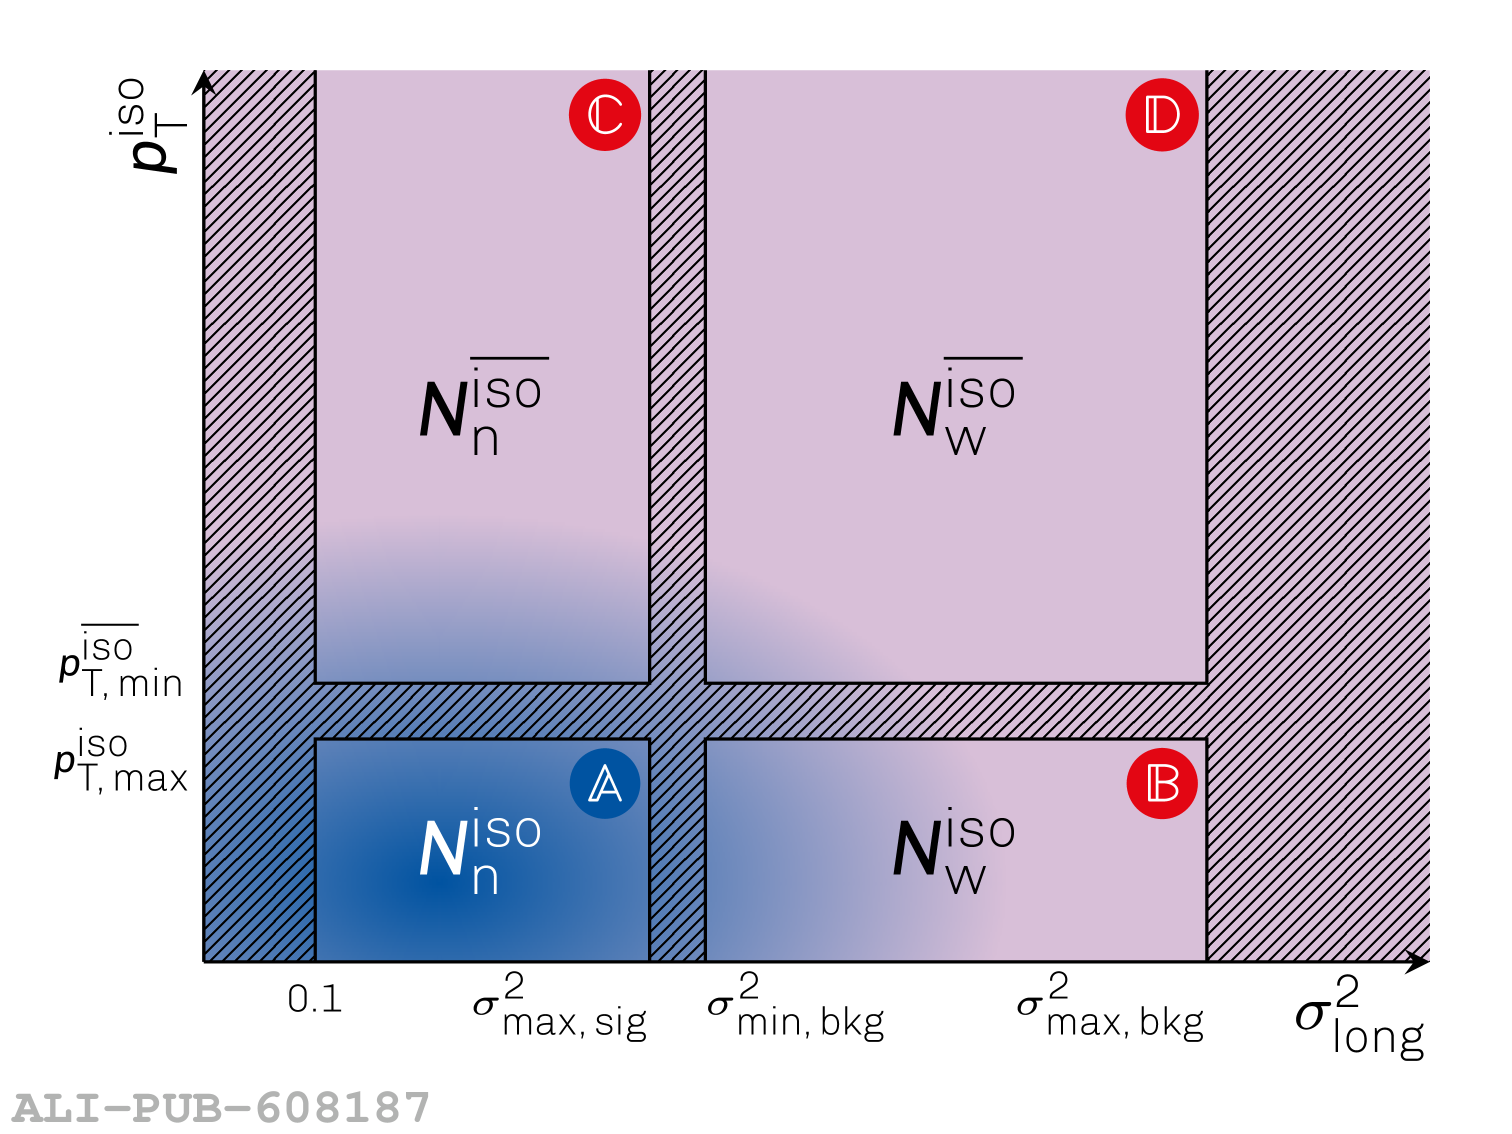 |