\ Nuclear modification factor \raa for isolated photons measured by ALICE and CMS for isolation-cone radius $R=0.4$ at \snnfive and for four centrality classes. Error bars and boxes are the statistical and systematic uncertainties, respectively. The solid line in the peripheral centrality class 50--90\% at \raa = 0.91 is the result of the HG-PYTHIA model . The ALICE normalisation uncertainties are represented as a red box centred at unity. For CMS, the normalisation uncertainties are displayed as a violet box for the integrated luminosity and a green box for the nuclear overlap function $\langle T_{\rm AA}\rangle=\Ncoll / \sigma_{\rm NN}^{\rm INEL}$ The bands correspond to pQCD calculations with JETPHOX for \PbPb collisions (nPDF) for 0--100\% centrality over pp collisions (PDF). The width of each band corresponds to the scale and PDF uncertainties. | 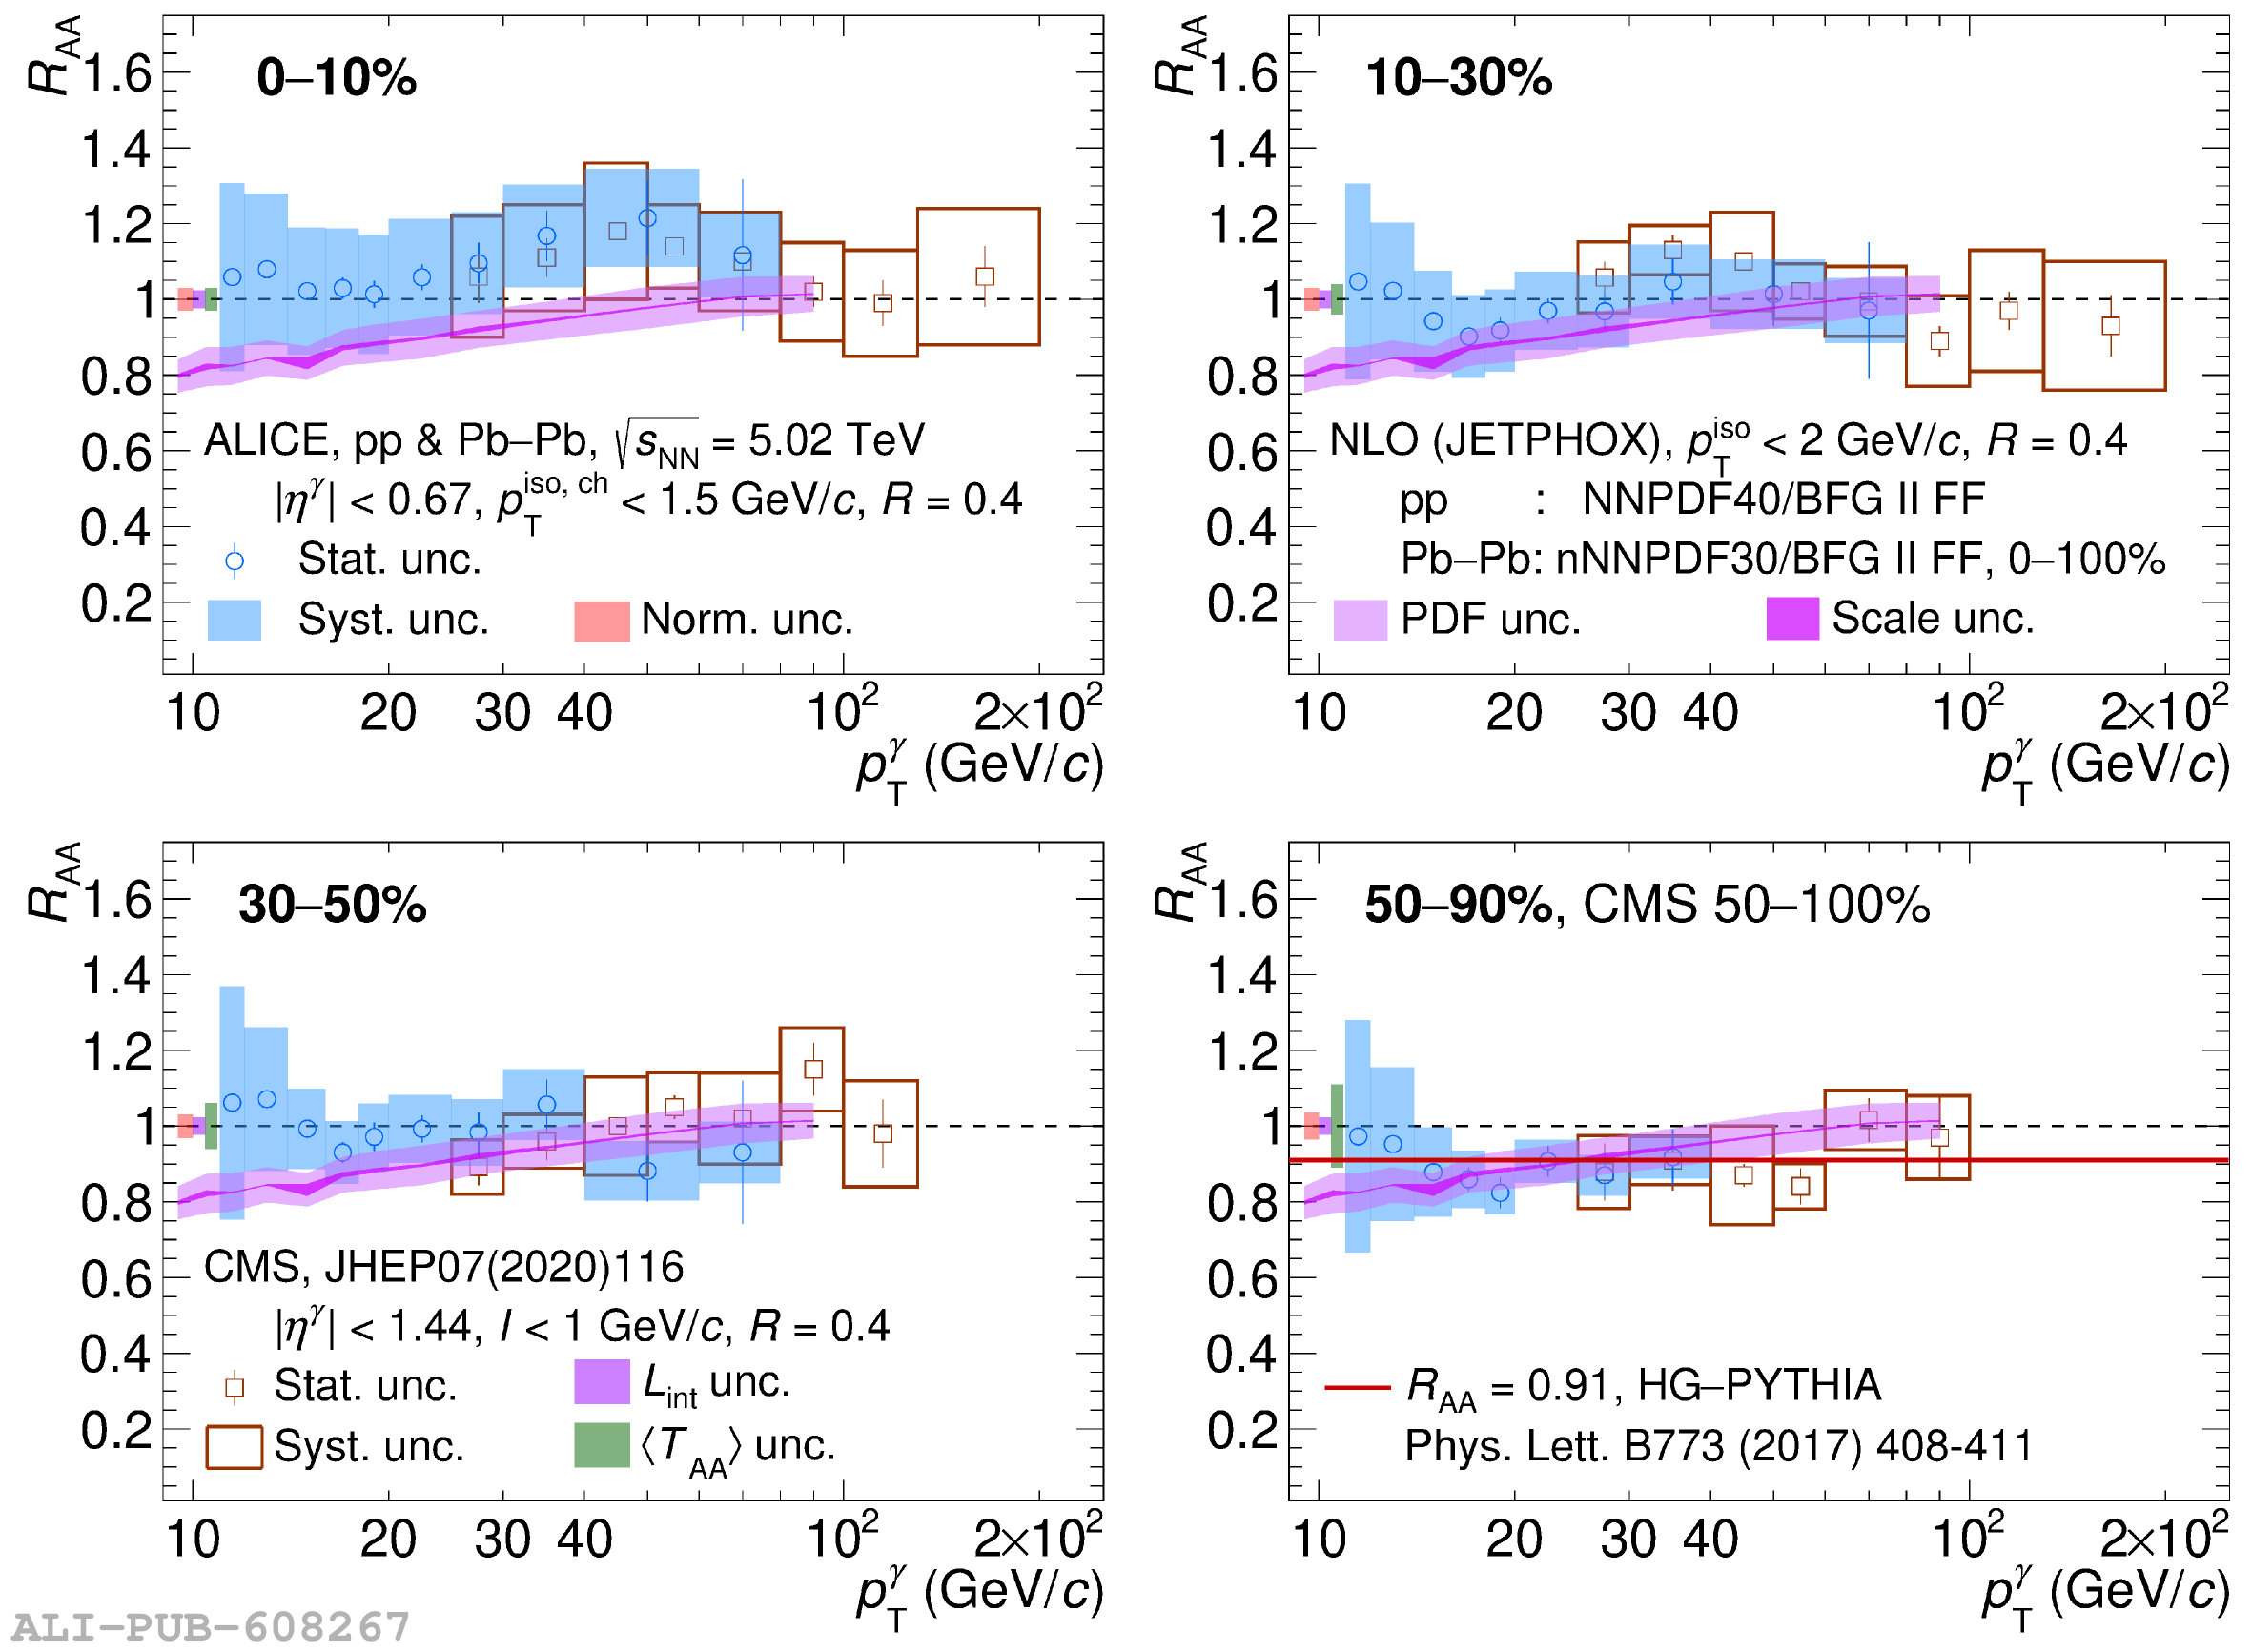 |