\ For each panel: Top, ratio of isolated and anti-isolated \sigmalongPb\ distribution in data and simulation; Bottom, the ratio of the two, $f$(\sigmalongPb). Top row for $12\pt14$ \GeVc and bottom row for $30\pt40$ \GeVc. Each row reports results for 0--10\% (left) and 30--50\% (middle) \PbPb collisions and \pp collisions (right) for $R=0.2$. | 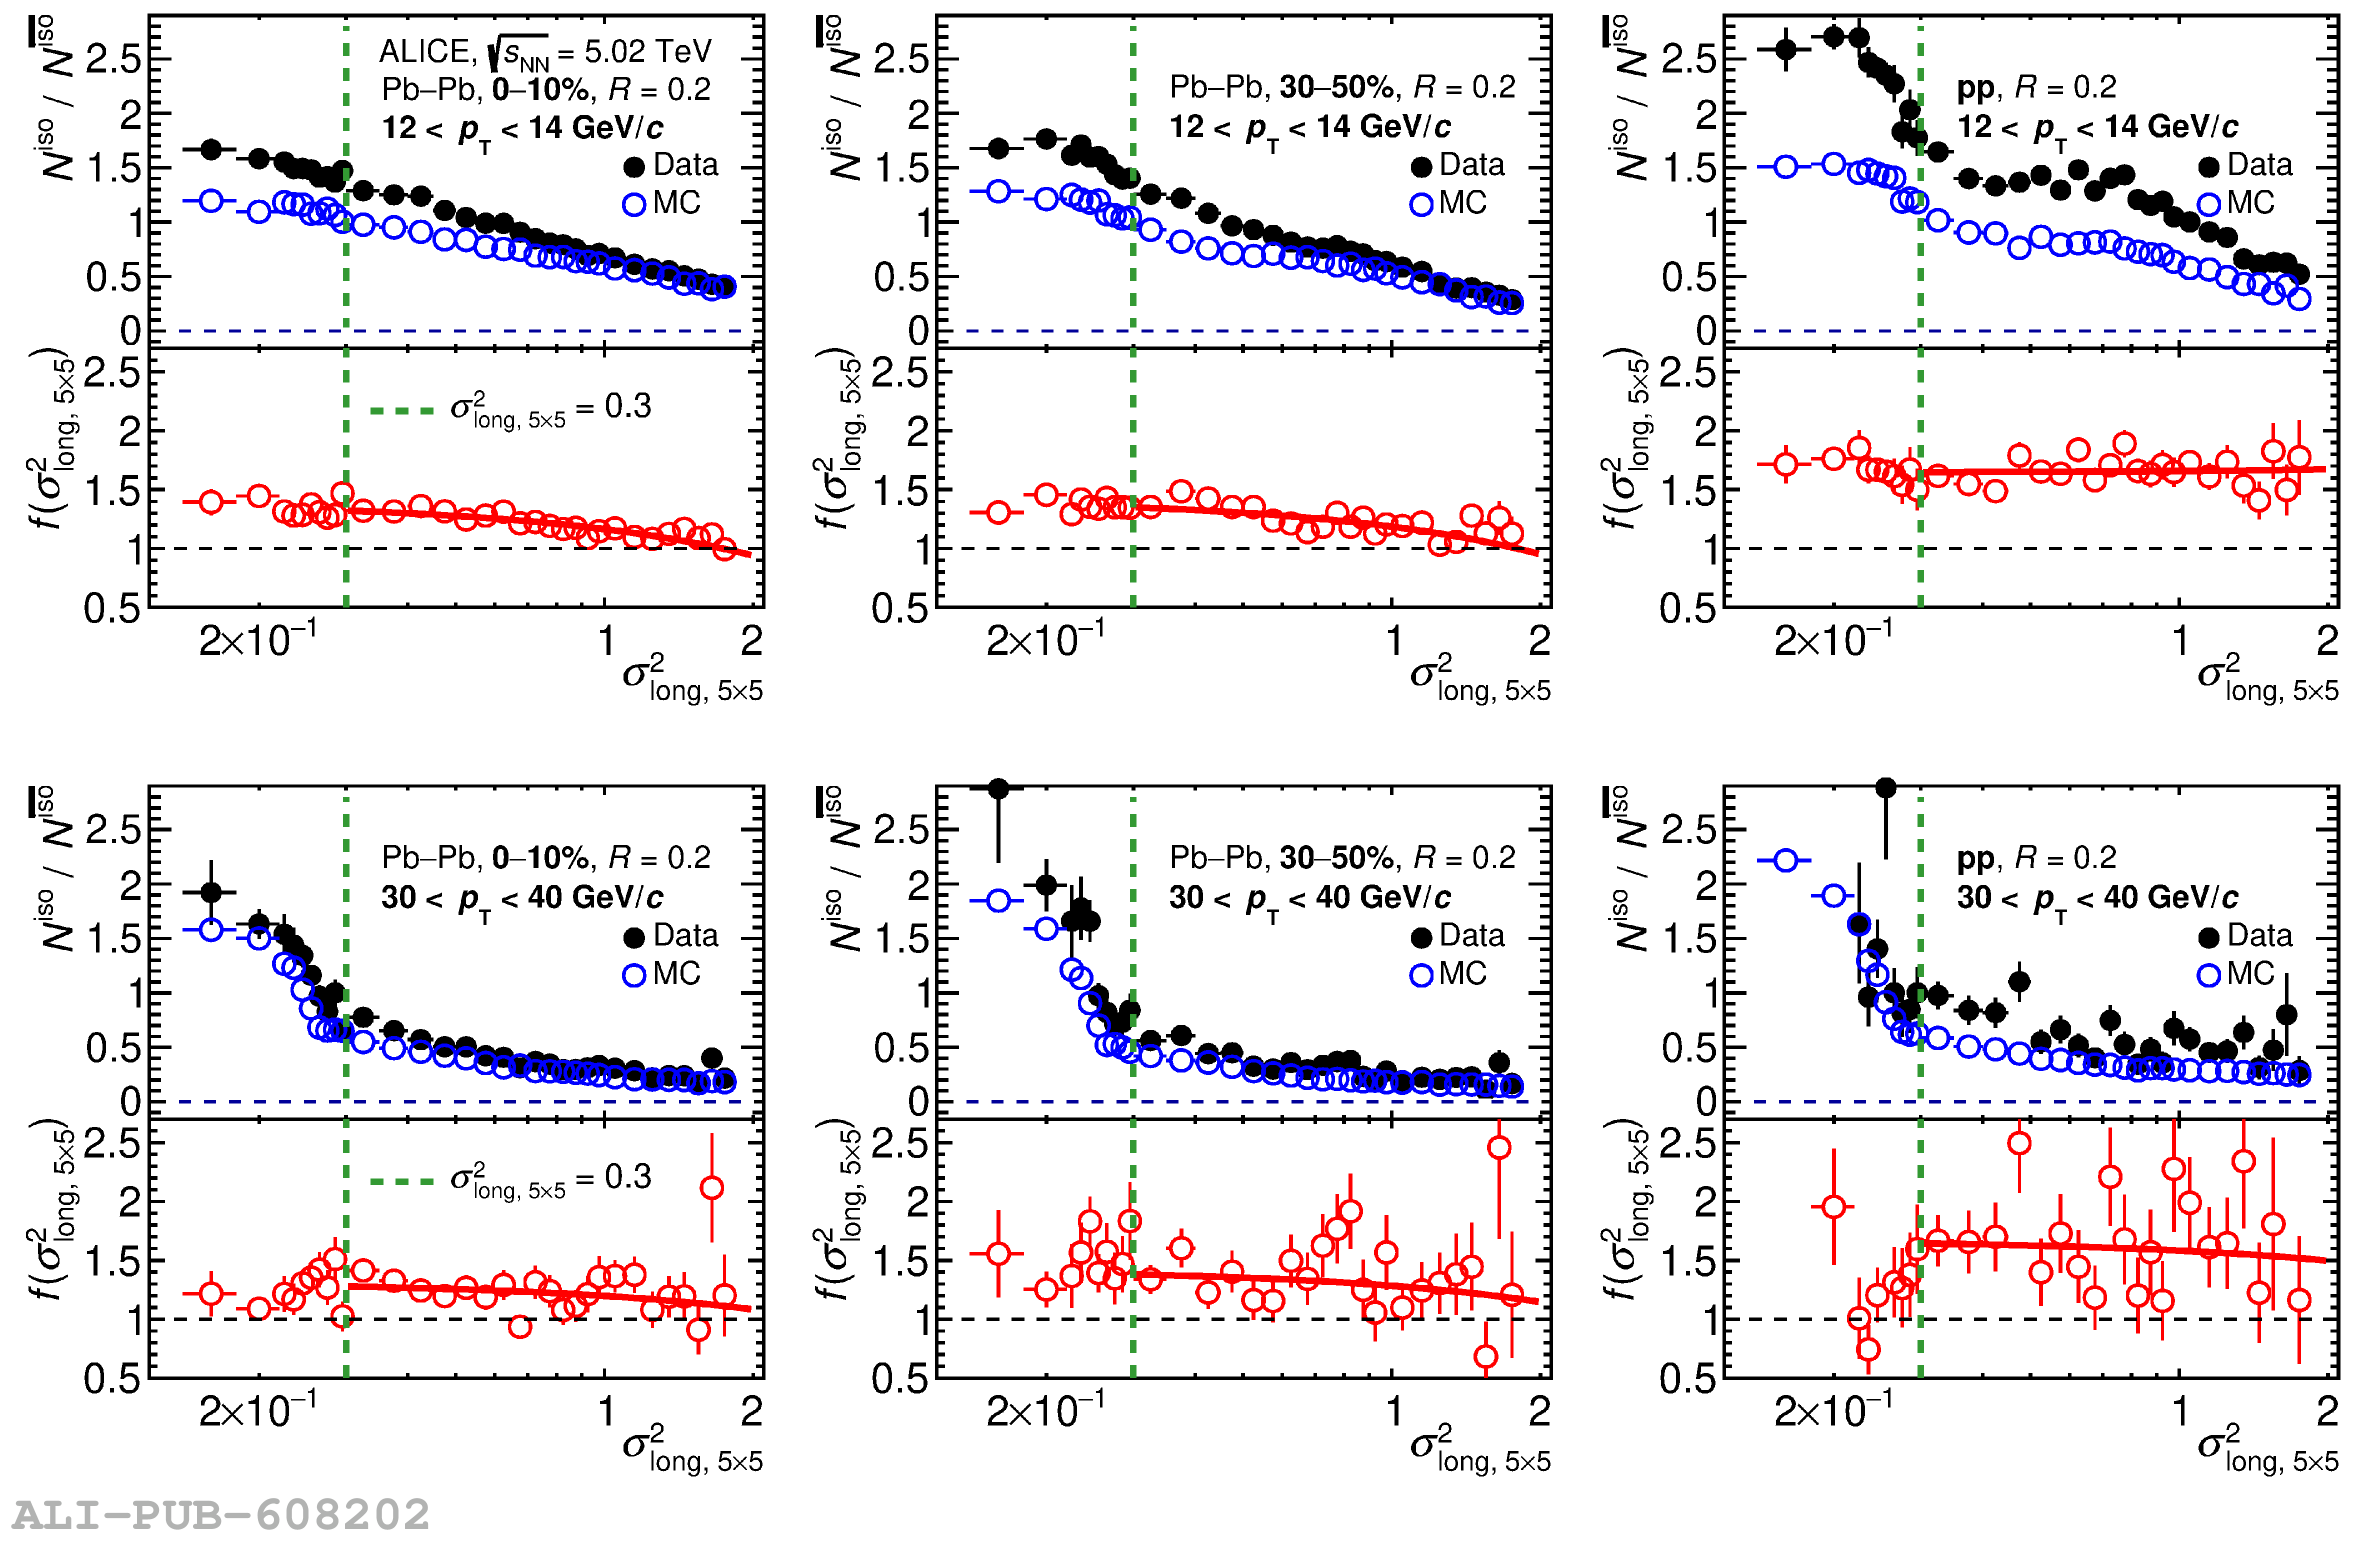 |