Ultrarelativistic heavy-ion collisions produce a state of hot and dense strongly interacting QCD matter called quark--gluon plasma (QGP). On an event-by-event basis, the volume of the QGP in ultracentral collisions is mostly constant, while its total entropy can vary significantly due to quantum fluctuations, leading to variations in the temperature of the system. Exploiting this unique feature of ultracentral collisions allows for the interpretation of the correlation of the mean transverse momentum of produced charged hadrons and the number of charged hadrons as a measure for the speed of sound. It is determined by fitting the relative increase in transverse momentum with respect to the relative change in the average charged-particle density measured at midrapidity. This study reports the event-average transverse momentum of charged particles as well as the self-normalized variance, skewness, and kurtosis of the event-by-event transverse momentum distribution in ultracentral Pb-Pb collisions at a center-of-mass energy of 5.02 TeV per nucleon pair using the ALICE detector. Different centrality estimators based on charged-particle multiplicity or the transverse energy of the event are used to select ultracentral collisions. By ensuring a pseudorapidity gap between the region used to define the centrality and the region used to perform the measurement, the influence of biases on the rise of the mean transverse momentum is tested. The measured values are found to strongly depend on the exploited centrality estimator. The variance shows a steep decrease towards ultracentral collisions, while the skewness variables show a maximum, followed by a fast decrease. These non-Gaussian features are understood in terms of the vanishing of the impact-parameter fluctuations contributing to the event-to-event transverse momentum distribution.
JHEP 11 (2025) 076
HEP Data
e-Print: arXiv:2506.10394 | PDF | inSPIRE
CERN-EP-2025-126
Figure group
Figure 1
Average number of participating nucleons $(\avNpart)$ as a function of centrality percentile in \PbPb collisions at \fivenn. Data points are shown for centrality estimators based on \nch, \et, \ntracklets within $|\eta|\leq 0.8$, and \nch within $-3.7\eta-1.7$ and $2.8 \eta 5.1$. Uncertainty bars represent the sum of statistical and systematic uncertainties, with the latter being the dominant source. The systematic uncertainty is determined by varying the acceptance correction factors within their uncertainties and assigning the maximum deviation from the nominal \Npart value as the systematic uncertainty. | 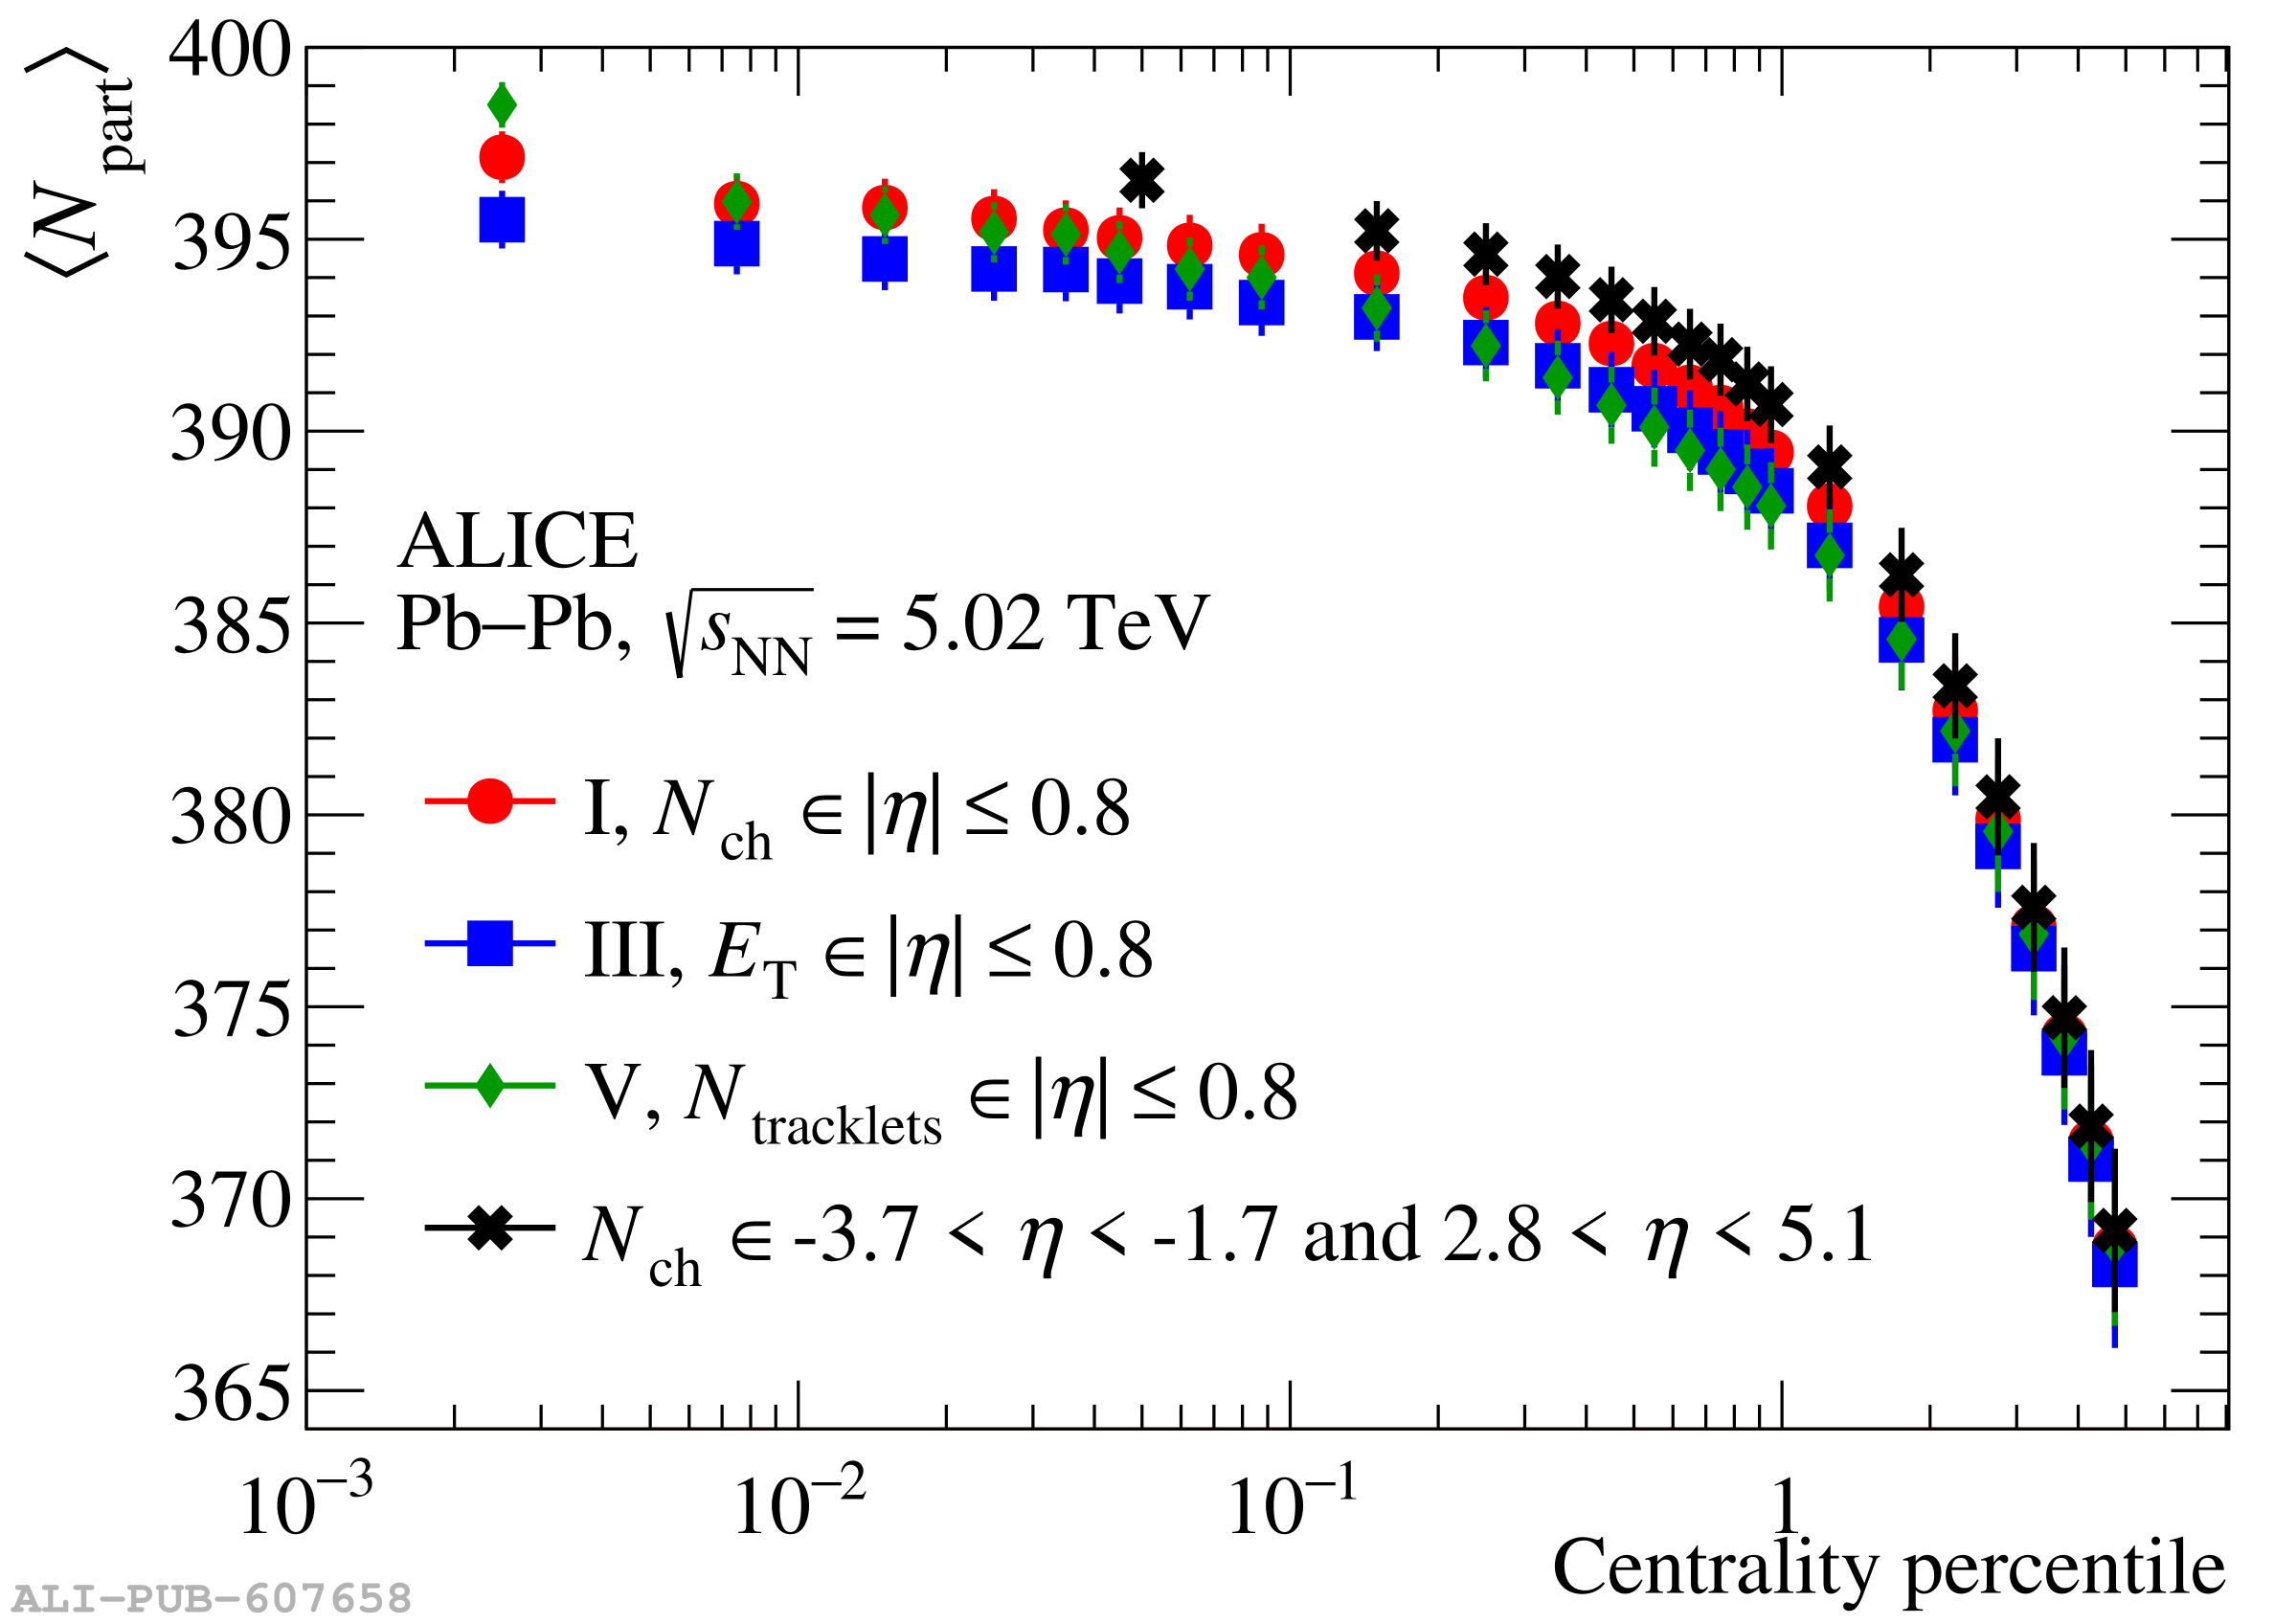 |
Figure 2
Normalized spectra ratios as a function of the transverse momentum in \PbPb collisions at \fivenn. Results are shown for centrality estimators based on \nch (top left), \et (top right), \ntracklets (bottom left) within $0.5 \leq |\eta| \leq 0.8$, and \nch within $-3.7\eta-1.7$ and $2.8 \eta 5.1$ (bottom right). Each panel displays normalized ratios for selected centrality classes. The centrality percentile legend in the bottom left panel applies to midrapidity estimators, while the legend in the bottom right panel applies to the forward estimator. Error bars represent statistical uncertainties. Systematic uncertainties, which are largely canceled due to their common origin in both the numerator and denominator, are not shown. | 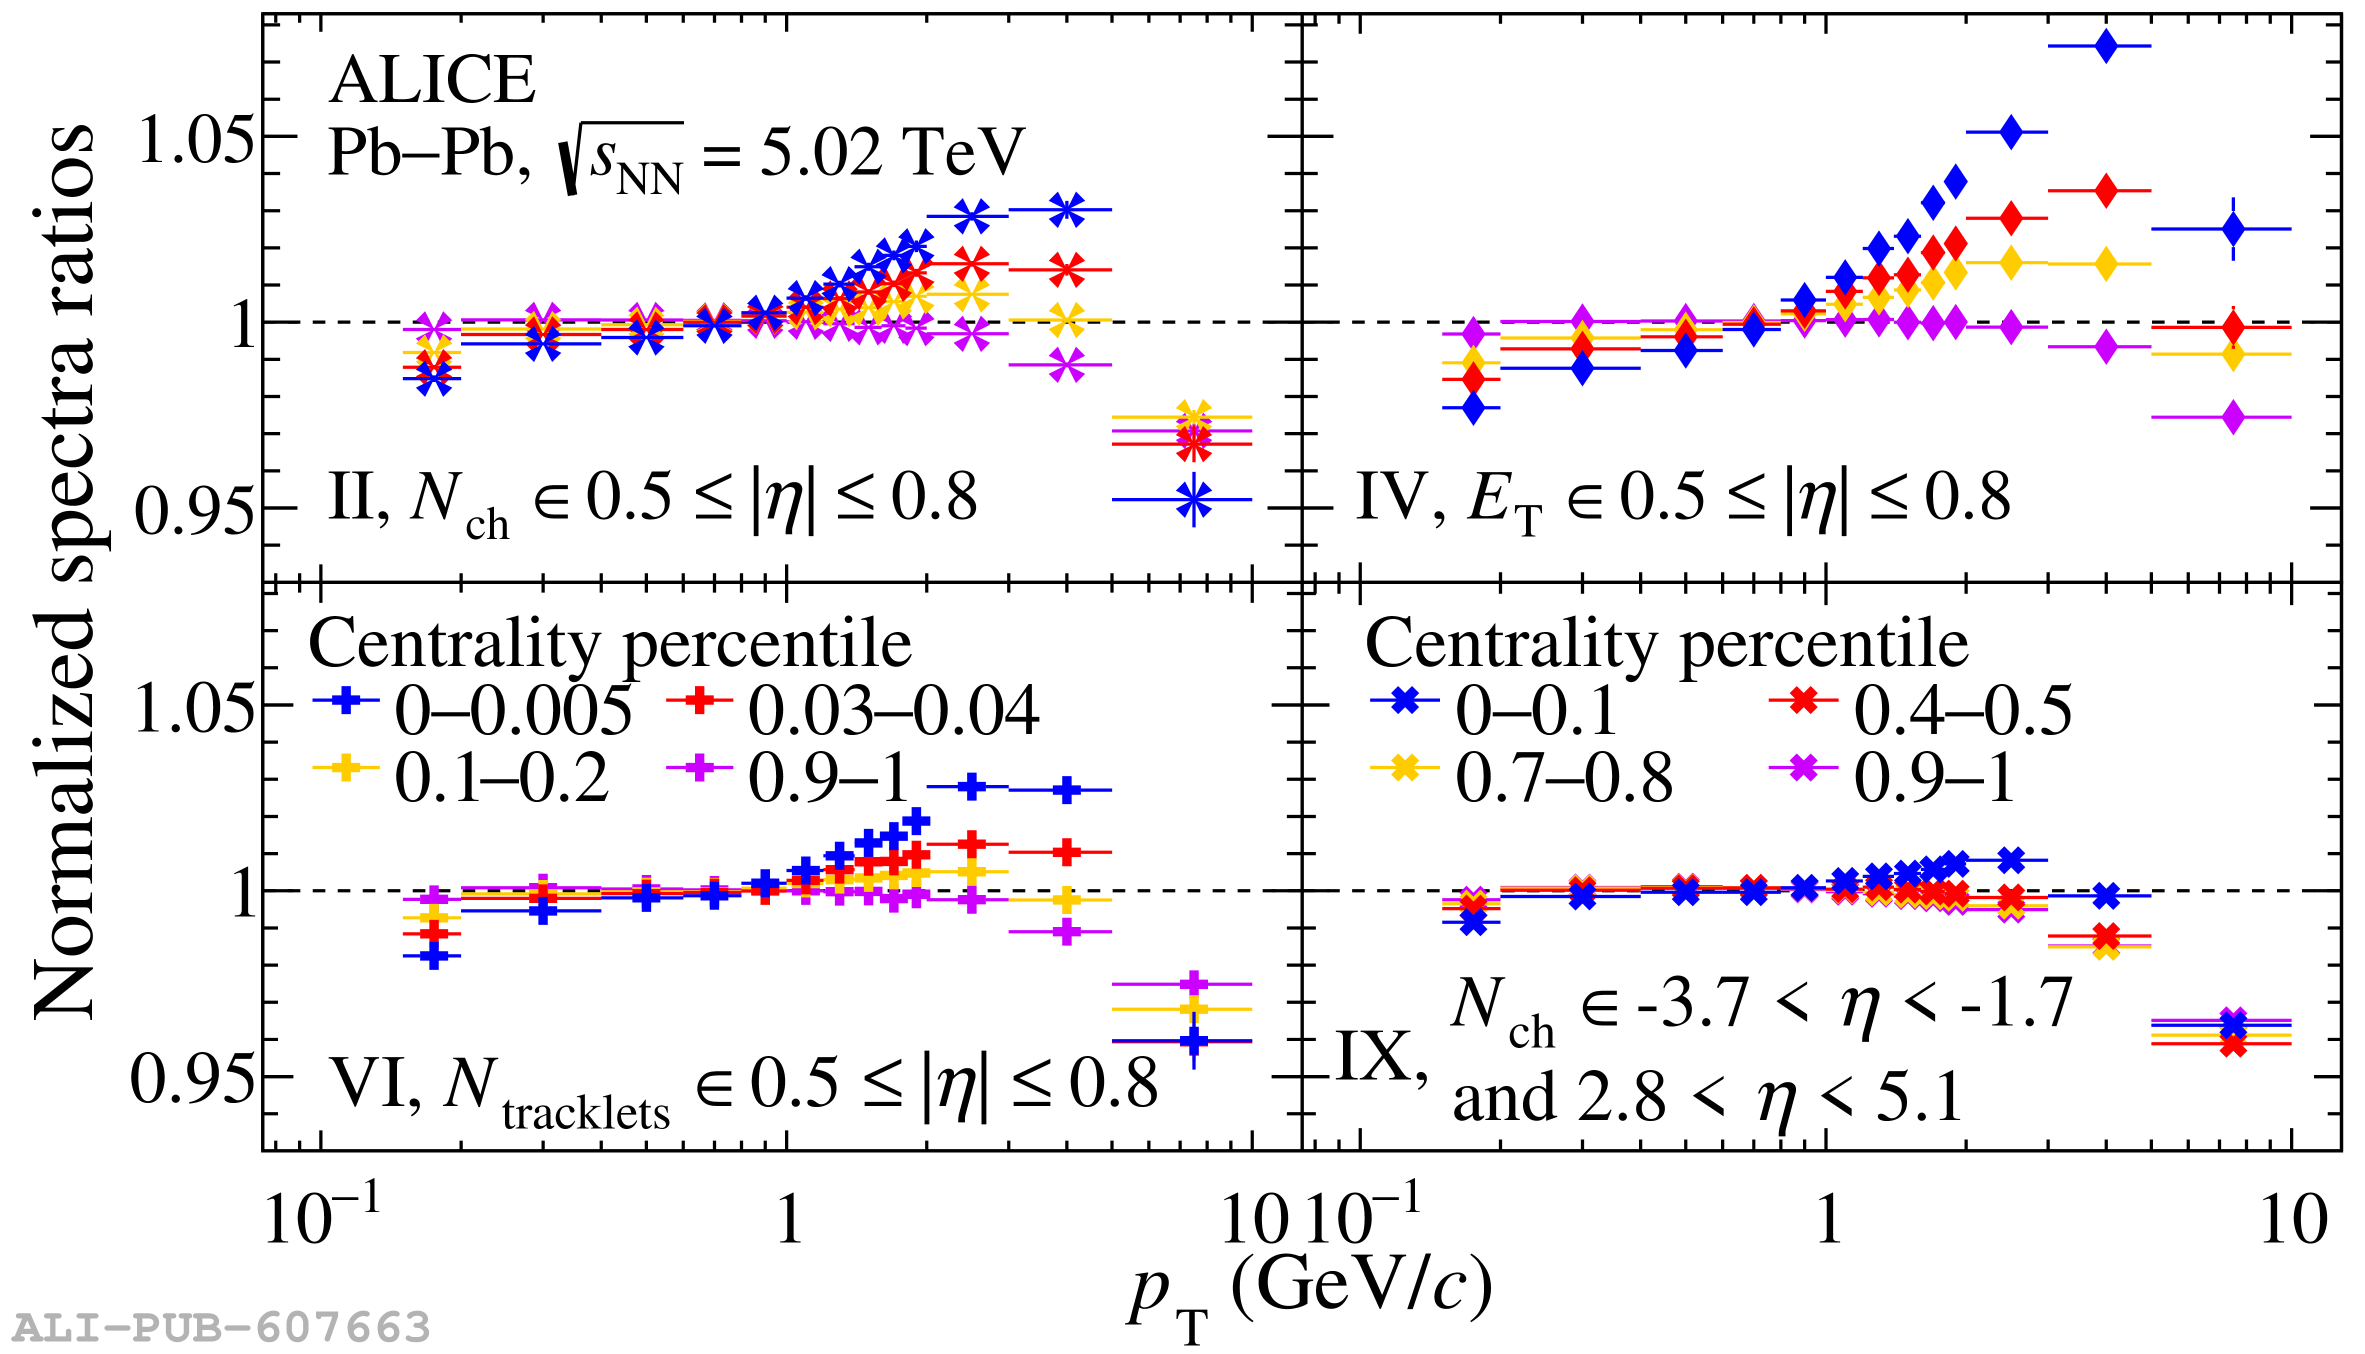 |
Figure 3
Event fraction distribution as a function of the normalized charged-particle density in \PbPb collisions at \fivenn. Centrality classification is based on \nch (red circles) and \et (blue squares) in $|\eta|\leq0.8$, and on forward \nch for the \VZERO (black crosses). \dndetanorm is derived from the extrapolated spectra in $|\eta|\leq0.8$. Gray curves represent fits using the model from Ref. . The positions of \dndetanormknee, indicated by dashed vertical lines, are 1.137, 1.120, and 1.111 for the \nch-, \et-, and \VZERO-based centrality estimators, respectively. | 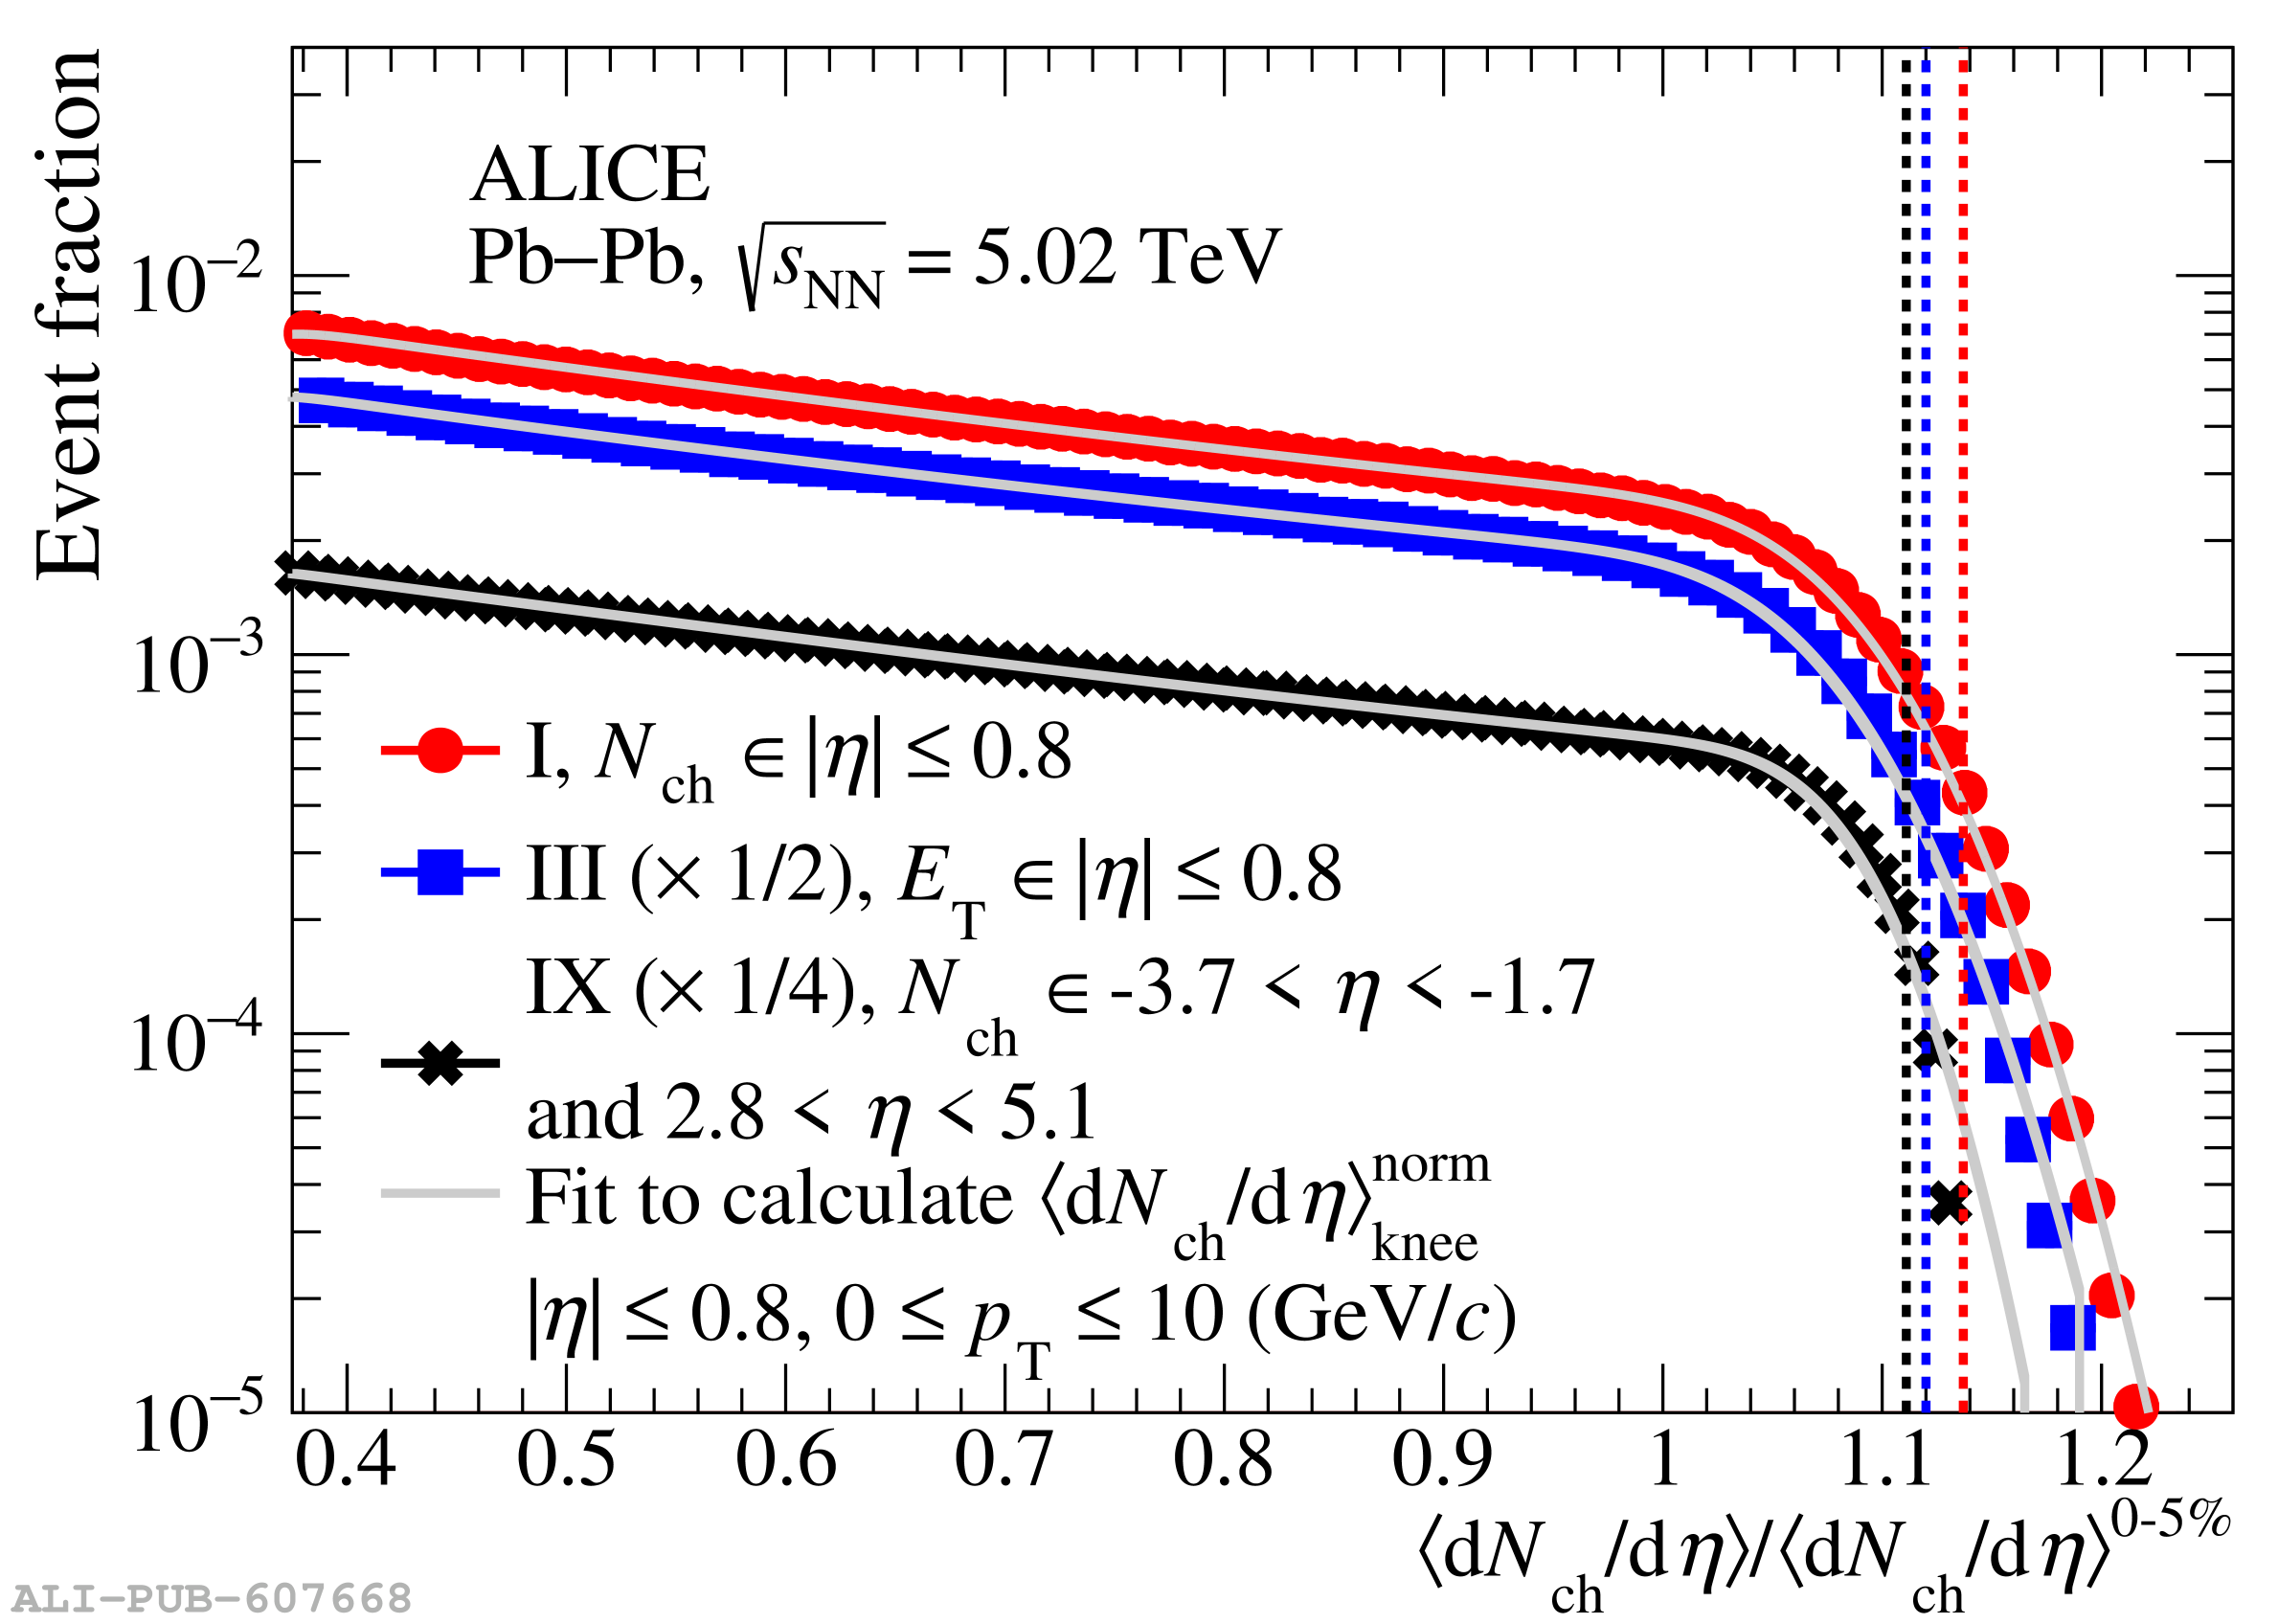 |
Figure 4
Correlation between \ptnorm and \dndetanorm in \PbPb collisions at \fivenn. Each panel shows the results for different centrality estimators defined in Table \ref{tab:centrality_definition}. \ptnorm and \dndetanorm are derived from the \pt spectra within the 0--10 $\mathrm{GeV}/c$ interval for all centrality estimators. For \et-based centrality estimators, the $y$-axis scale should be read from the axis located to the right of the bottom right panel. Lines on top of the data represent fits using Eq. \ref{eq:fitmeanpt}. The fit range spans from 1 to the last point. Each panel displays the corresponding \scs values with their total uncertainty, determined by summing the statistical and systematic uncertainties in quadrature. Vertical uncertainty bars in each point represent the combined statistical and systematic uncertainty. The total uncertainty in the \dndetanorm is negligible and therefore not visible. | 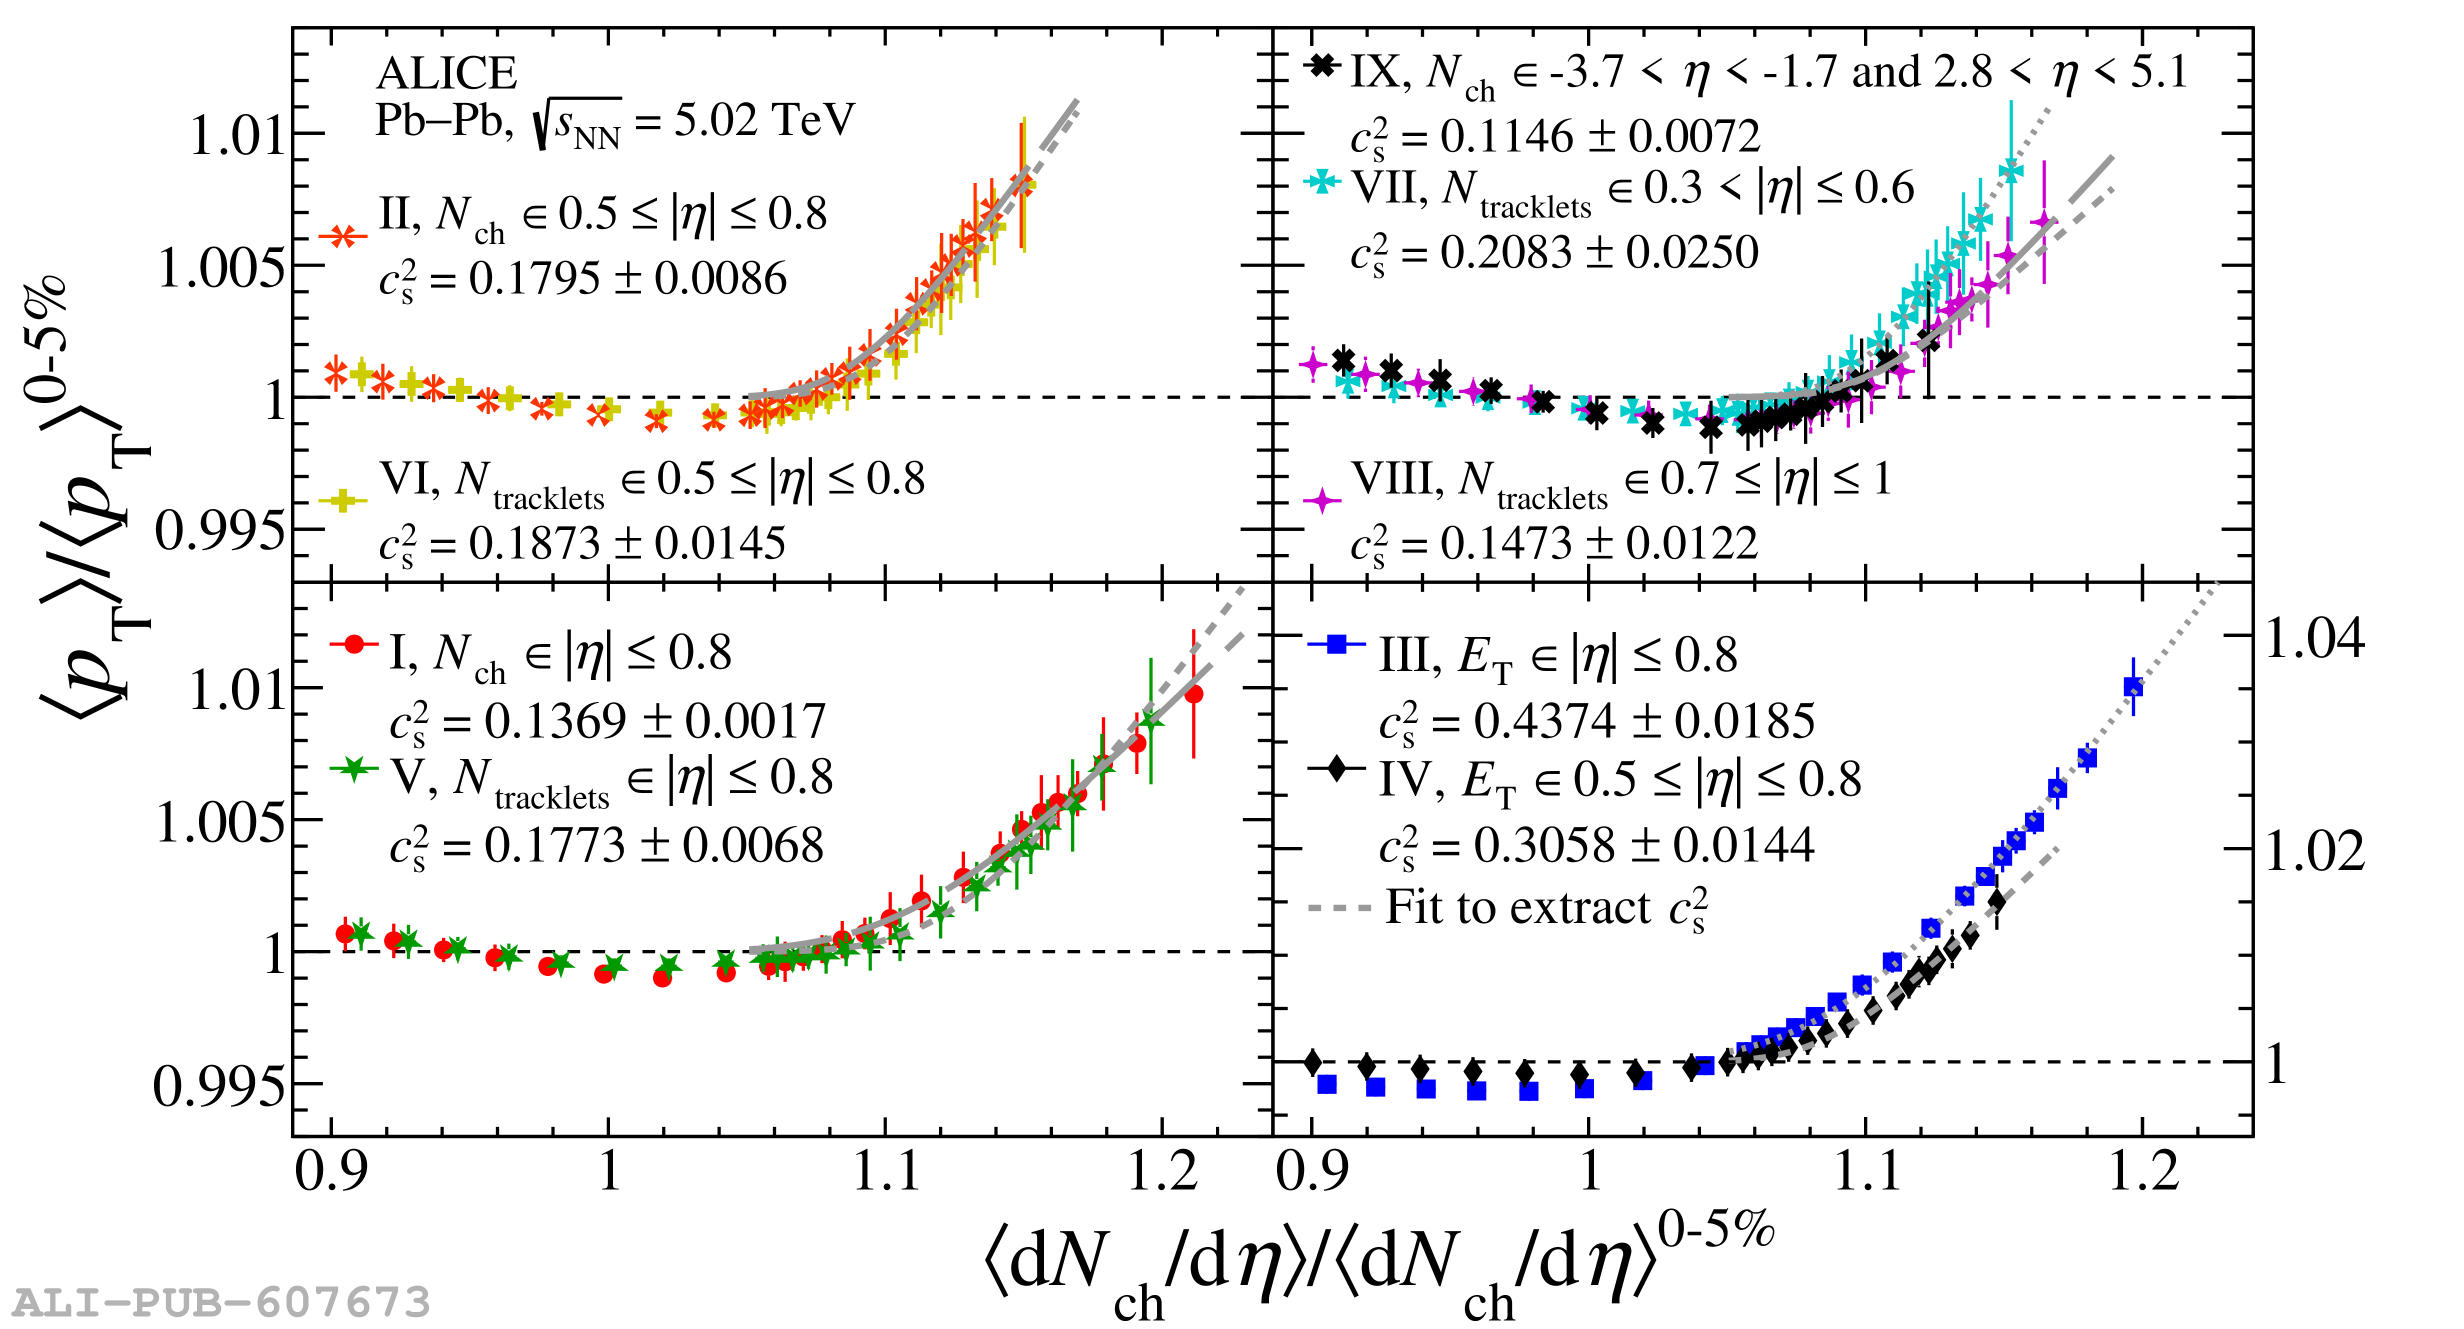 |
Figure 5
Correlation between \ptnorm and \dndetanorm in \PbPb collisions at \fivenn. Each panel shows the results for different centrality estimators defined in Table \ref{tab:centrality_definition}. The data are compared with predictions from the HIJING and Trajectum models, represented by continuous and dashed lines, respectively. The bands around the Trajectum predictions represent the sum in quadrature of the statistical and systematic uncertainties, with the latter being the dominant source. For the HIJING predictions, only the statistical uncertainty is shown (not visible in the plot). | 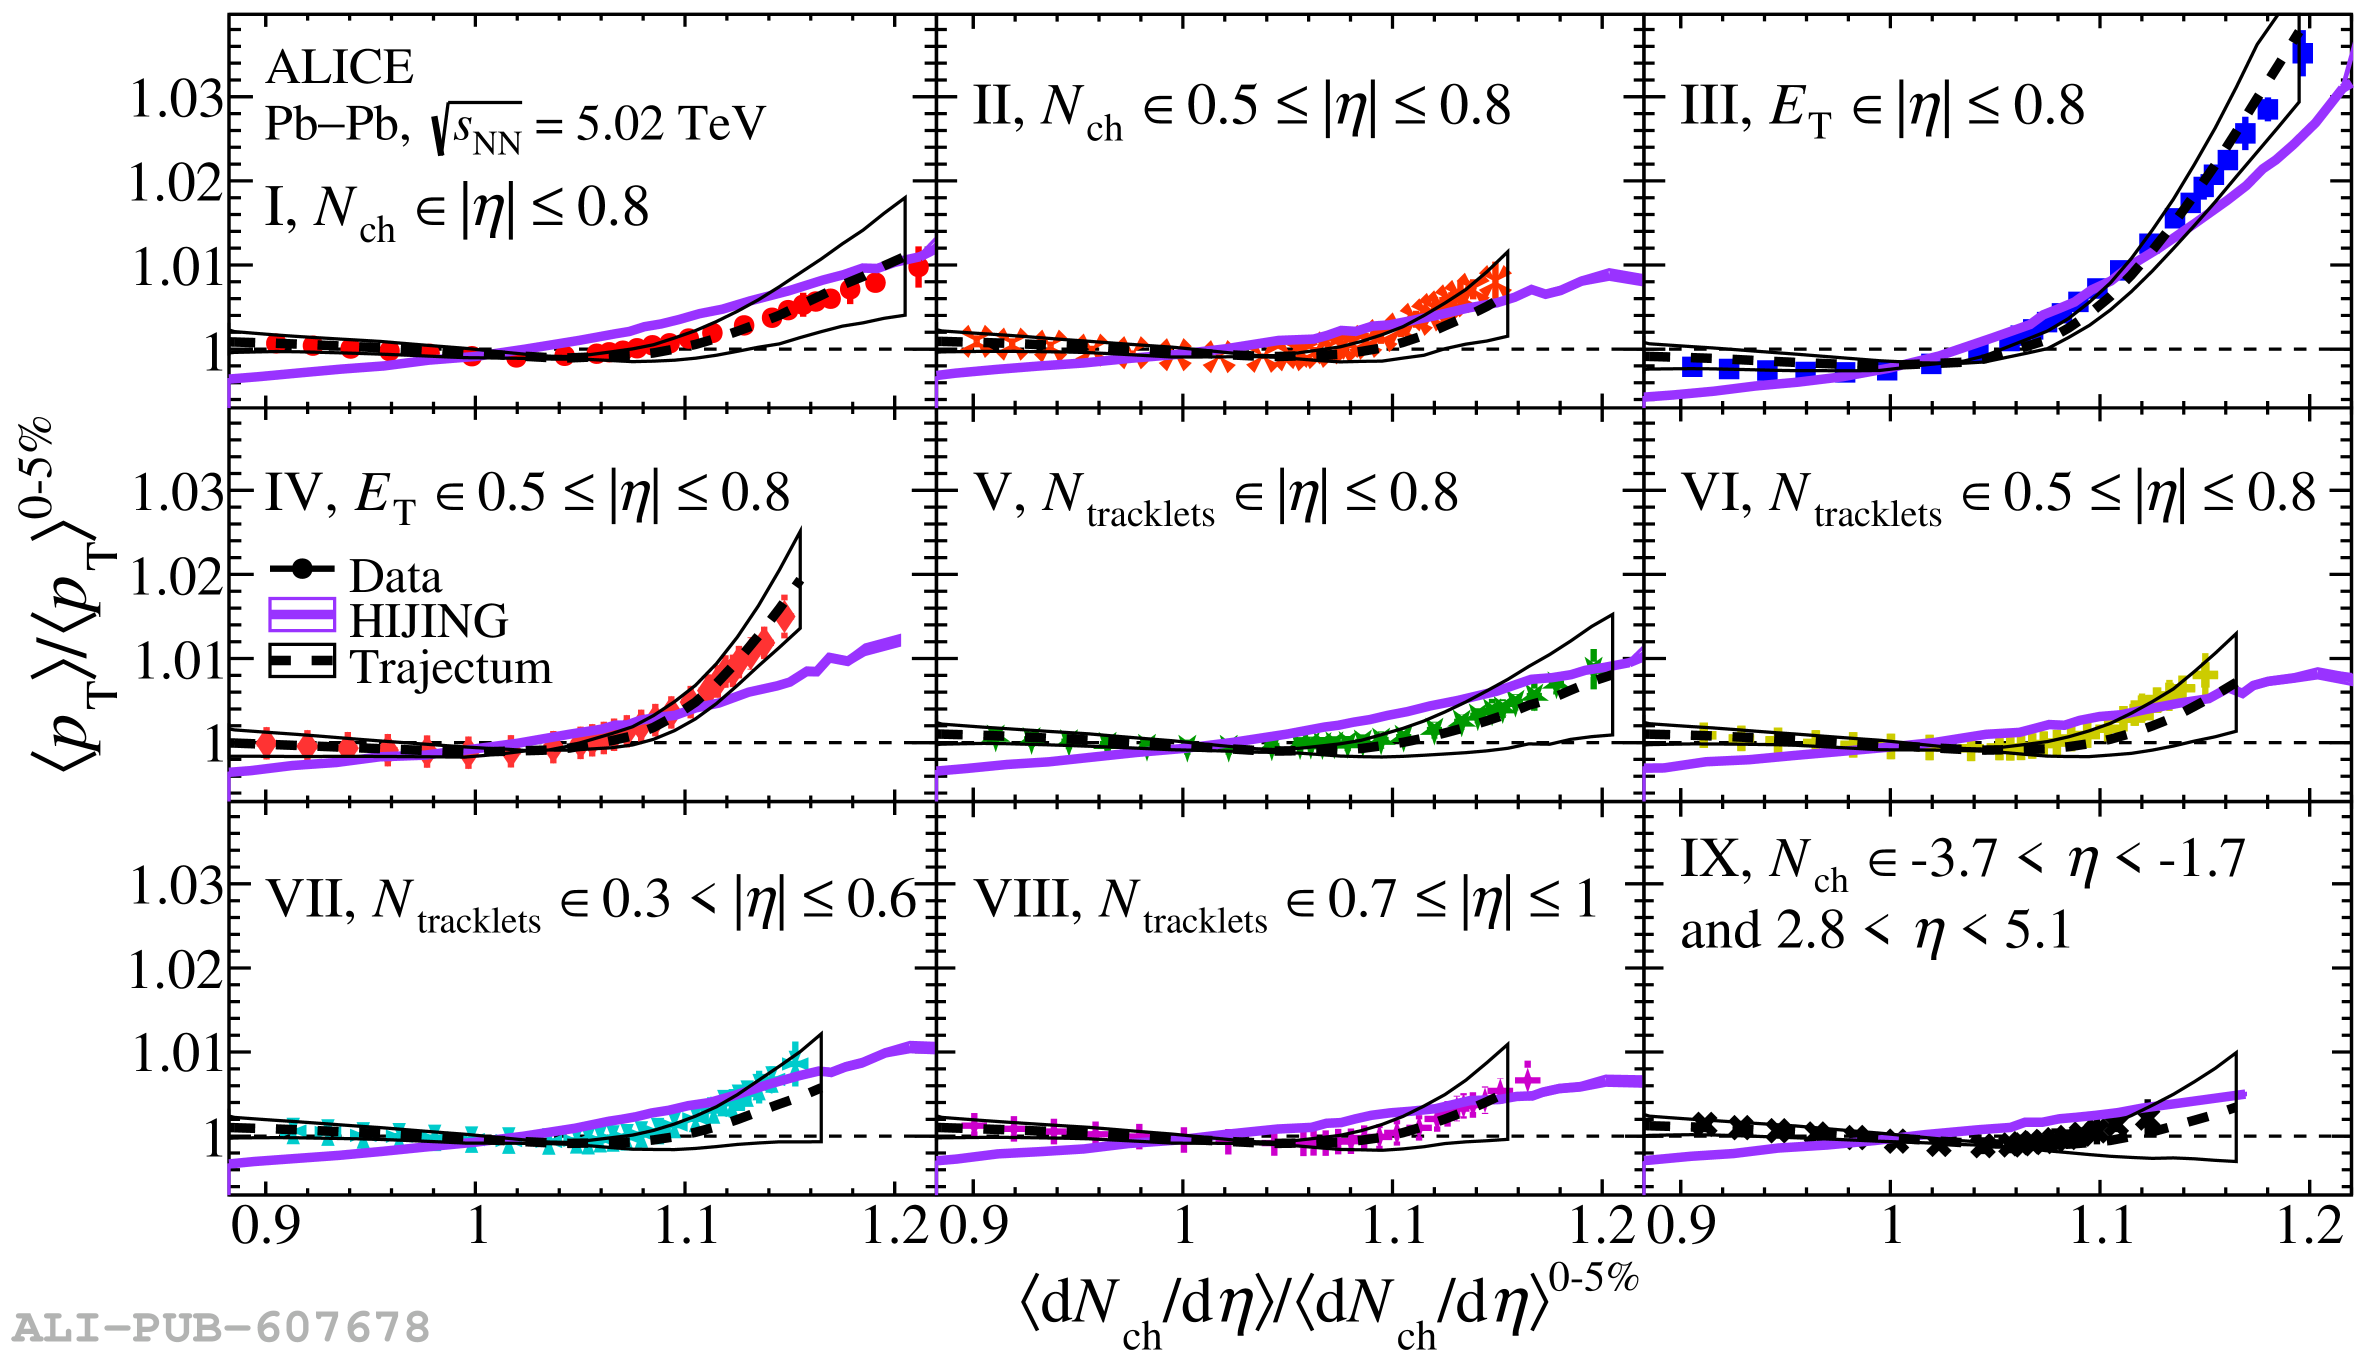 |
Figure 6
Extracted \scs as a function of the minimum pseudorapidity gap between the centrality estimation and transverse-momentum spectra measurement in Pb--Pb collisions at \fivenn. The results are compared with the \scs value measured by the CMS Collaboration (with a minimum $|\Delta\eta|=2.5$) . The uncertainty bars around the data points represent the sum in quadrature of the statistical and systematic uncertainties (not visible). Predictions from Trajectum are shown as continuous lines, with mesh bands indicating the total uncertainty (statistical and systematic combined in quadrature). Predictions from the HIJING model are shown as dashed lines, with shaded bands representing statistical uncertainty only. See the main text for details on the uncertainty estimation in the model \scs values. The horizontal dashed green line indicates the Lattice QCD prediction of \scs for deconfined matter, as calculated by the HotQCD Collaboration . Centrality-estimator definitions are presented in Table \ref{tab:centrality_definition}. |  |
Figure 7
Higher-order moments of $[\pt]$ measured for events selected with the \nch (I) and \et (III) centrality estimators at midrapidity in \PbPb collisions at \fivenn are shown in the left and right columns, respectively. The \ktwnorm distributions are fitted with a two-component model (continuous gray line), where the estimated Geometrical component is also shown (dotted-dashed blue line) . The curves for the \kthnorm, \stdsknorm, \intsknorm, and \kunorm distributions correspond to predictions based on the fit of \ktwnorm . | 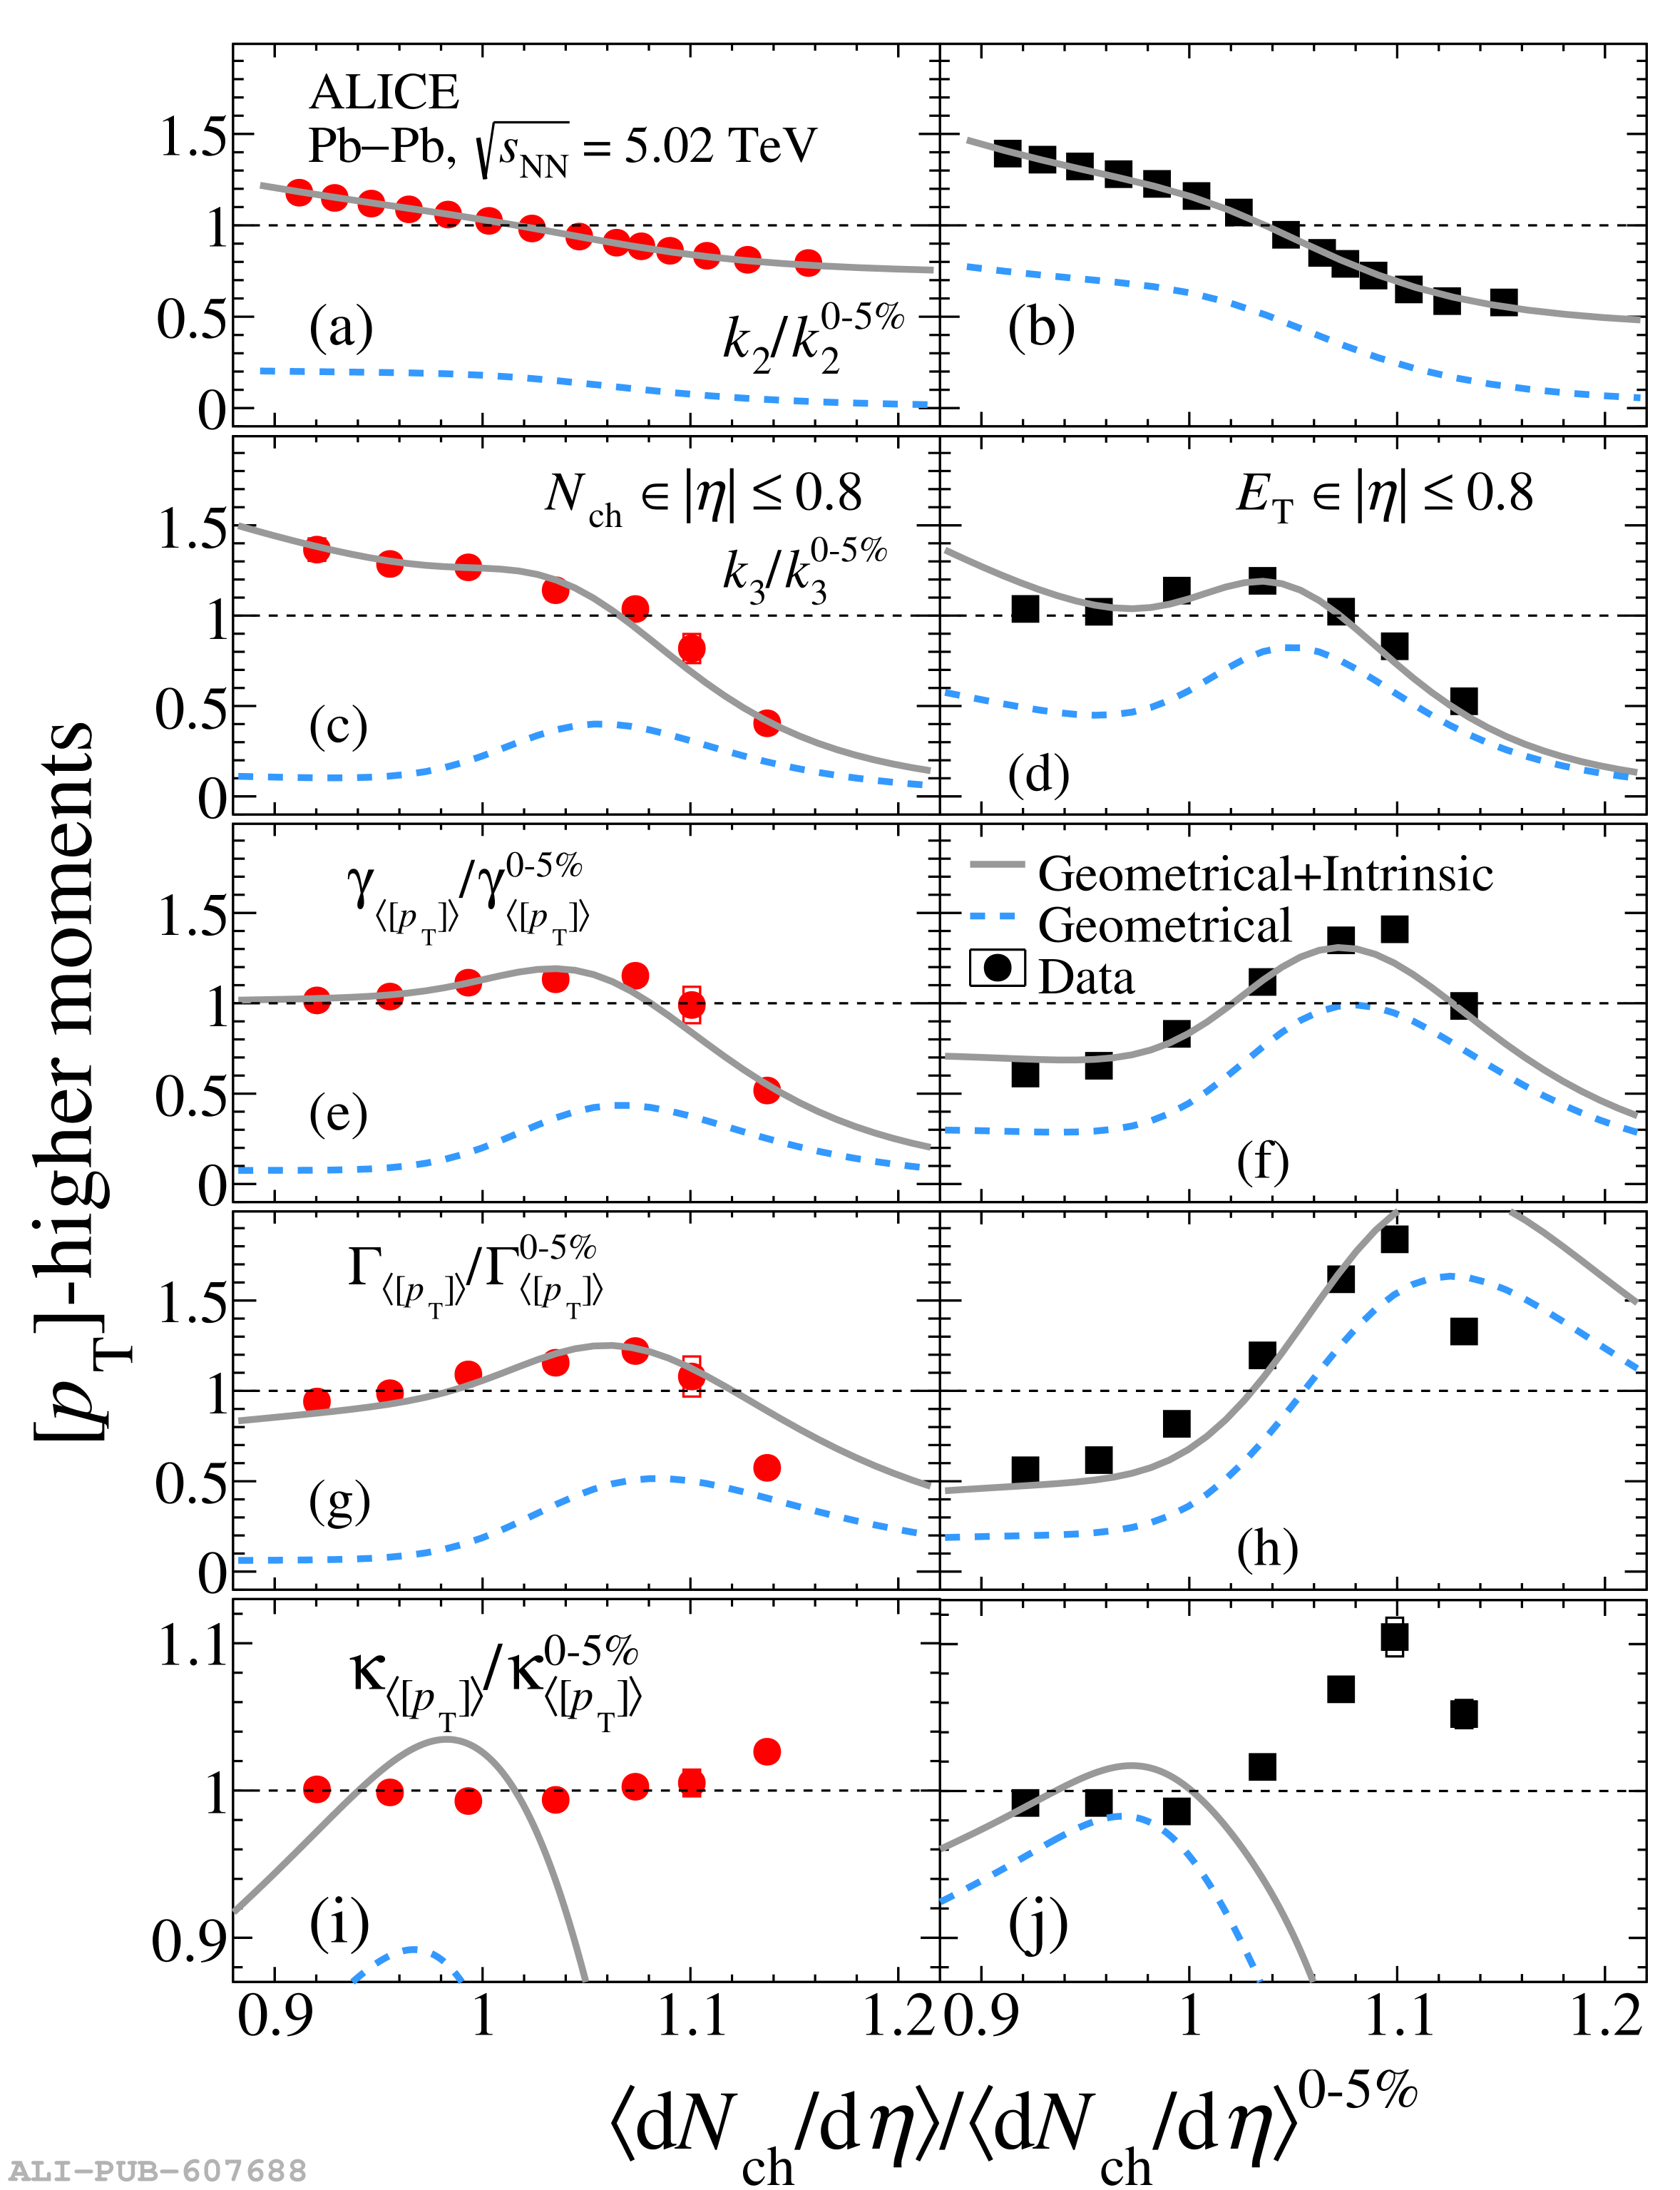 |
Figure 8
Higher-order moments of $[\pt]$ for events selected with the \nch (I) and \et (III) centrality estimators at midrapidity in \PbPb collisions at \fivenn are shown in the left and right columns, respectively. The data are compared with predictions from the HIJING and Trajectum models. The width of the bands represents the statistical uncertainty in the HIJING predictions. The bands around the Trajectum predictions represent the sum in quadrature of the statistical and systematic uncertainties, with the latter being the dominant source. | 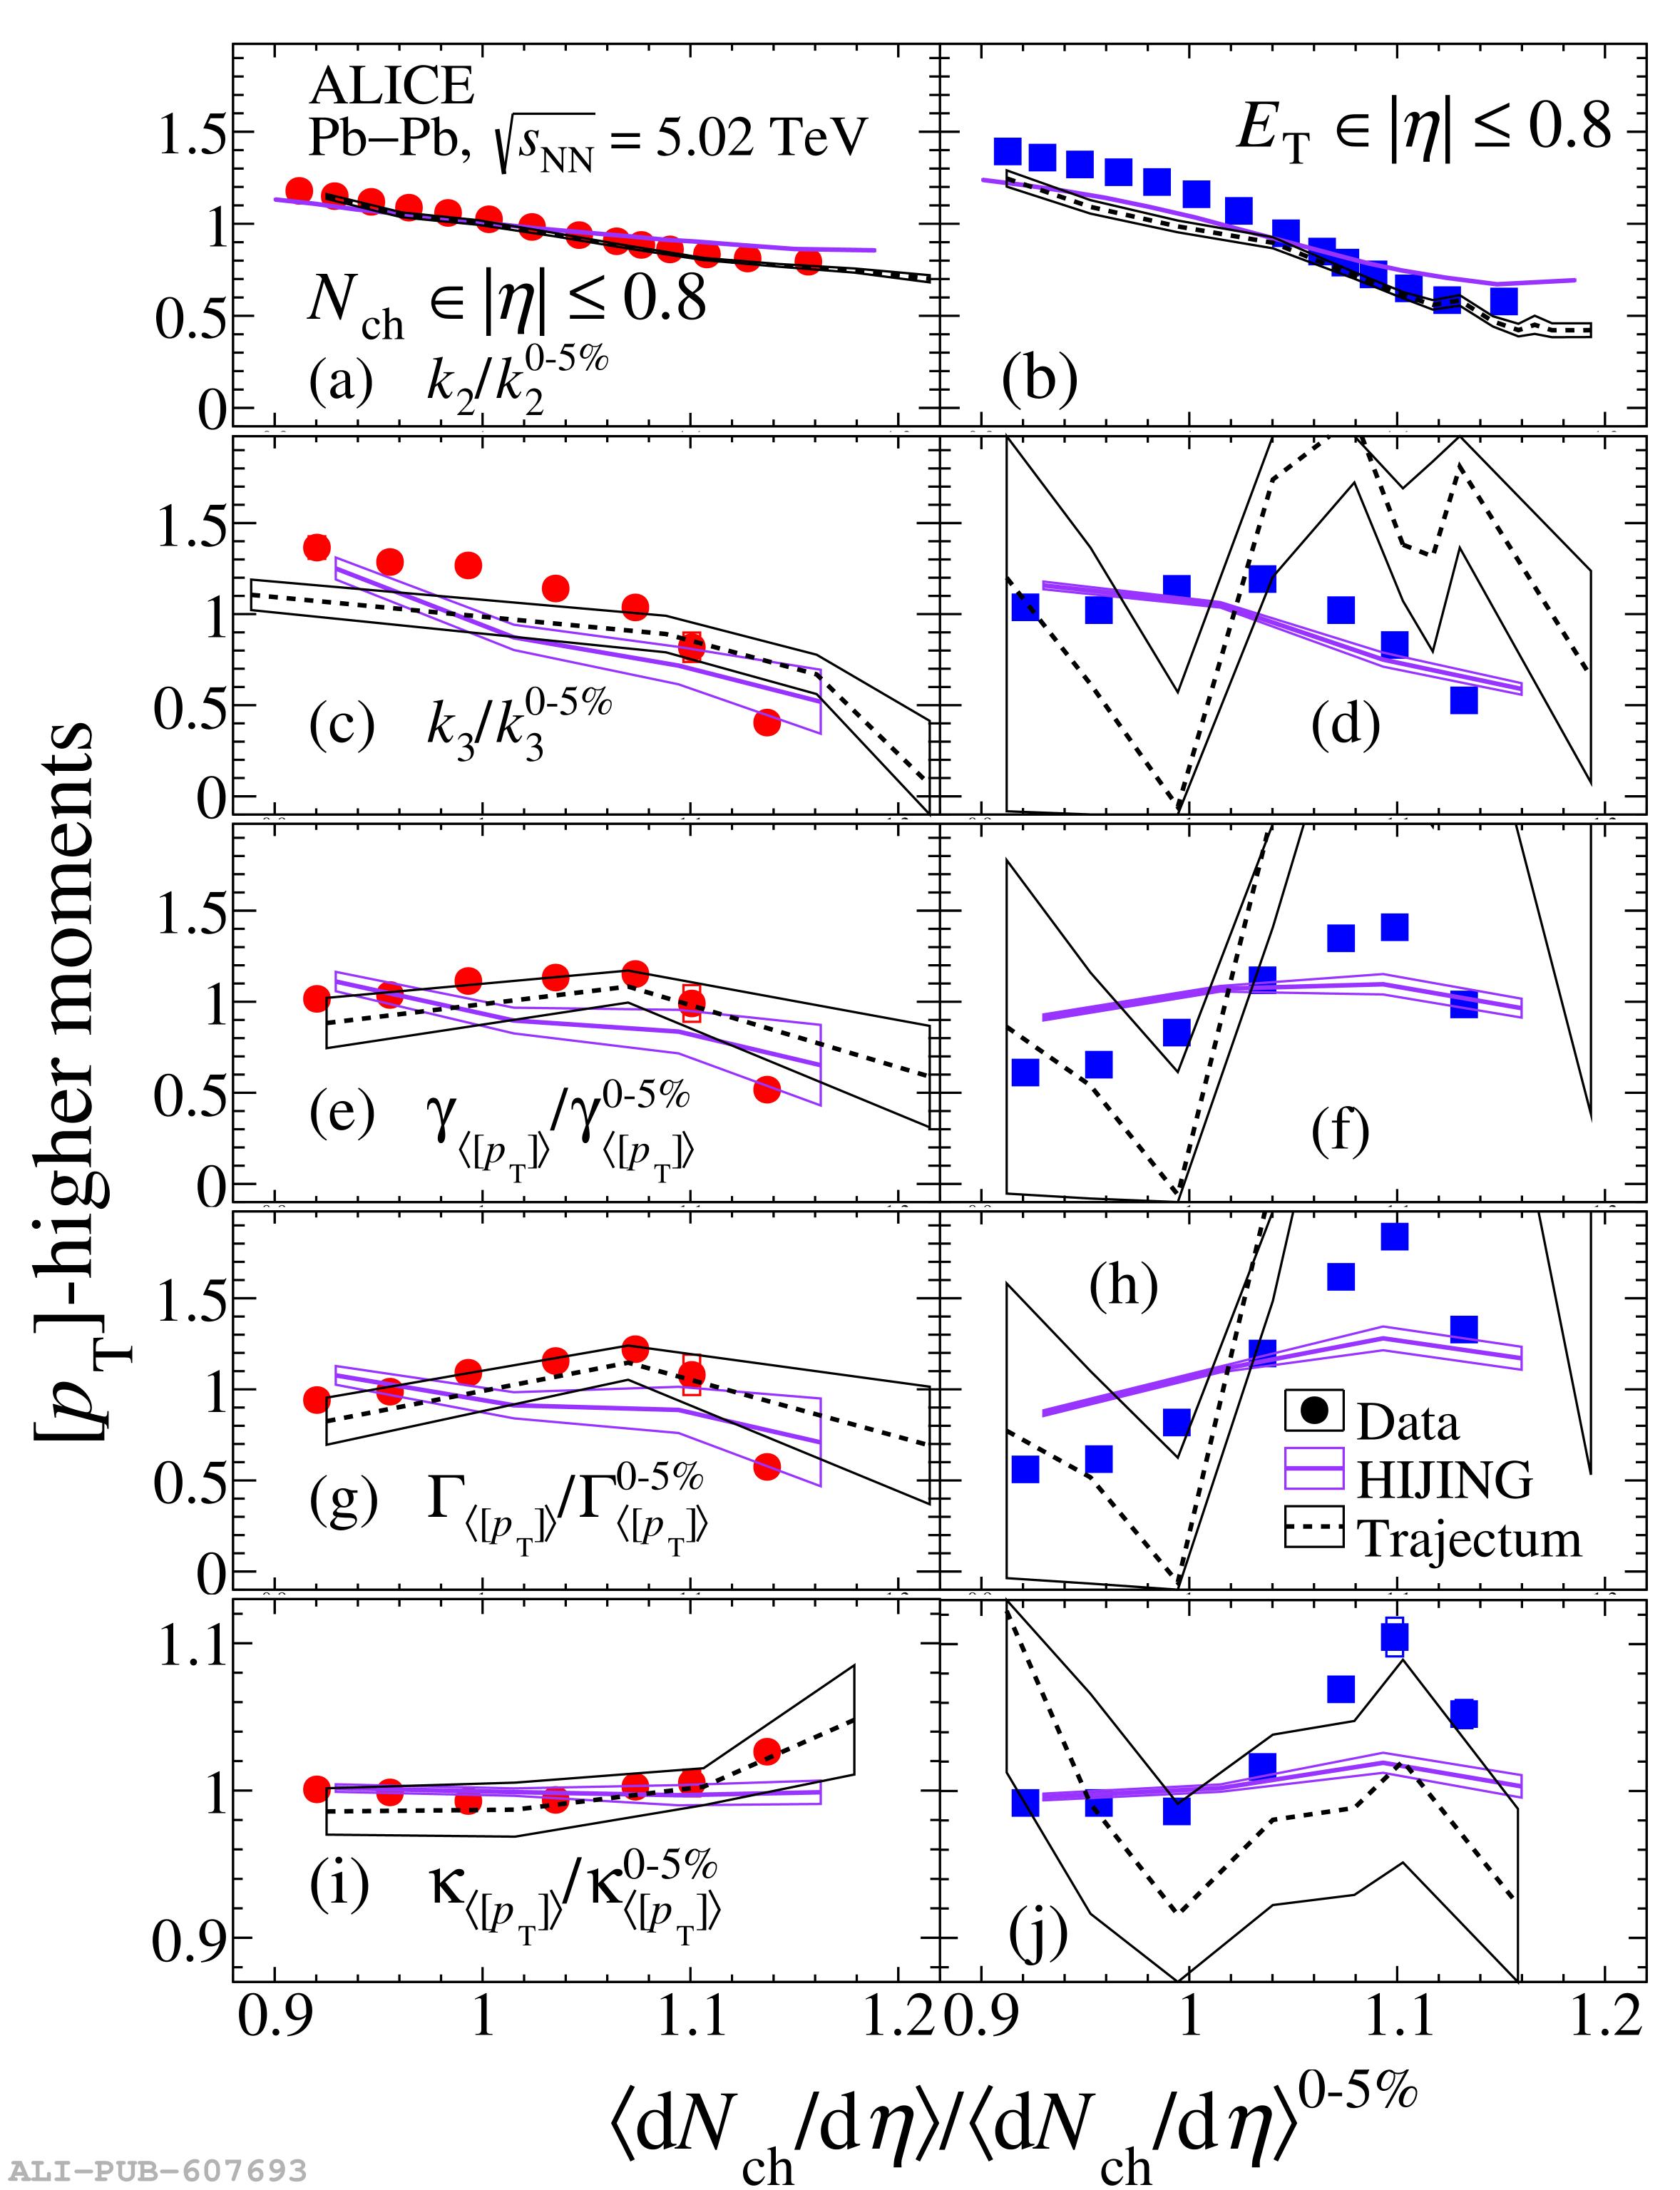 |
Figure A.1
\ptnorm as a function of \dndetanorm. Results are shown for two centrality estimators: one based on transverse energy (black diamonds) and the other based on charged-particle multiplicity (red crosses). For the \nch-based centrality estimator, two values of \scs are extracted using non-overlapping fit ranges (dashed-lines). The \ptnorm versus \dndetanorm correlation for the \et-based centrality estimator corresponds to the centrality definition labeled as IV in Table \ref{tab:centrality_definition}. | 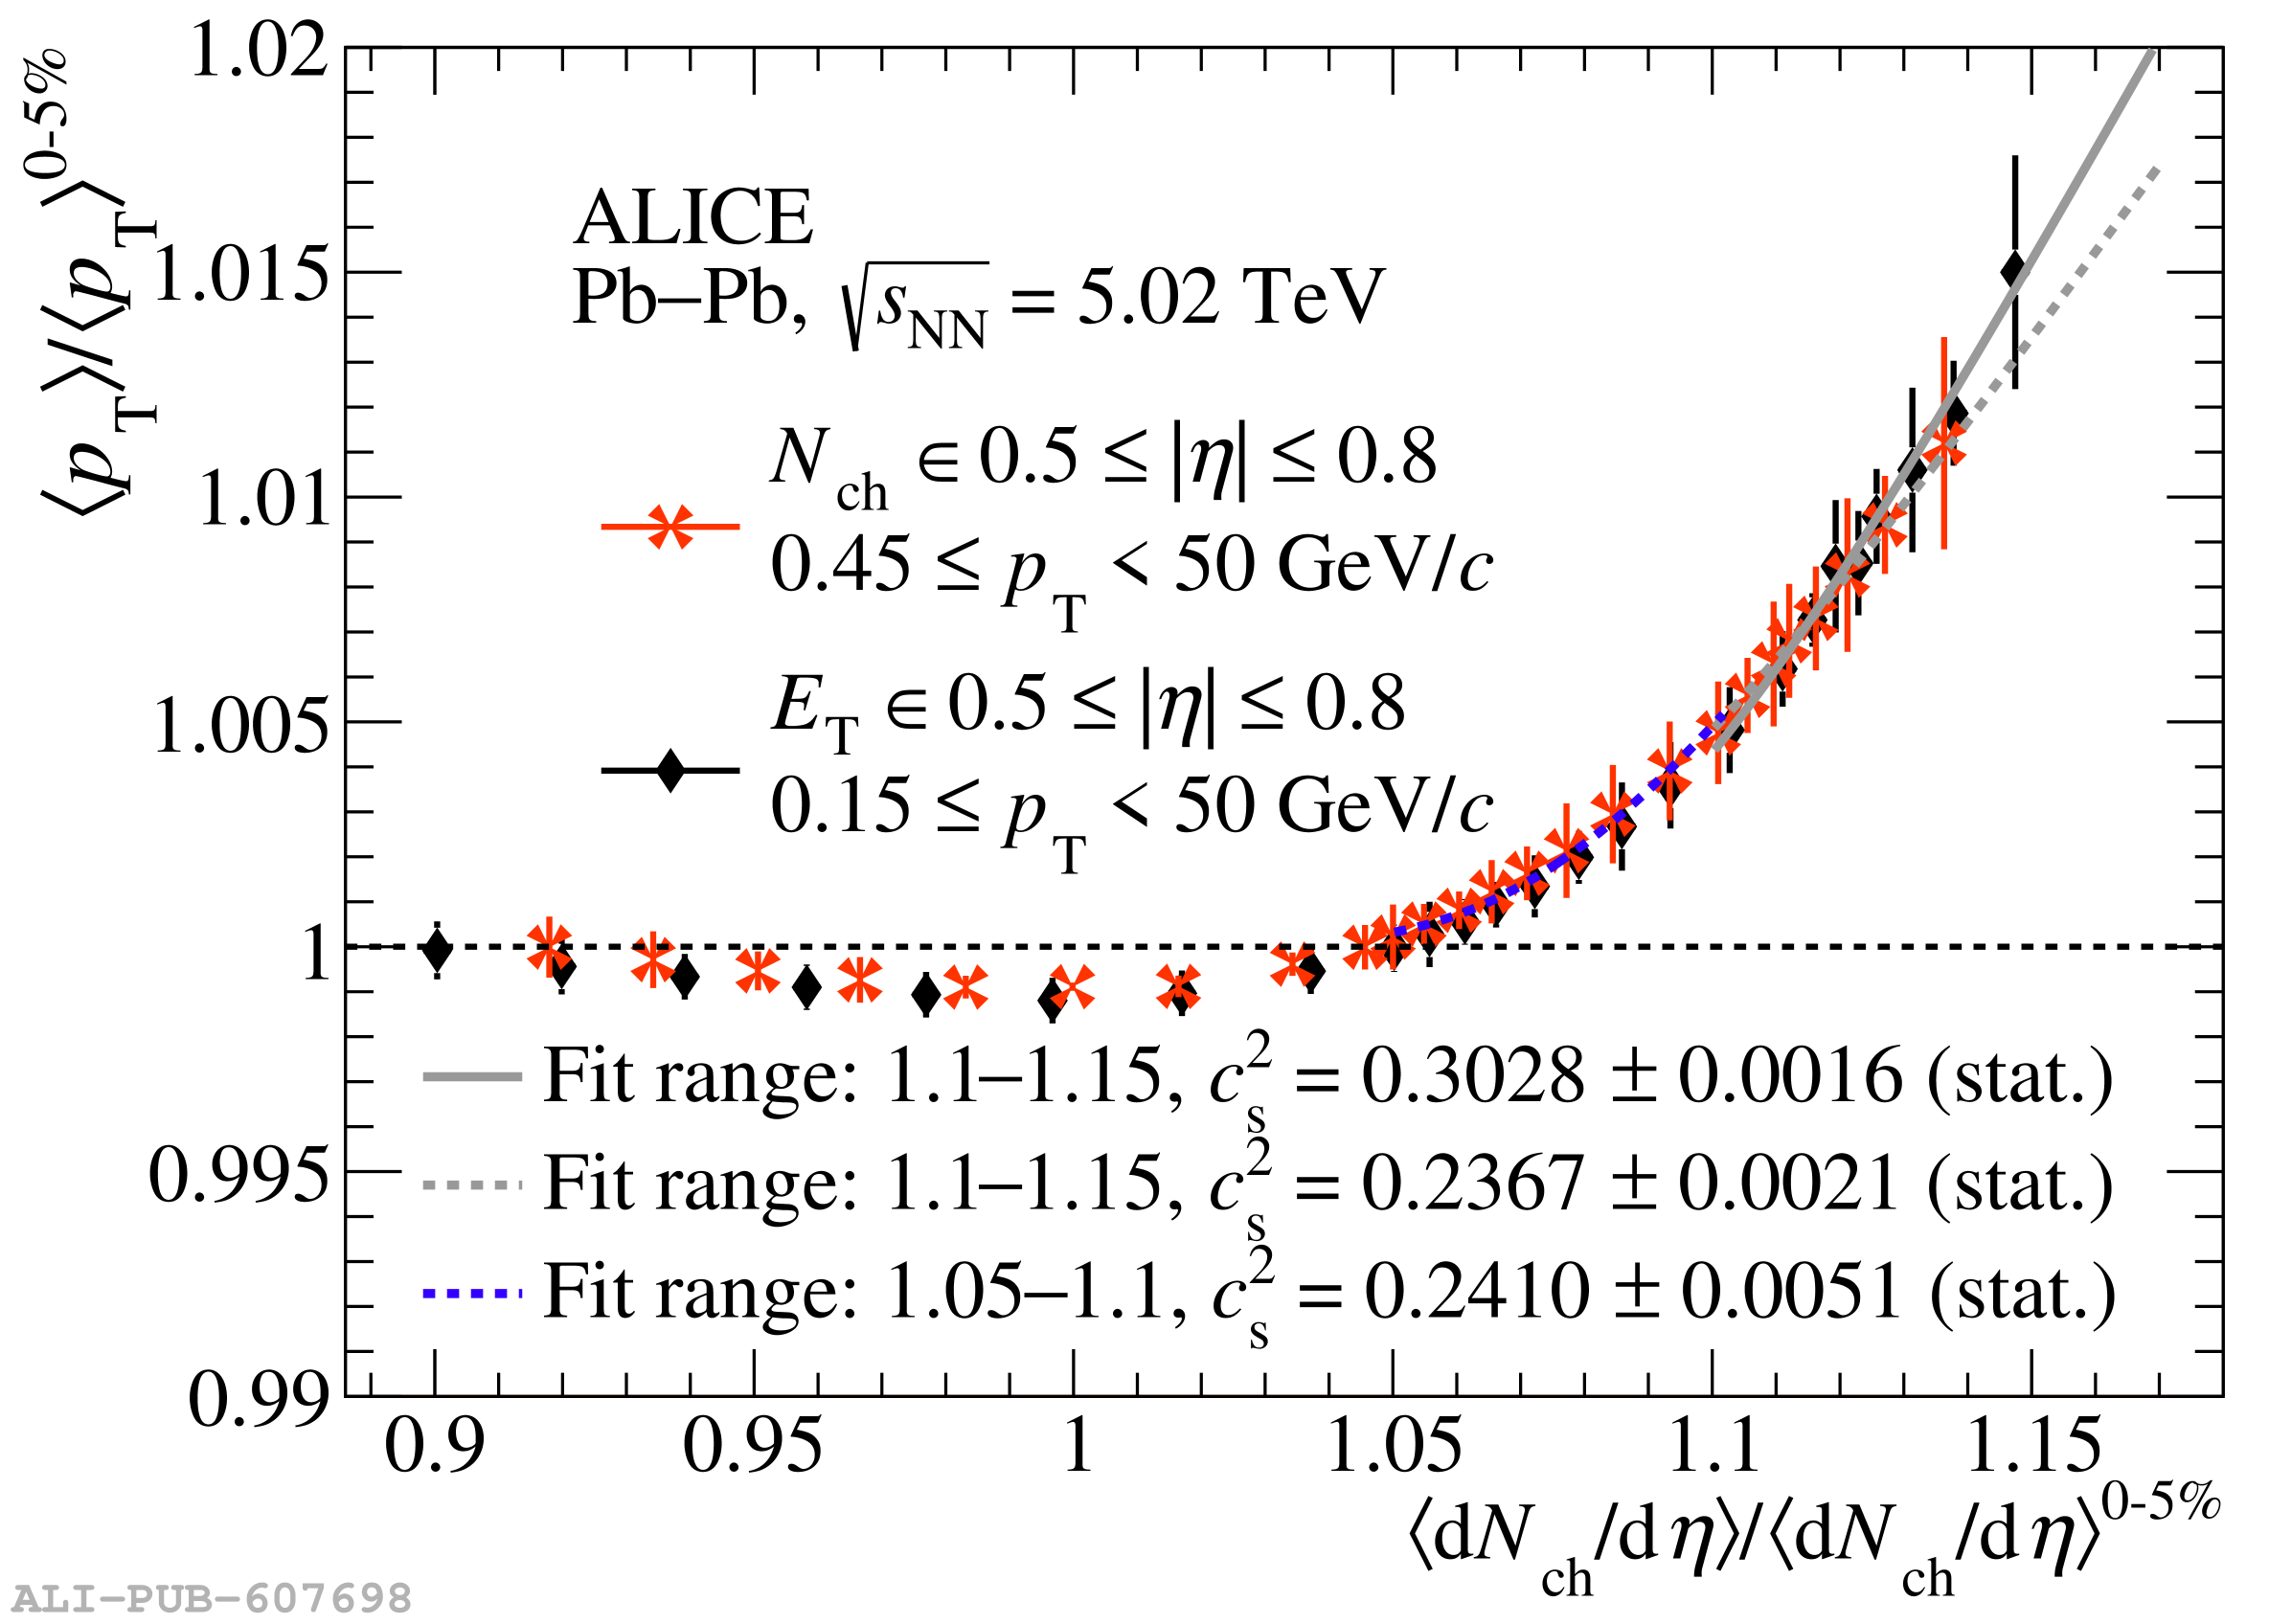 |
Figure A.2
Higher-order moments of $[\pt]$ measured for events selected with the \VZERO centrality estimator (IX) in \PbPb collisions at \fivenn. The \ktwnorm distribution is fitted with a two-component model (continuous gray line), where the estimated Geometrical component is also show (dotted-dashed blue line) . The curves for the \kthnorm, \stdsknorm, \intsknorm, and \kunorm distributions correspond to predictions based on the fit of \ktwnorm . | 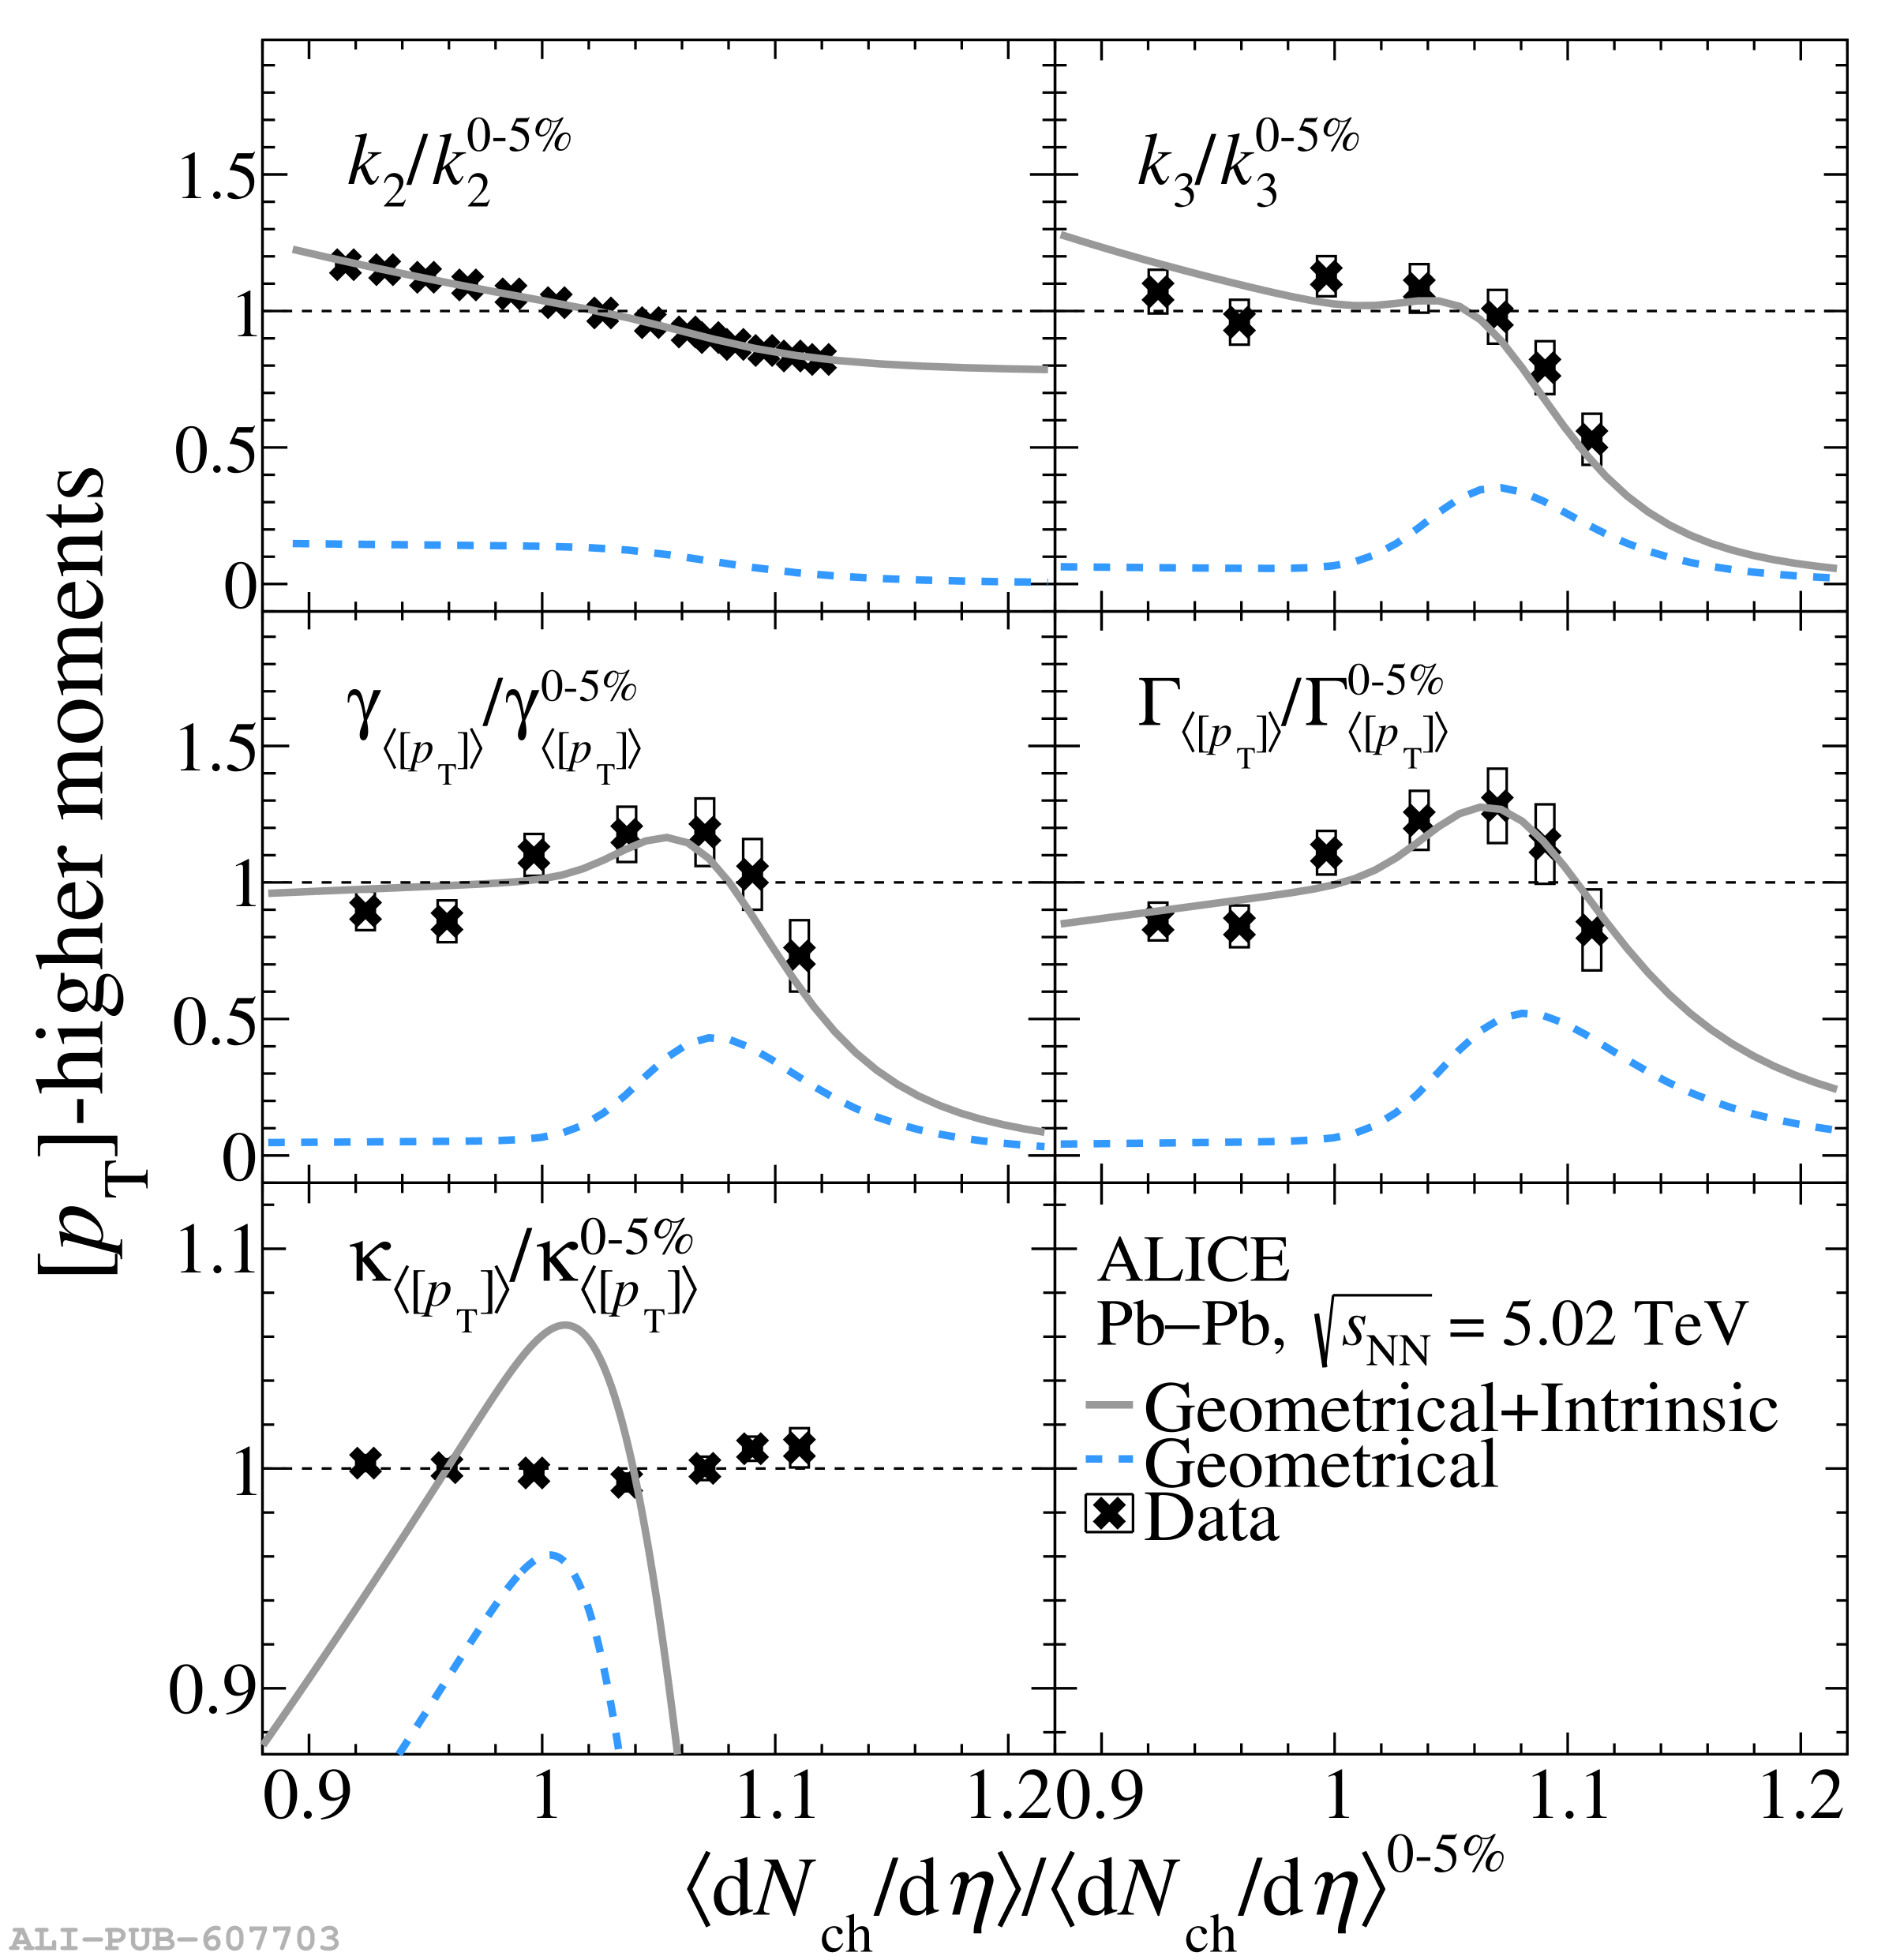 |