\ptnorm as a function of \dndetanorm. Results are shown for two centrality estimators: one based on transverse energy (black diamonds) and the other based on charged-particle multiplicity (red crosses). For the \nch-based centrality estimator, two values of \scs are extracted using non-overlapping fit ranges (dashed-lines). The \ptnorm versus \dndetanorm correlation for the \et-based centrality estimator corresponds to the centrality definition labeled as IV in Table ???. | 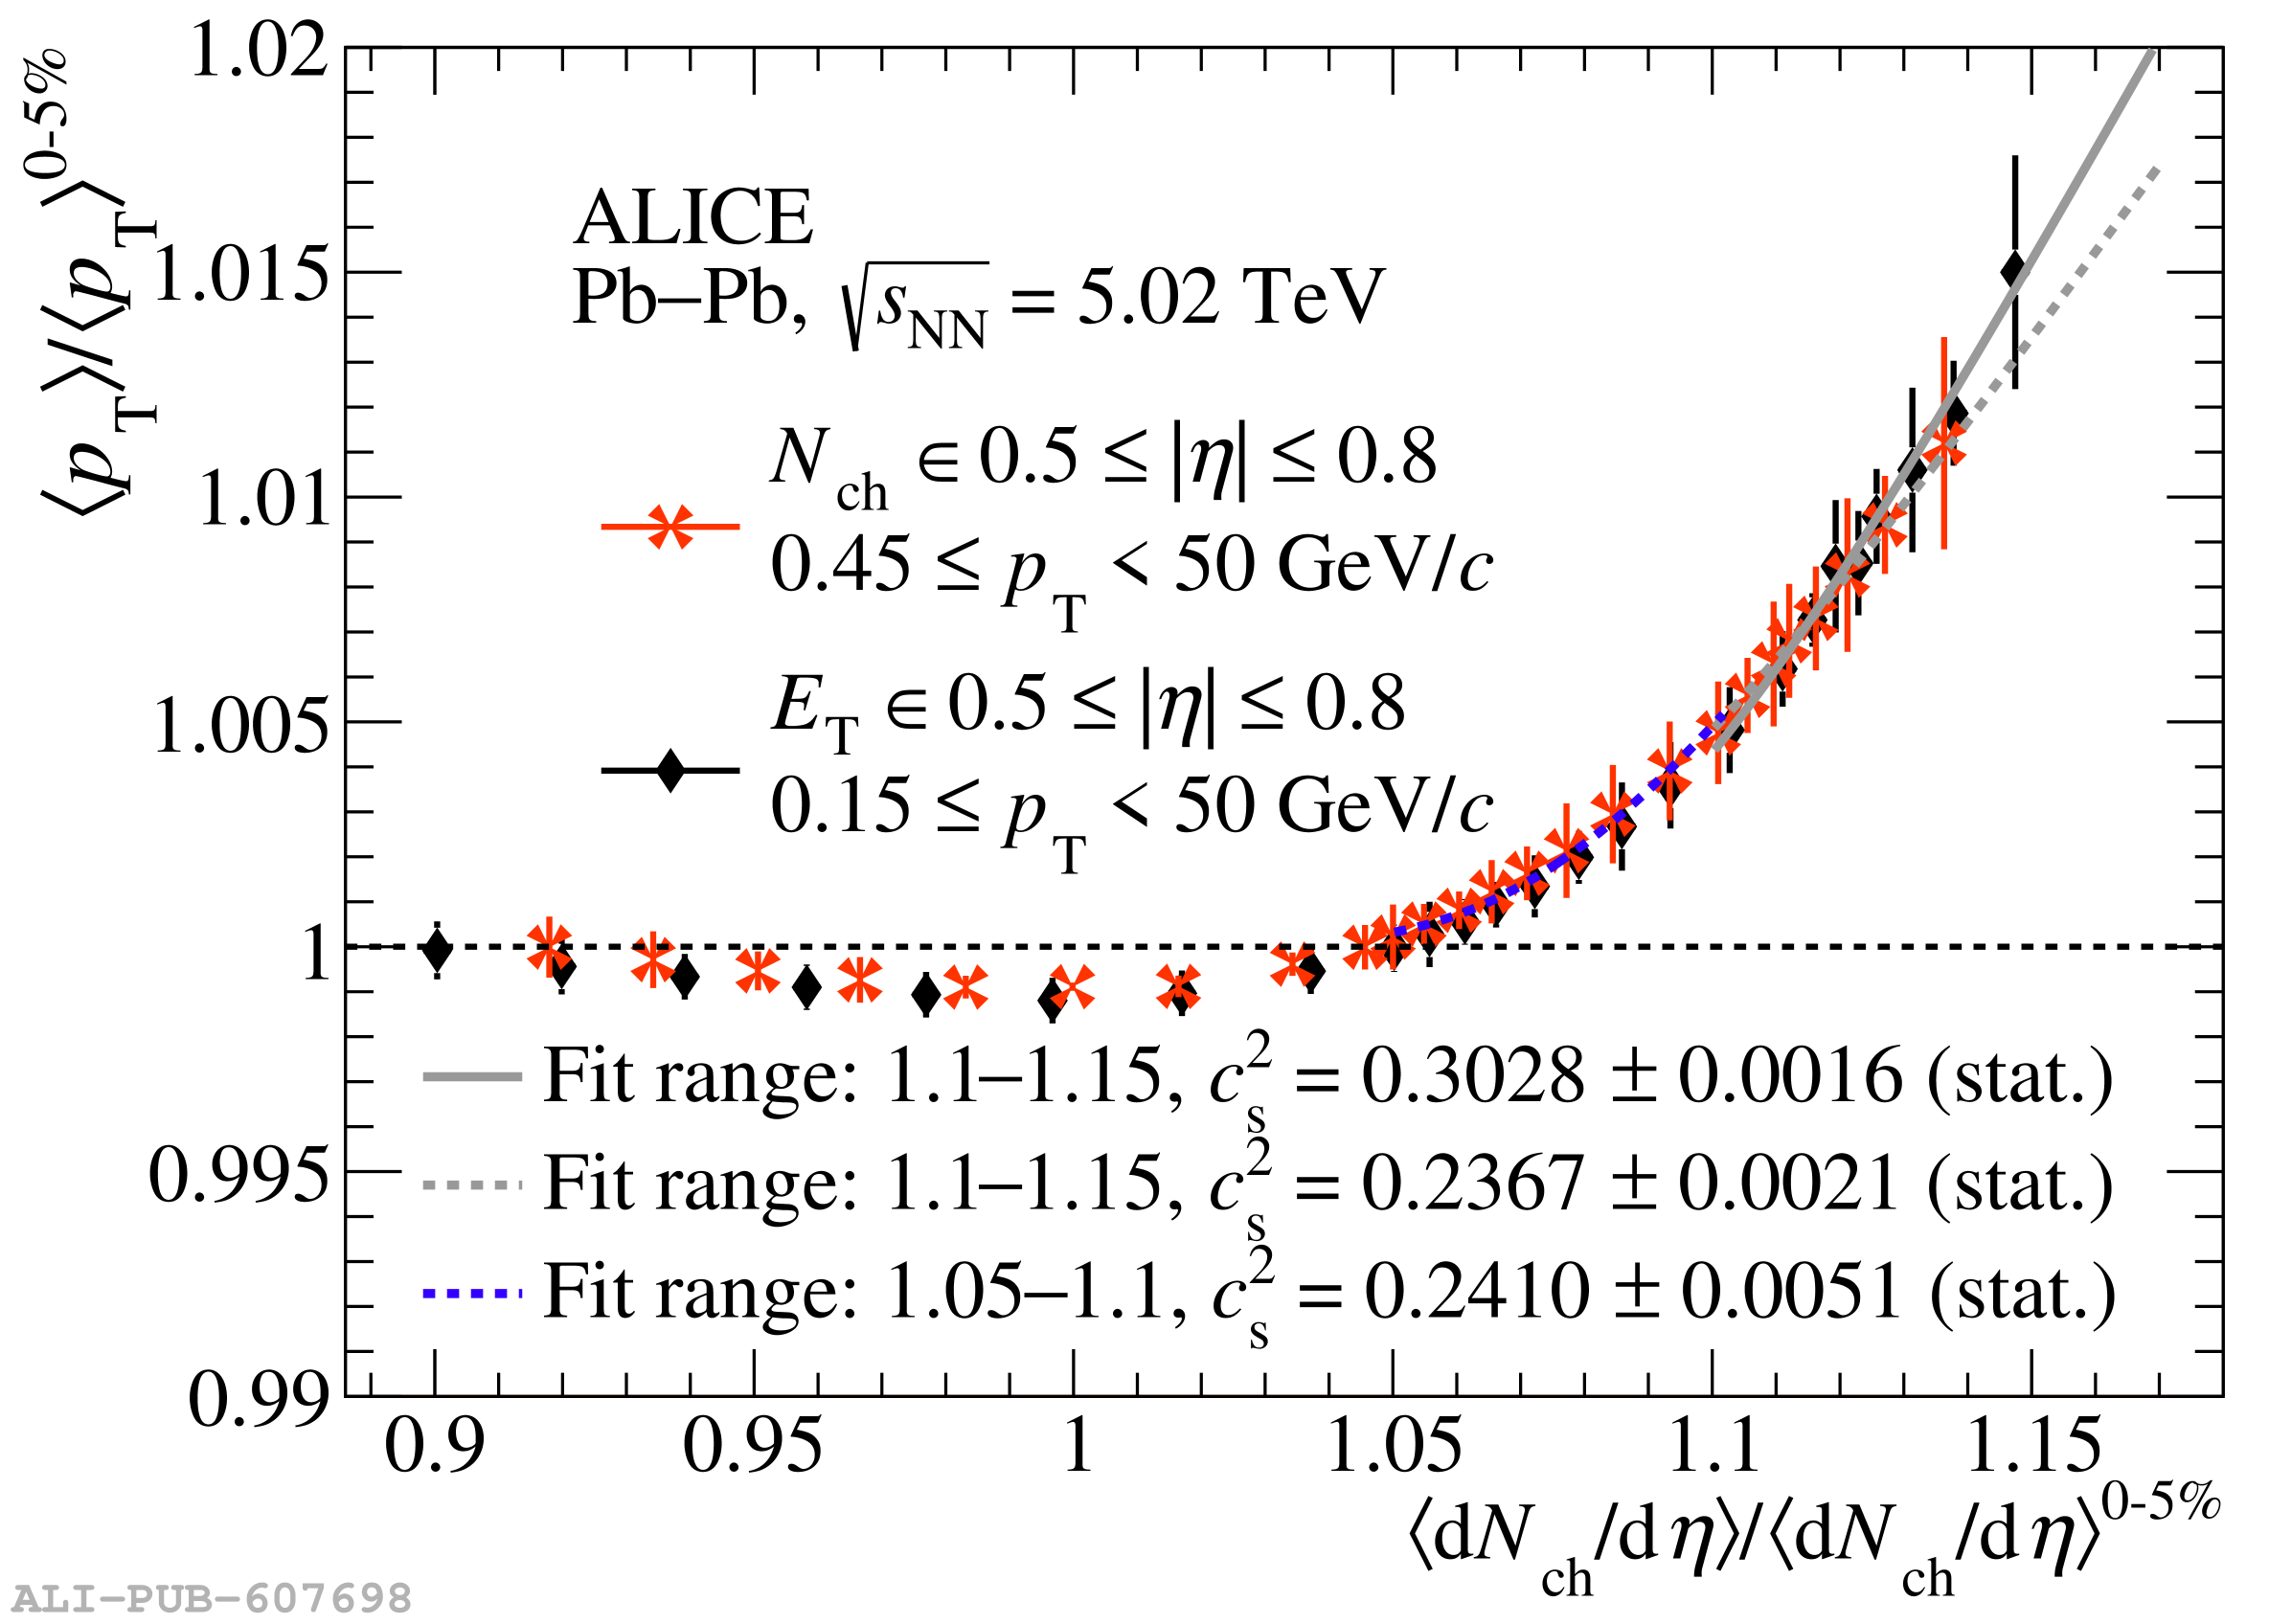 |