Correlation between \ptnorm and \dndetanorm in \PbPb collisions at \fivenn. Each panel shows the results for different centrality estimators defined in Table \ref{tab:centrality_definition}. The data are compared with predictions from the HIJING and Trajectum models, represented by continuous and dashed lines, respectively. The bands around the Trajectum predictions represent the sum in quadrature of the statistical and systematic uncertainties, with the latter being the dominant source. For the HIJING predictions, only the statistical uncertainty is shown (not visible in the plot). | 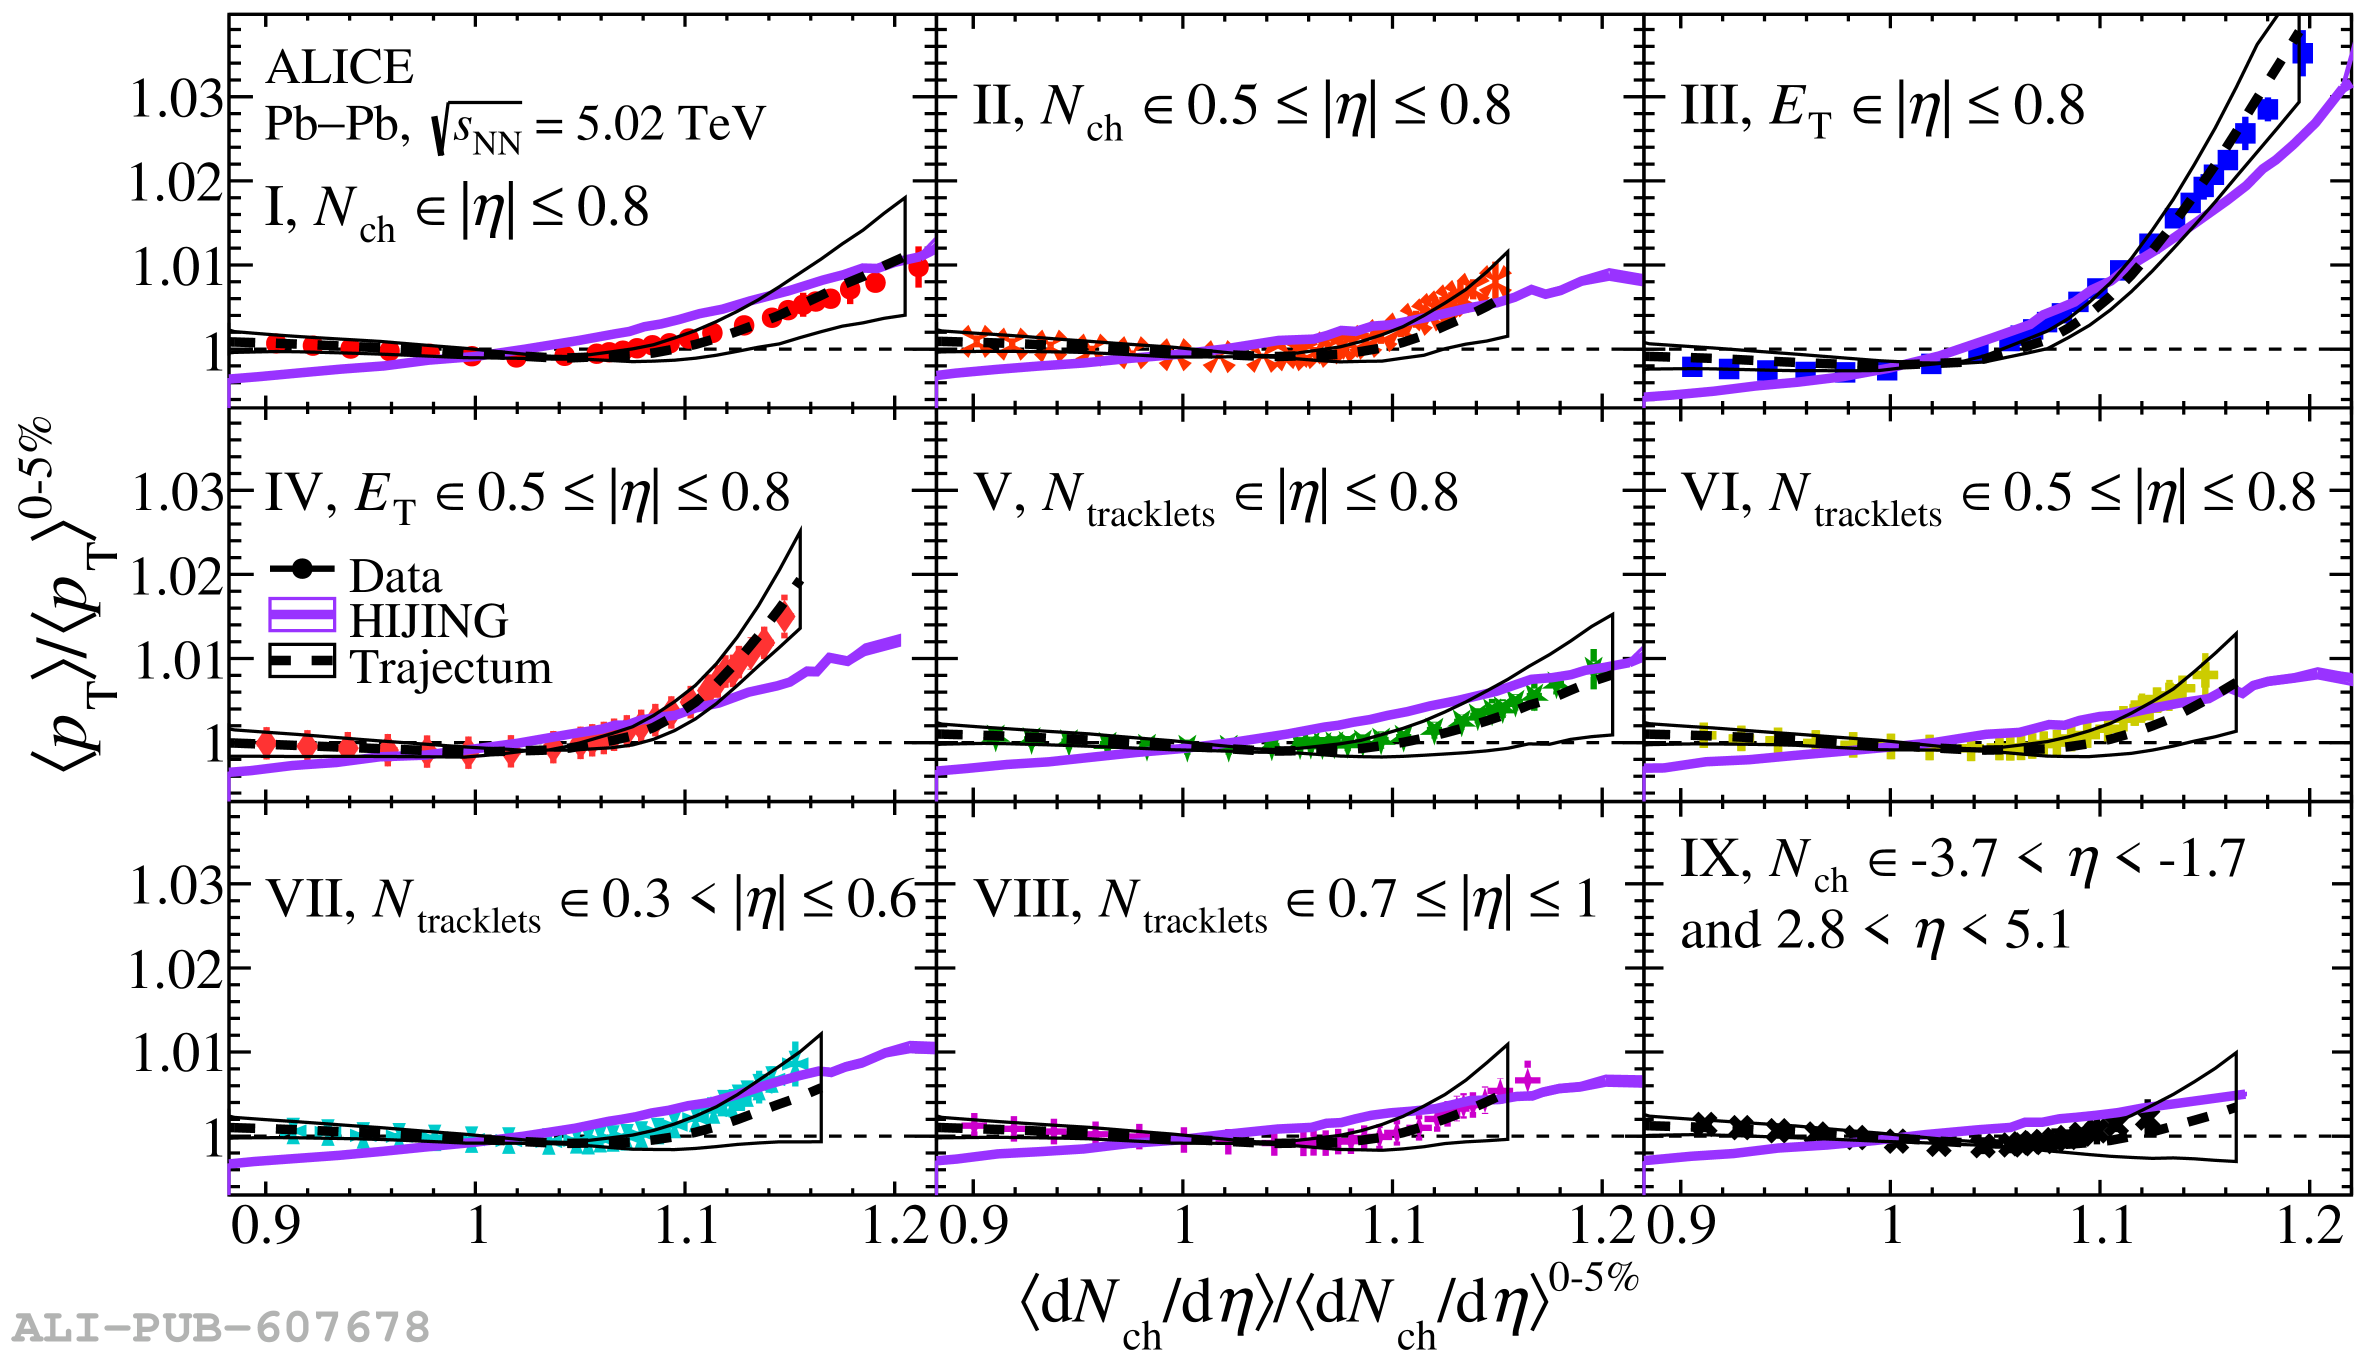 |