Higher-order moments of $[\pt]$ measured for events selected with the \VZERO centrality estimator (IX) in \PbPb collisions at \fivenn. The \ktwnorm distribution is fitted with a two-component model (continuous gray line), where the estimated Geometrical component is also show (dotted-dashed blue line) . The curves for the \kthnorm, \stdsknorm, \intsknorm, and \kunorm distributions correspond to predictions based on the fit of \ktwnorm . | 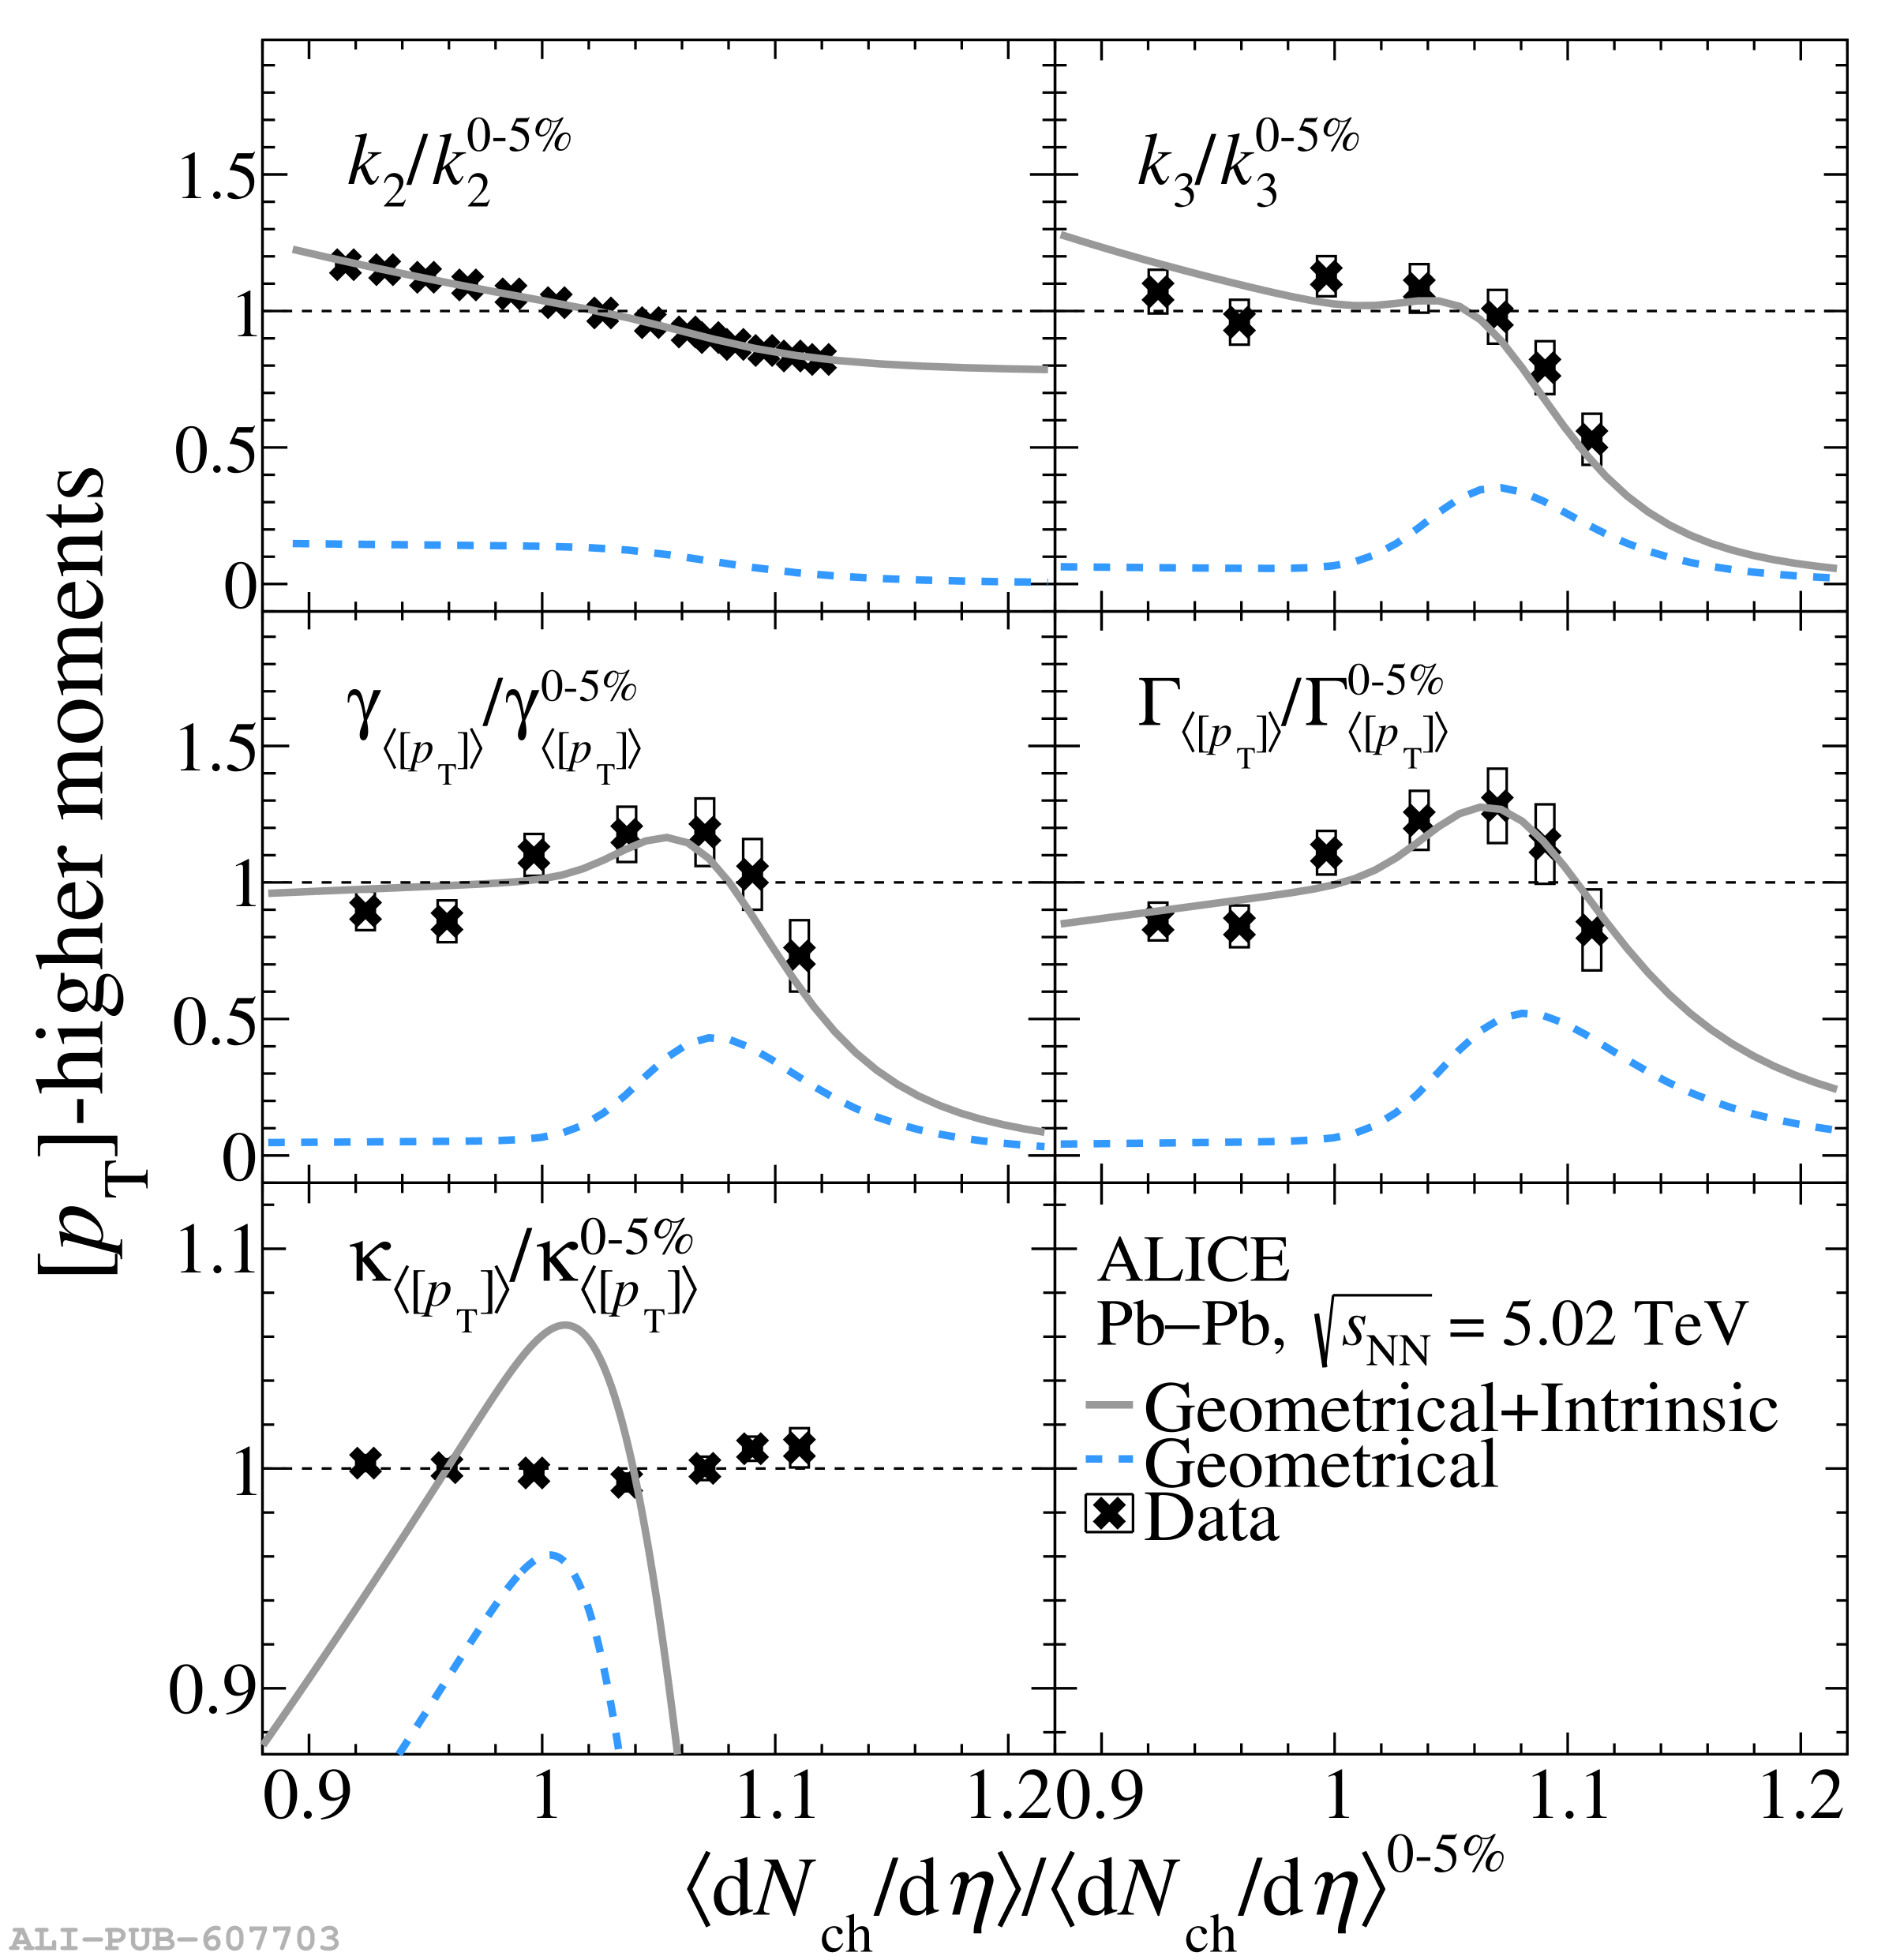 |