Event fraction distribution as a function of the normalized charged-particle density in \PbPb collisions at \fivenn. Centrality classification is based on \nch (red circles) and \et (blue squares) in $|\eta|\leq0.8$, and on forward \nch for the \VZERO (black crosses). \dndetanorm is derived from the extrapolated spectra in $|\eta|\leq0.8$. Gray curves represent fits using the model from Ref. . The positions of \dndetanormknee, indicated by dashed vertical lines, are 1.137, 1.120, and 1.111 for the \nch-, \et-, and \VZERO-based centrality estimators, respectively. | 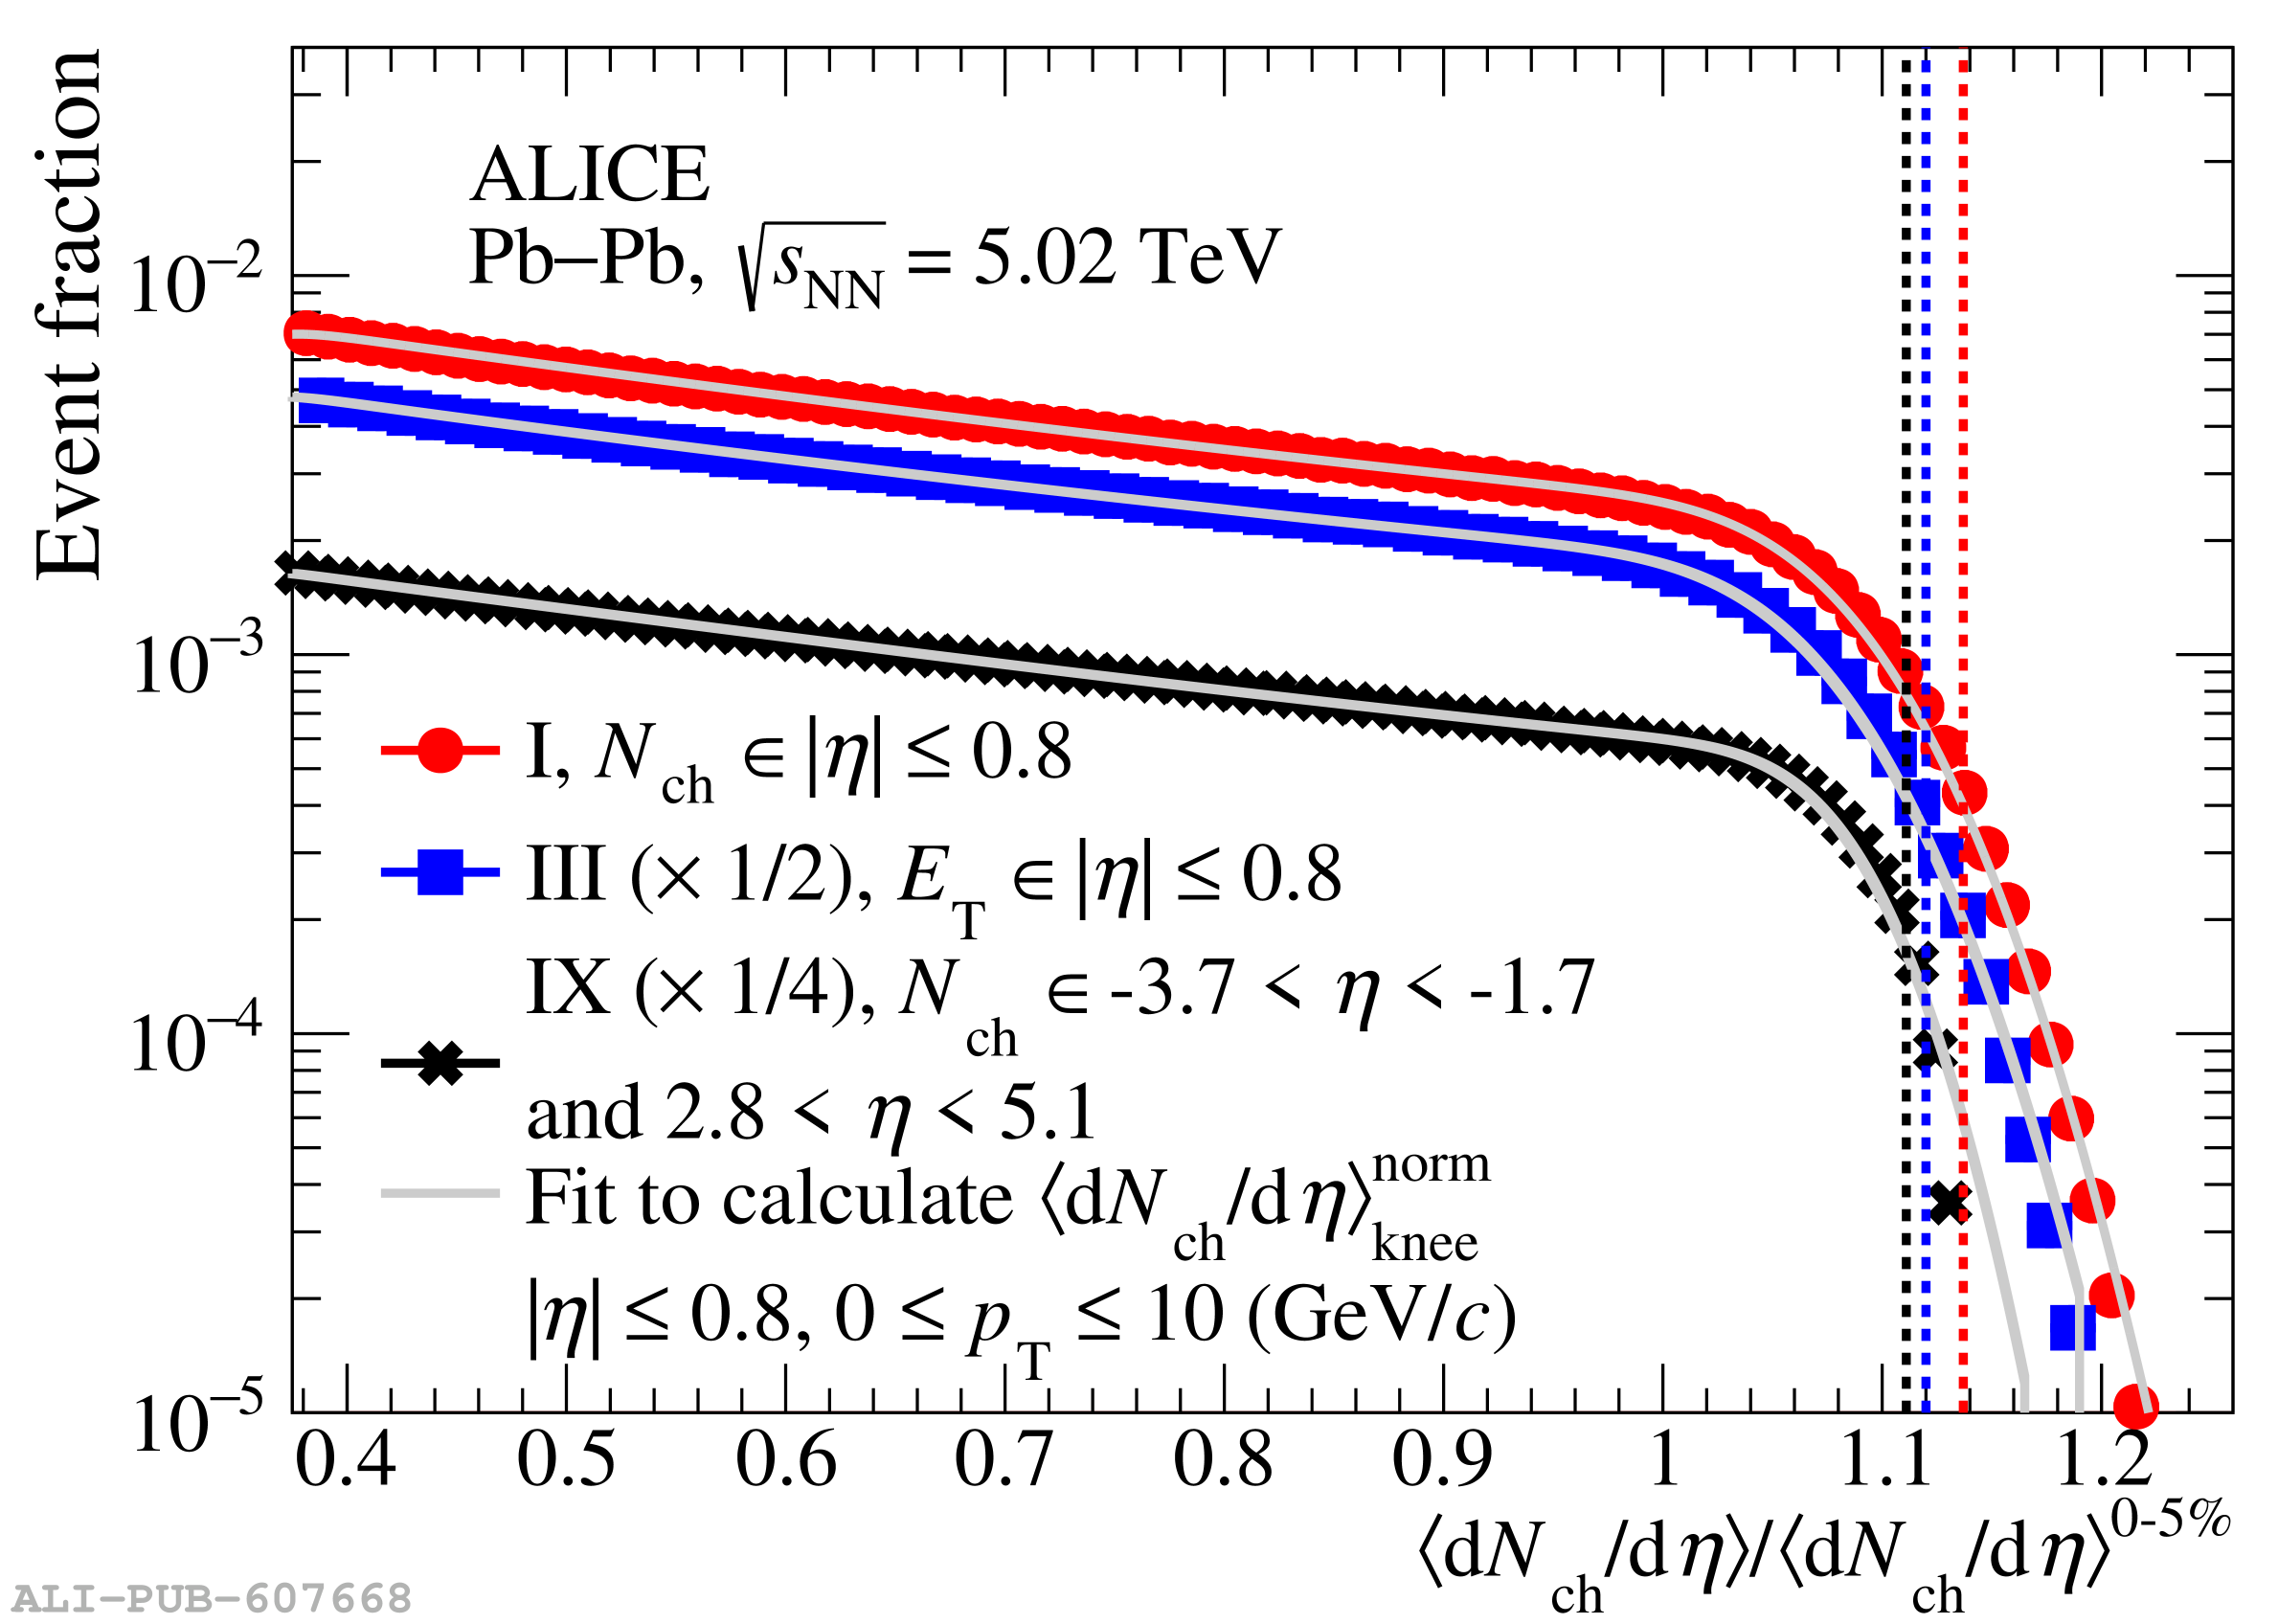 |