Data-driven precision determination of the material budget in ALICE

The knowledge of the material budget with a high precision is fundamental for measurements of direct photon production using the photon conversion method due to its direct impact on the total systematic uncertainty. Moreover, it influences many aspects of the charged-particle reconstruction performance. In this article, two procedures to determine data-driven corrections to the material-budget description in ALICE simulation software are developed. One is based on the precise knowledge of the gas composition in the Time Projection Chamber. The other is based on the robustness of the ratio between the produced number of photons and charged particles, to a large extent due to the approximate isospin symmetry in the number of produced neutral and charged pions. Both methods are applied to ALICE data allowing for a reduction of the overall material budget systematic uncertainty from 4.5% down to 2.5%. Using these methods, a locally correct material budget is also achieved. The two proposed methods are generic and can be applied to any experiment in a similar fashion.


JINST 18 (2023) P11032
e-Print: arXiv:2303.15317 | PDF | inSPIRE
CERN-EP-2023-043
Figure group

Figure 1

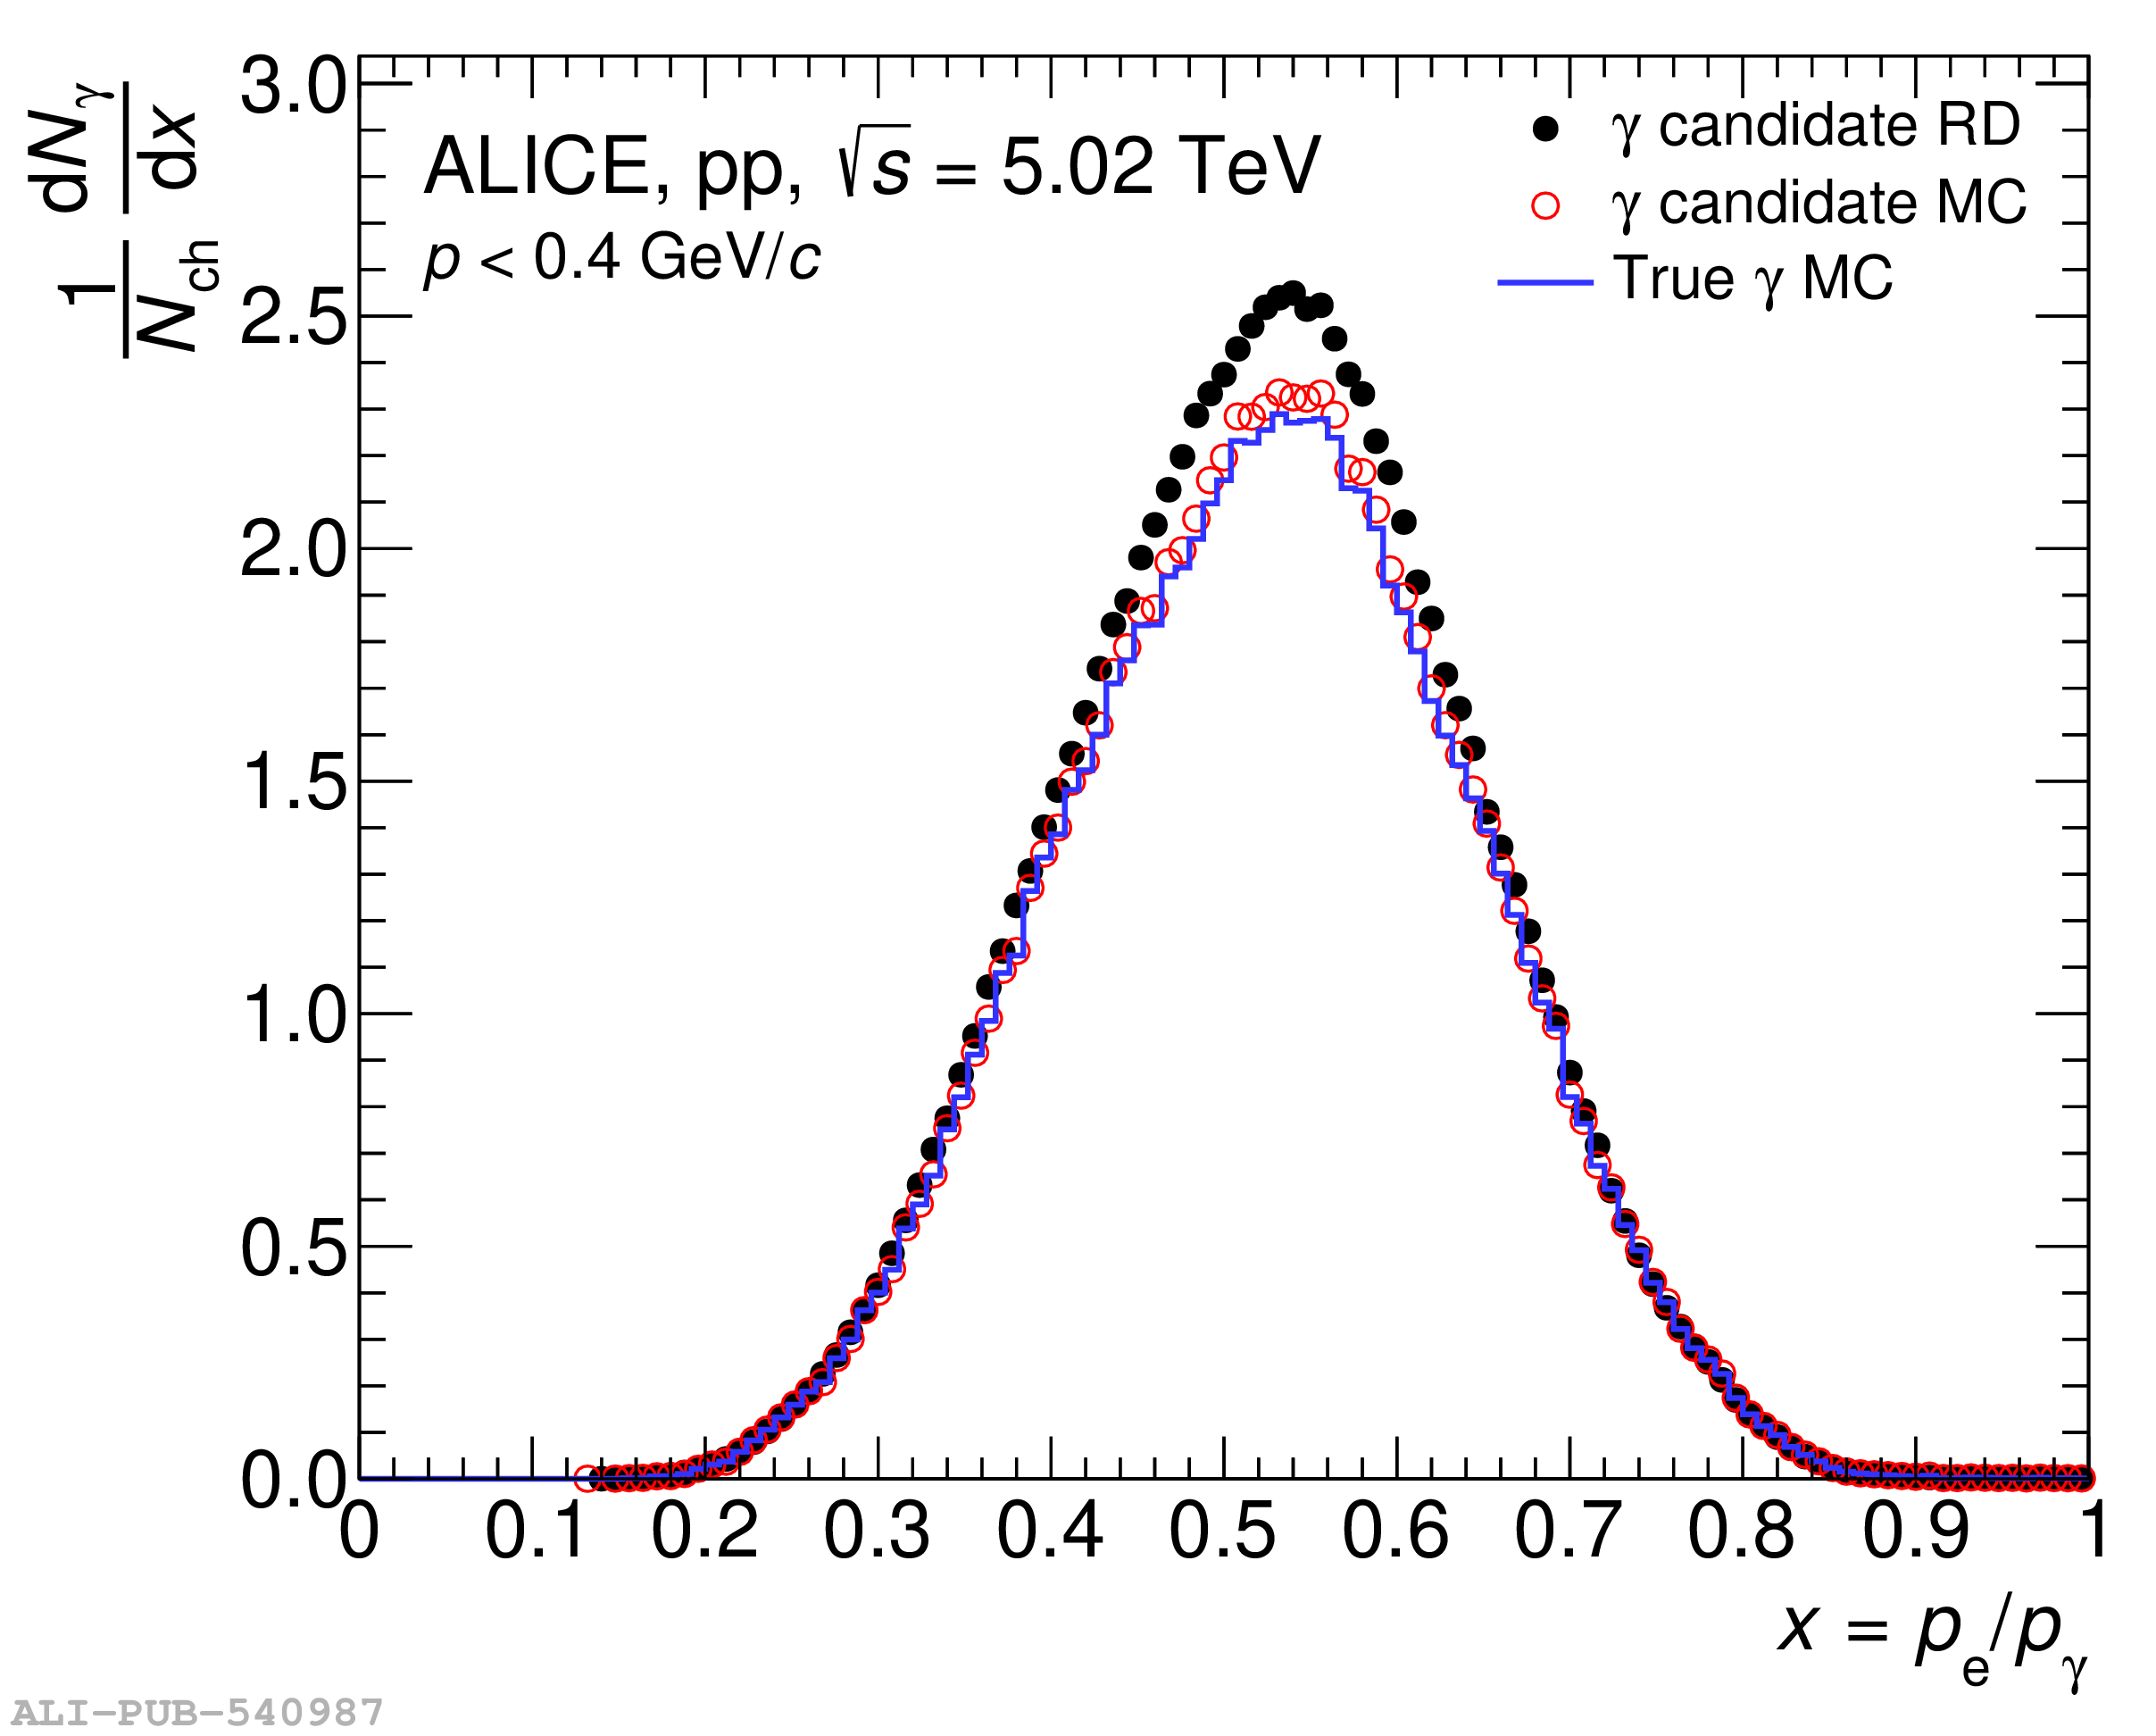
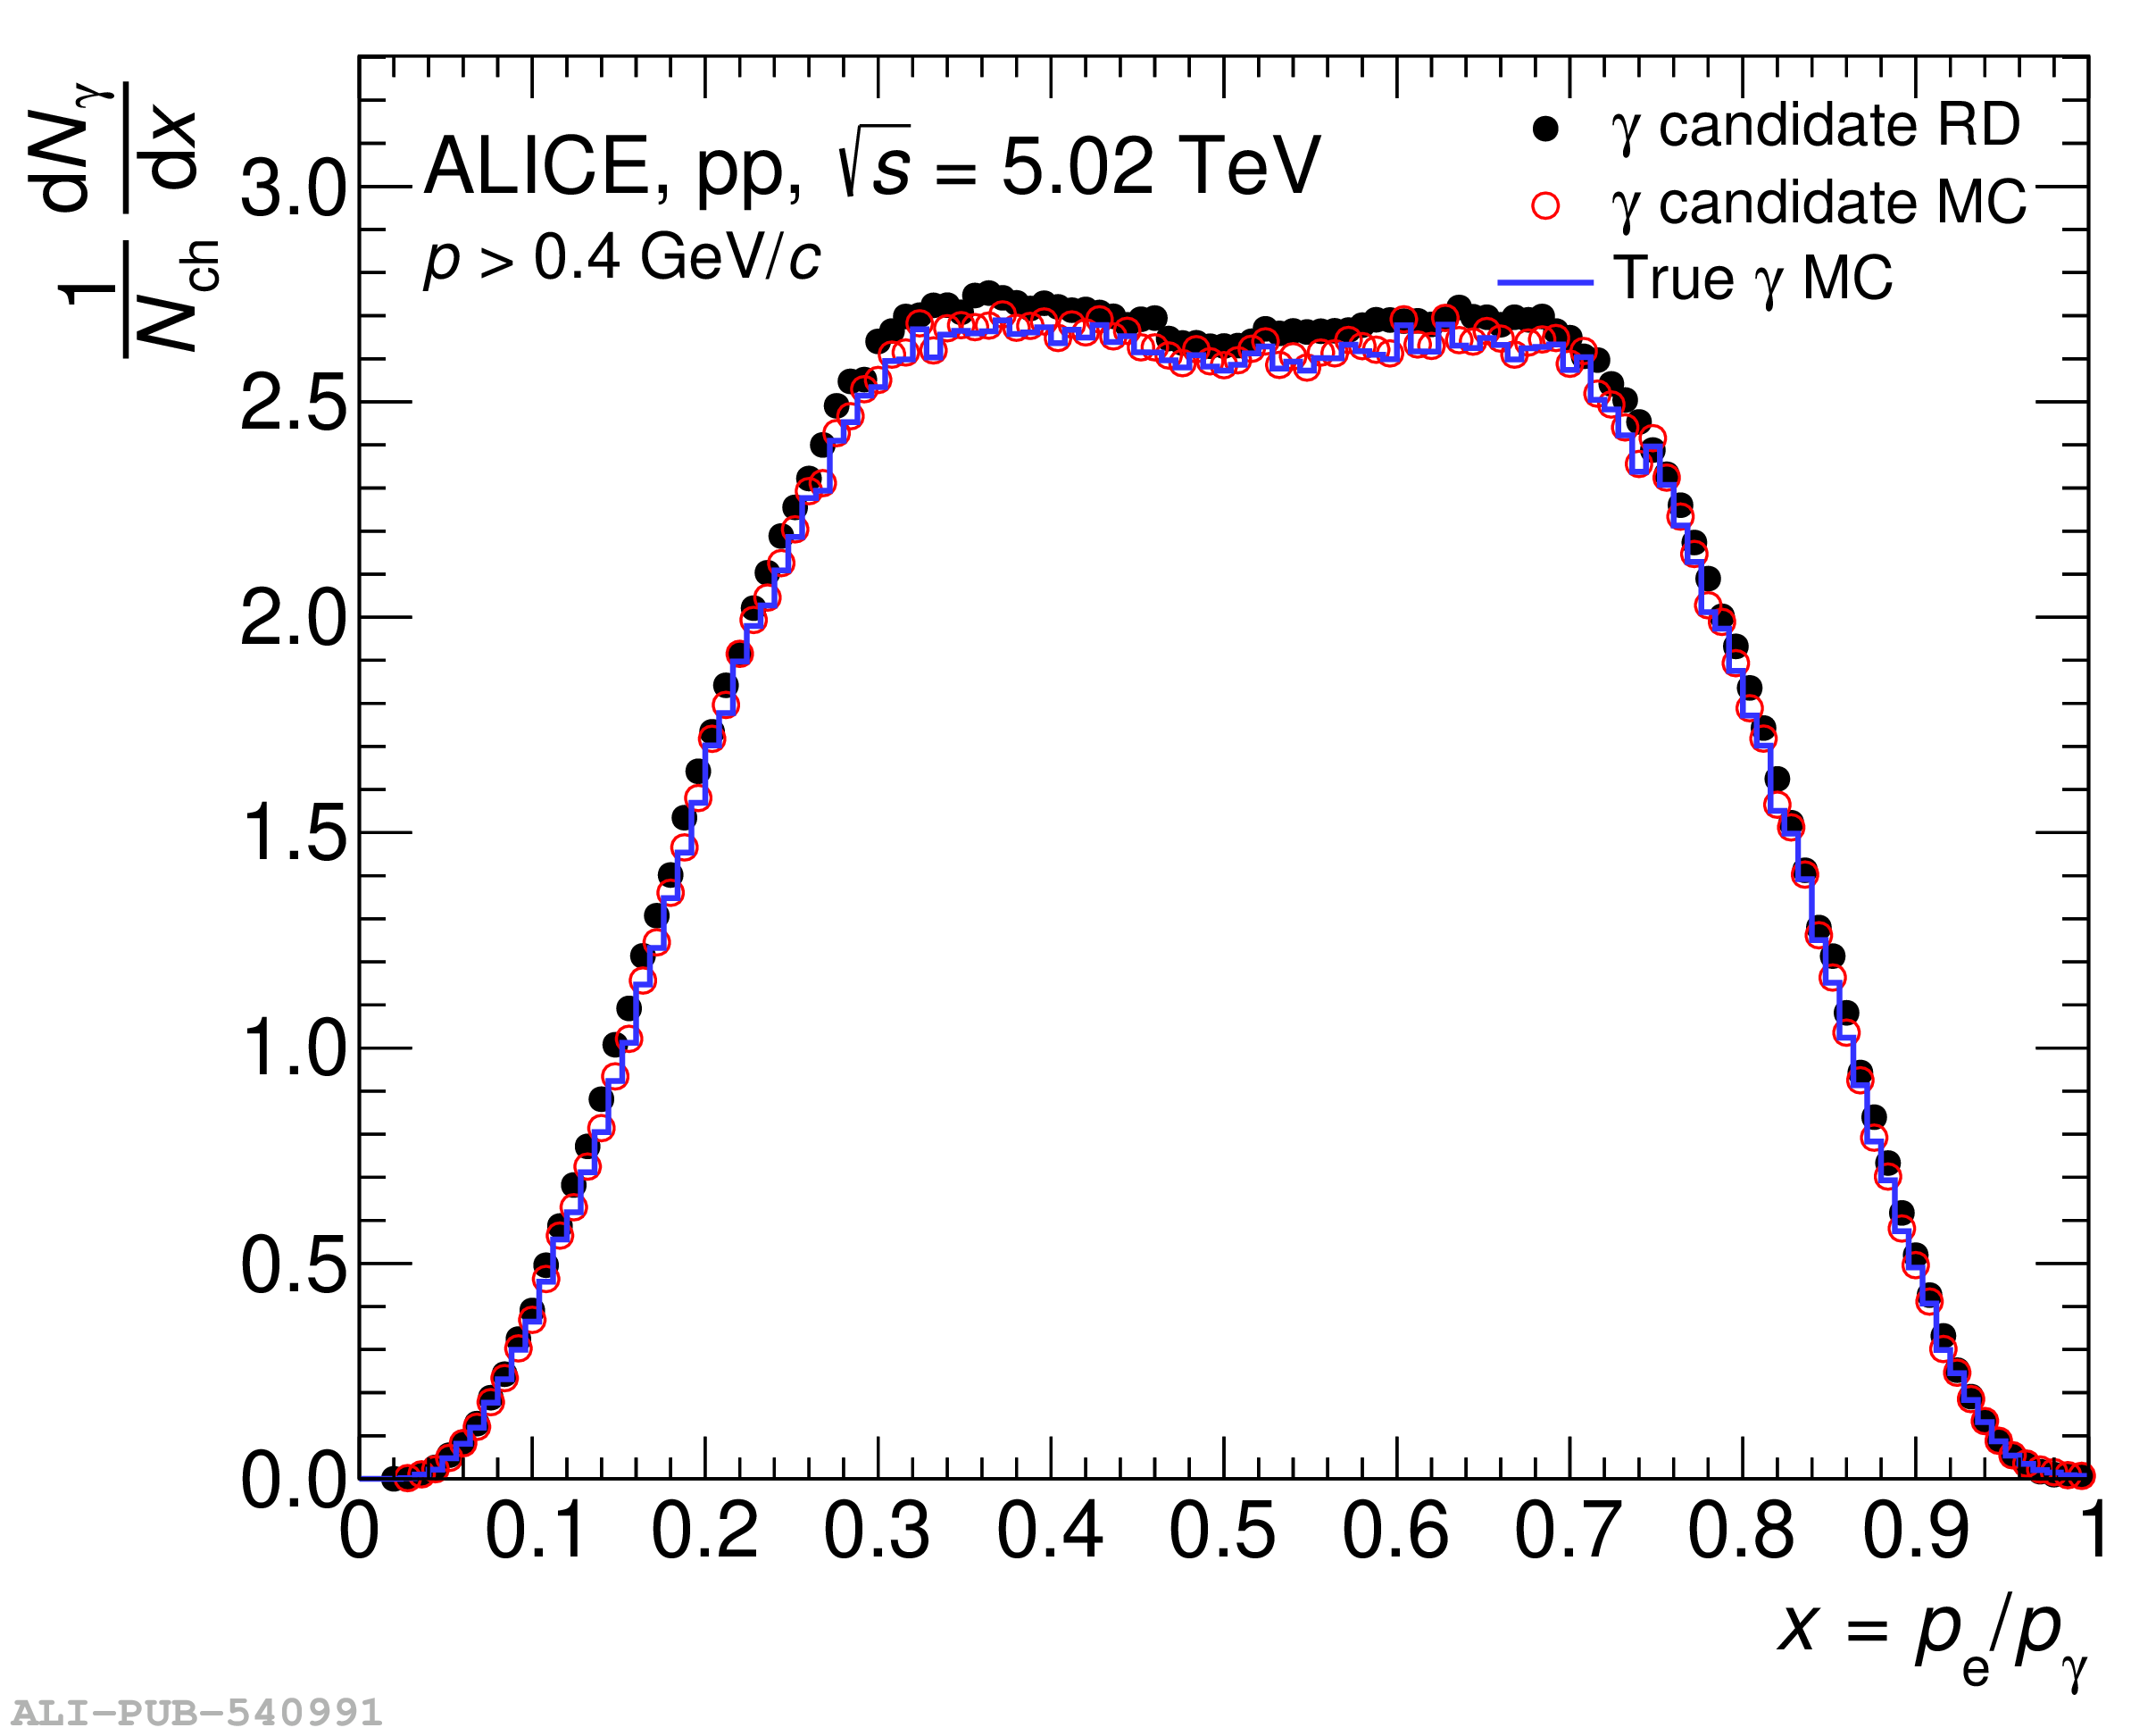
Distribution of the electron fractional energy ($x$) for photon candidates with $p<0.4$ GeV/$c$ (left) and with $p>0.4$ GeV/$c$ (right) reconstructed in real data (black points), in Monte Carlo simulations (red points), and for verified photons in MC simulations (blue lines) where PYTHIA8 is used as input event generator.

Figure 2

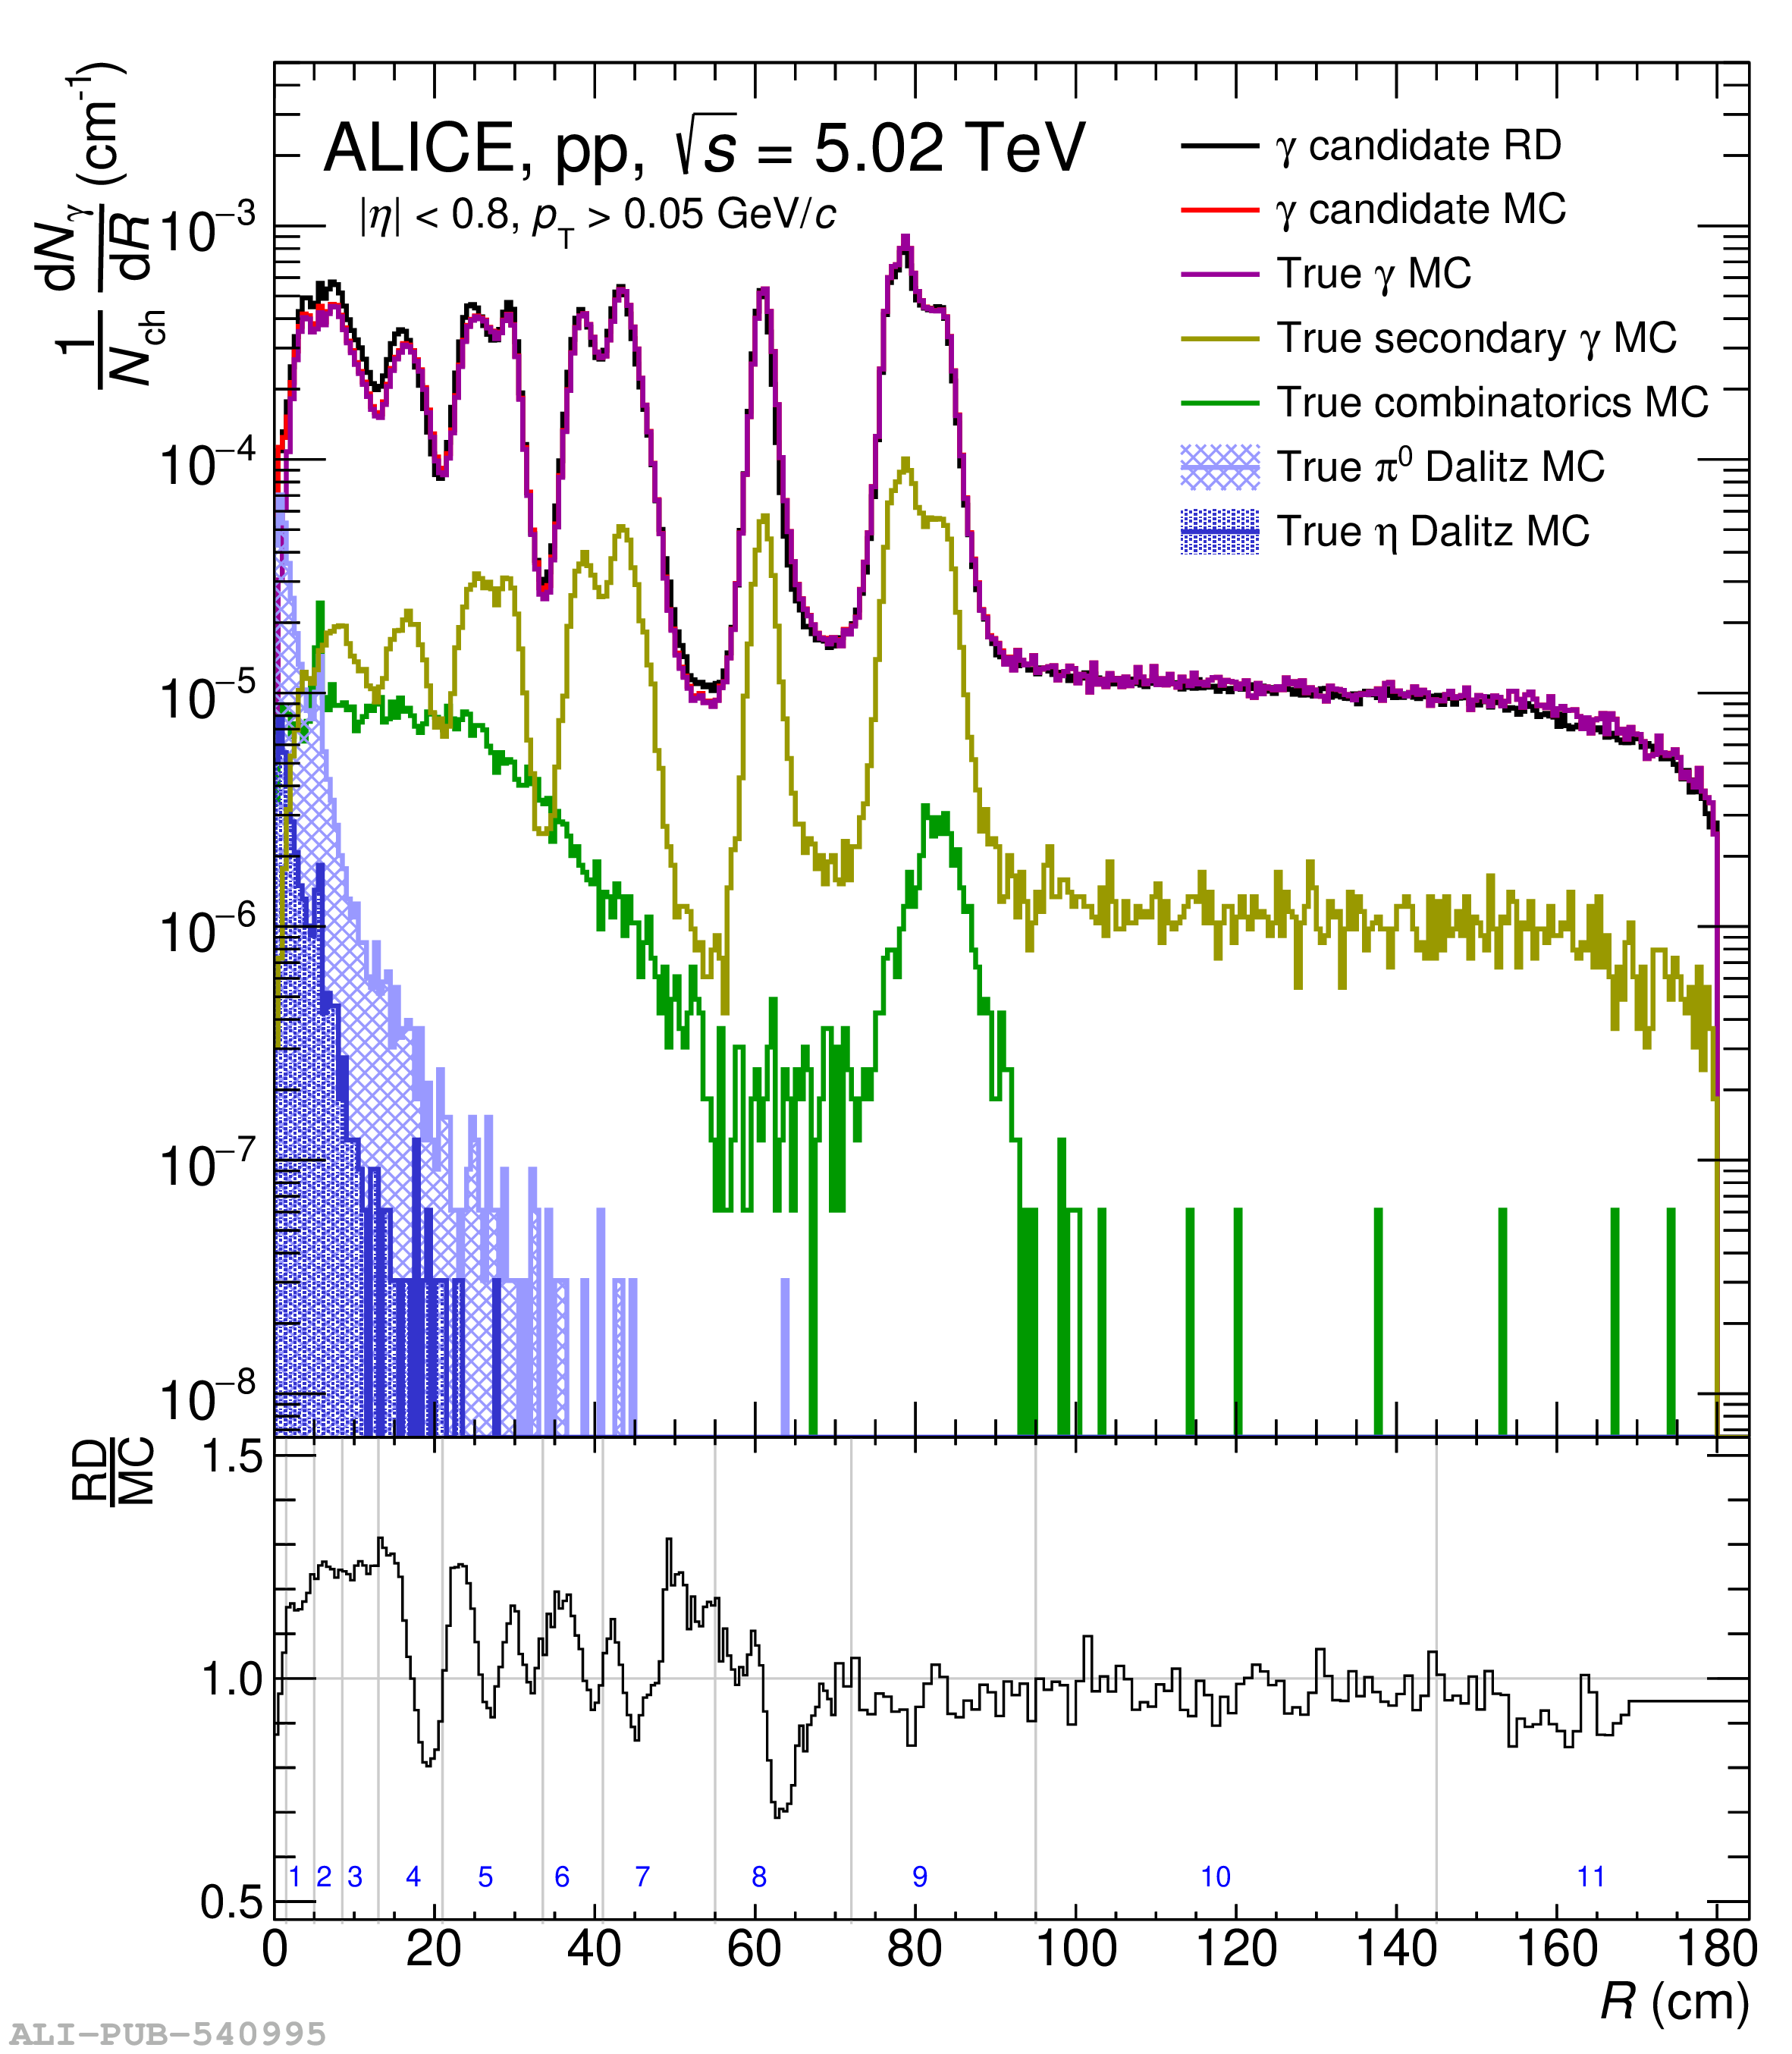
(Top) Radial distributions of reconstructed photon vertices in experimental data and in MC simulations are shown as black and red lines, respectively. Using the full MC information contributions from true photons (purple line), secondary photons (olive line), and combinatorial pairs (green line) are identified. The e$^+$e$^-$ pairs from $\pi^0$ (or $\eta$) Dalitz decays, wrongly identified as photon conversions, are depicted as blue shaded areas. (Bottom) Ratio of the radial distribution of reconstructed photon vertices in RD (black line) and MC (red line). Vertical lines in grey and blue numbers indicate the twelve radial intervals and their respective indices used in the analysis.

Figure 3

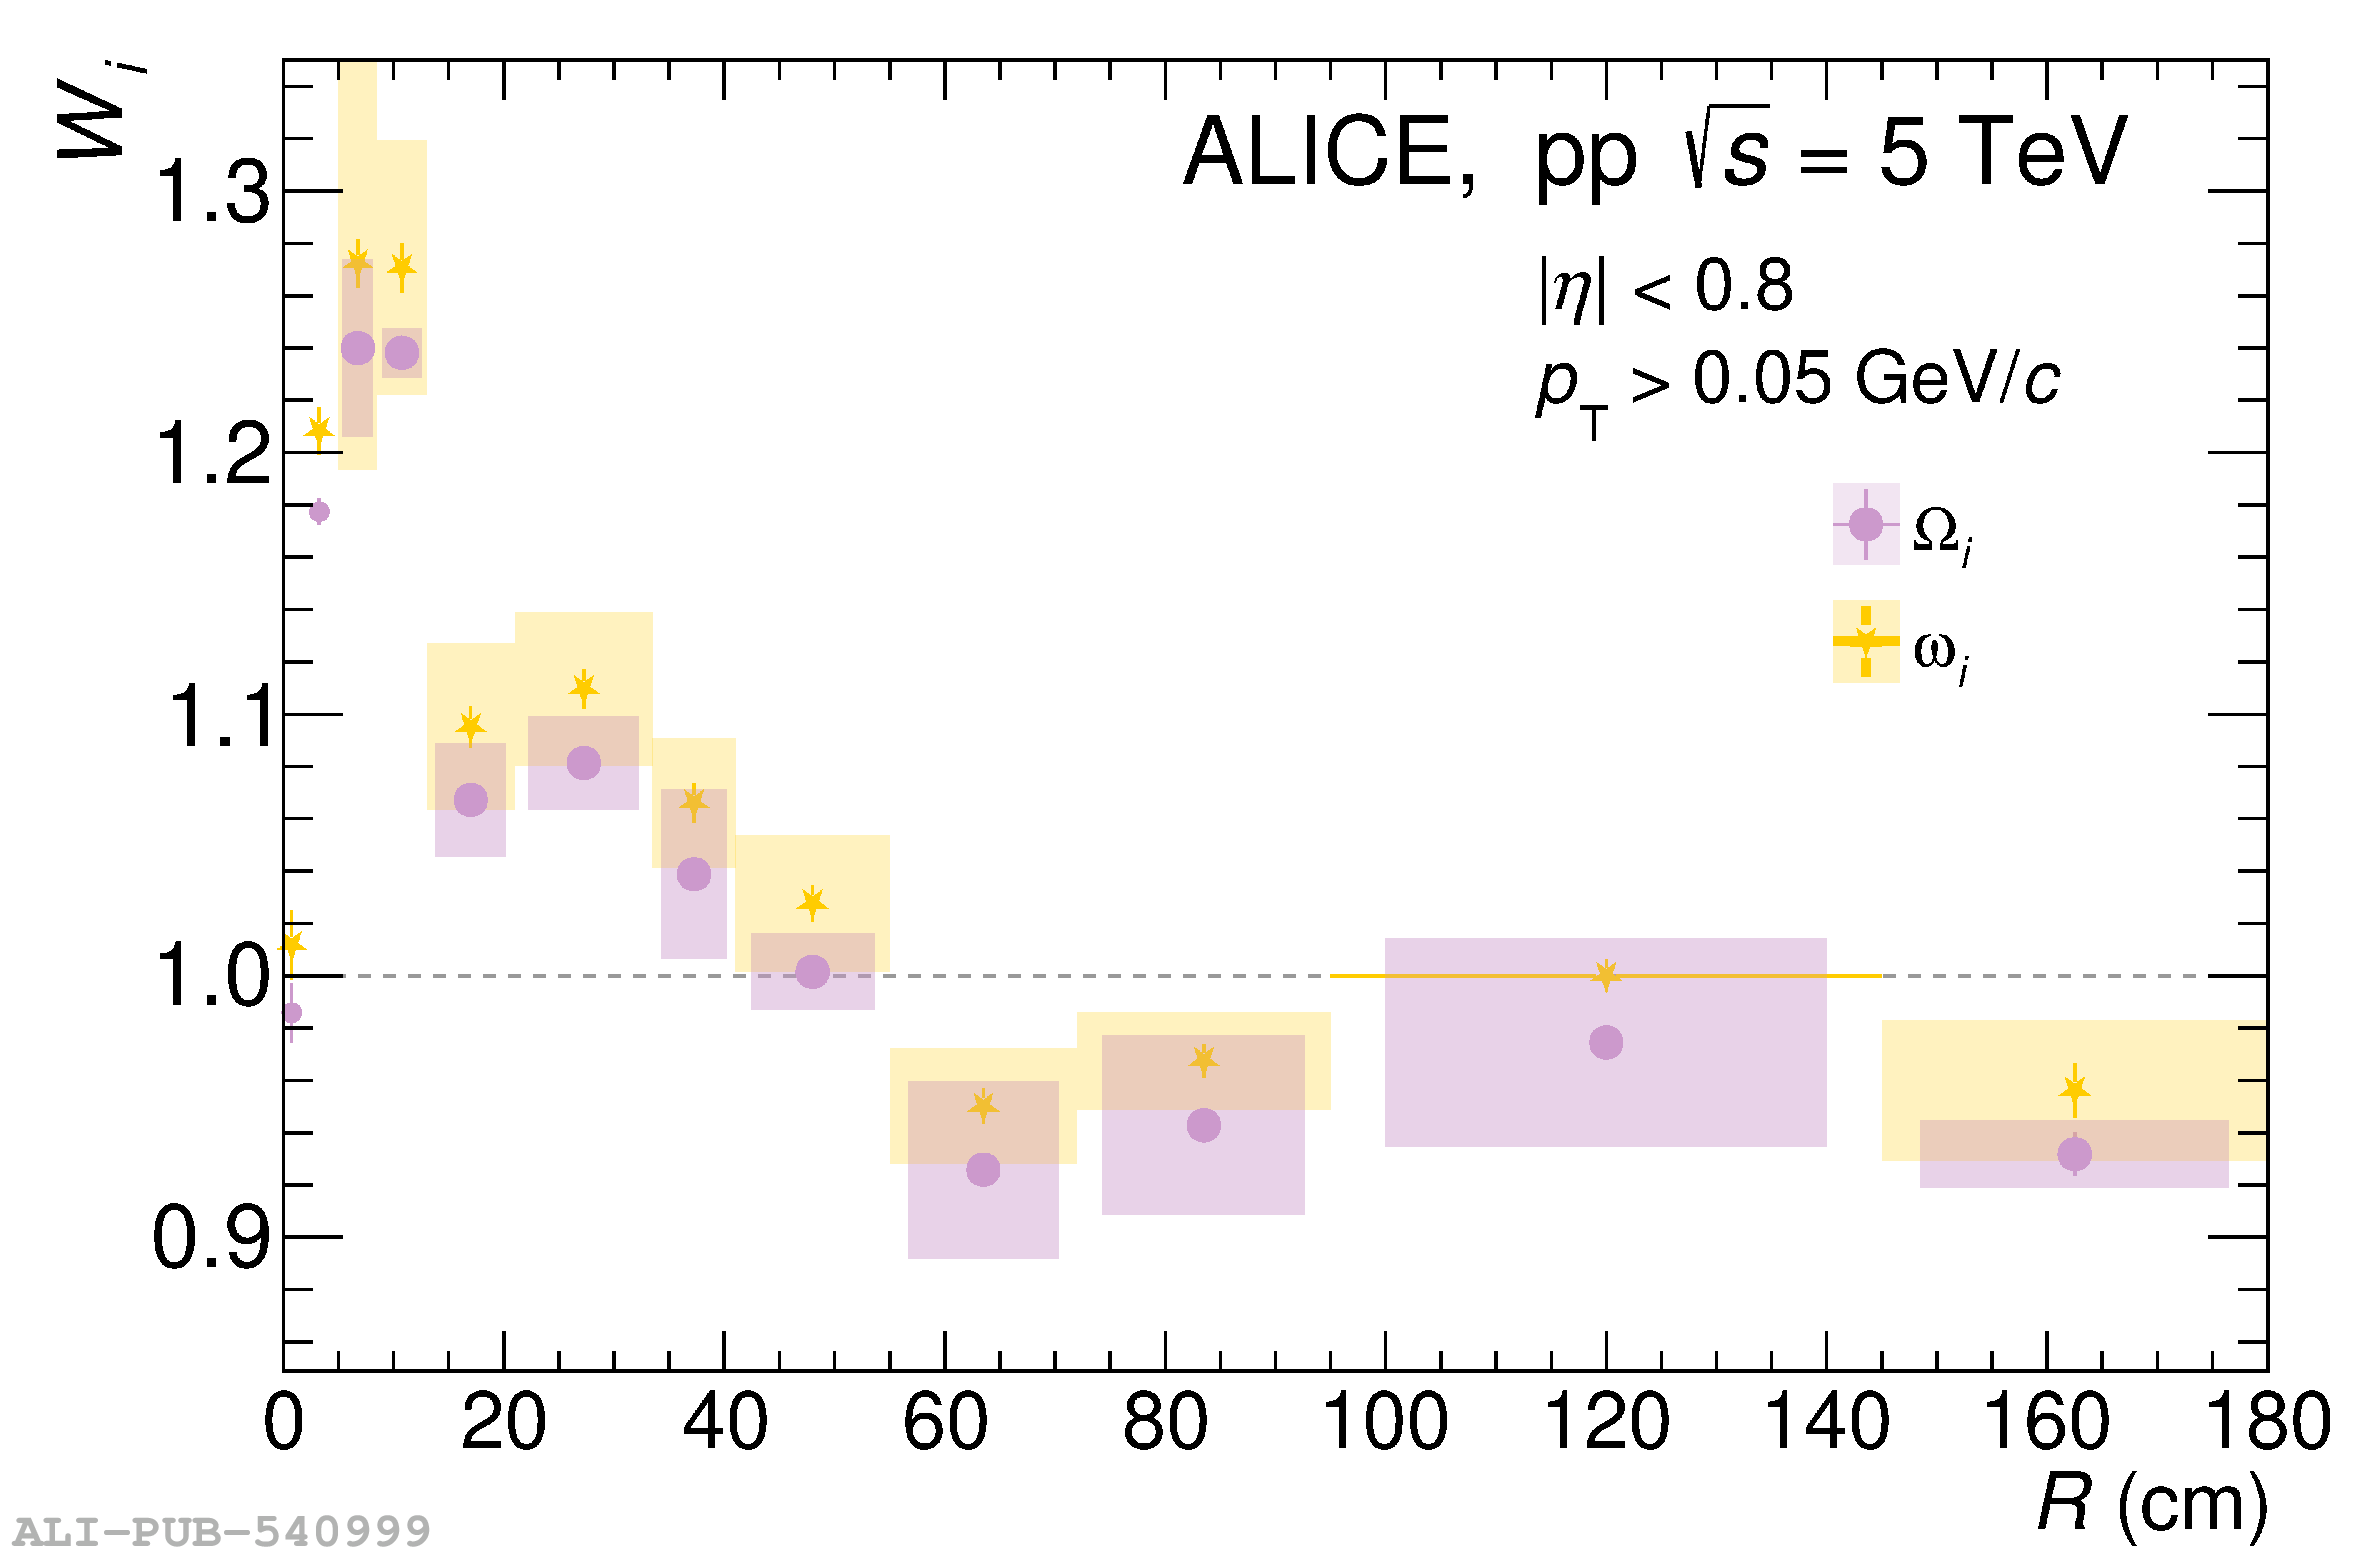
Distribution of the weights ${\Omega}_i$ and $\omega_i$ as a function of the radial position of the conversion point. Statistical uncertainties are given by the vertical bars, and systematic uncertainties are depicted by shaded areas, except for the first two intervals where only statistical uncertainties are quoted. Notice the zero $\omega_i$ systematic uncertainty in the calibration intervals (95 cm$< R< $ 145 cm), thusan horizontal line is drawn displaying the radial interval. The width in spatial direction of the uncertainty box for the $\Omega_i$ was shrunk for better visibility.

Figure 4

Zero-order polynomial fits to the ratio of neutral to charged pion transverse momentum distributions above 1 GeV/$c$ when the two photons (PCM-PCM, $\pi^0\rightarrow \gamma \gamma$) or one photon (PCM-Dalitz, $\pi^0\rightarrow e^+e^-\gamma $) are selected within the given radial interval. The open symbols are obtained with efficiency corrections using the default MC , while the full symbols are obtained when the $\Omega_i$ calibration factors are used to weight the efficiency (see Eq. 1).

Figure 5

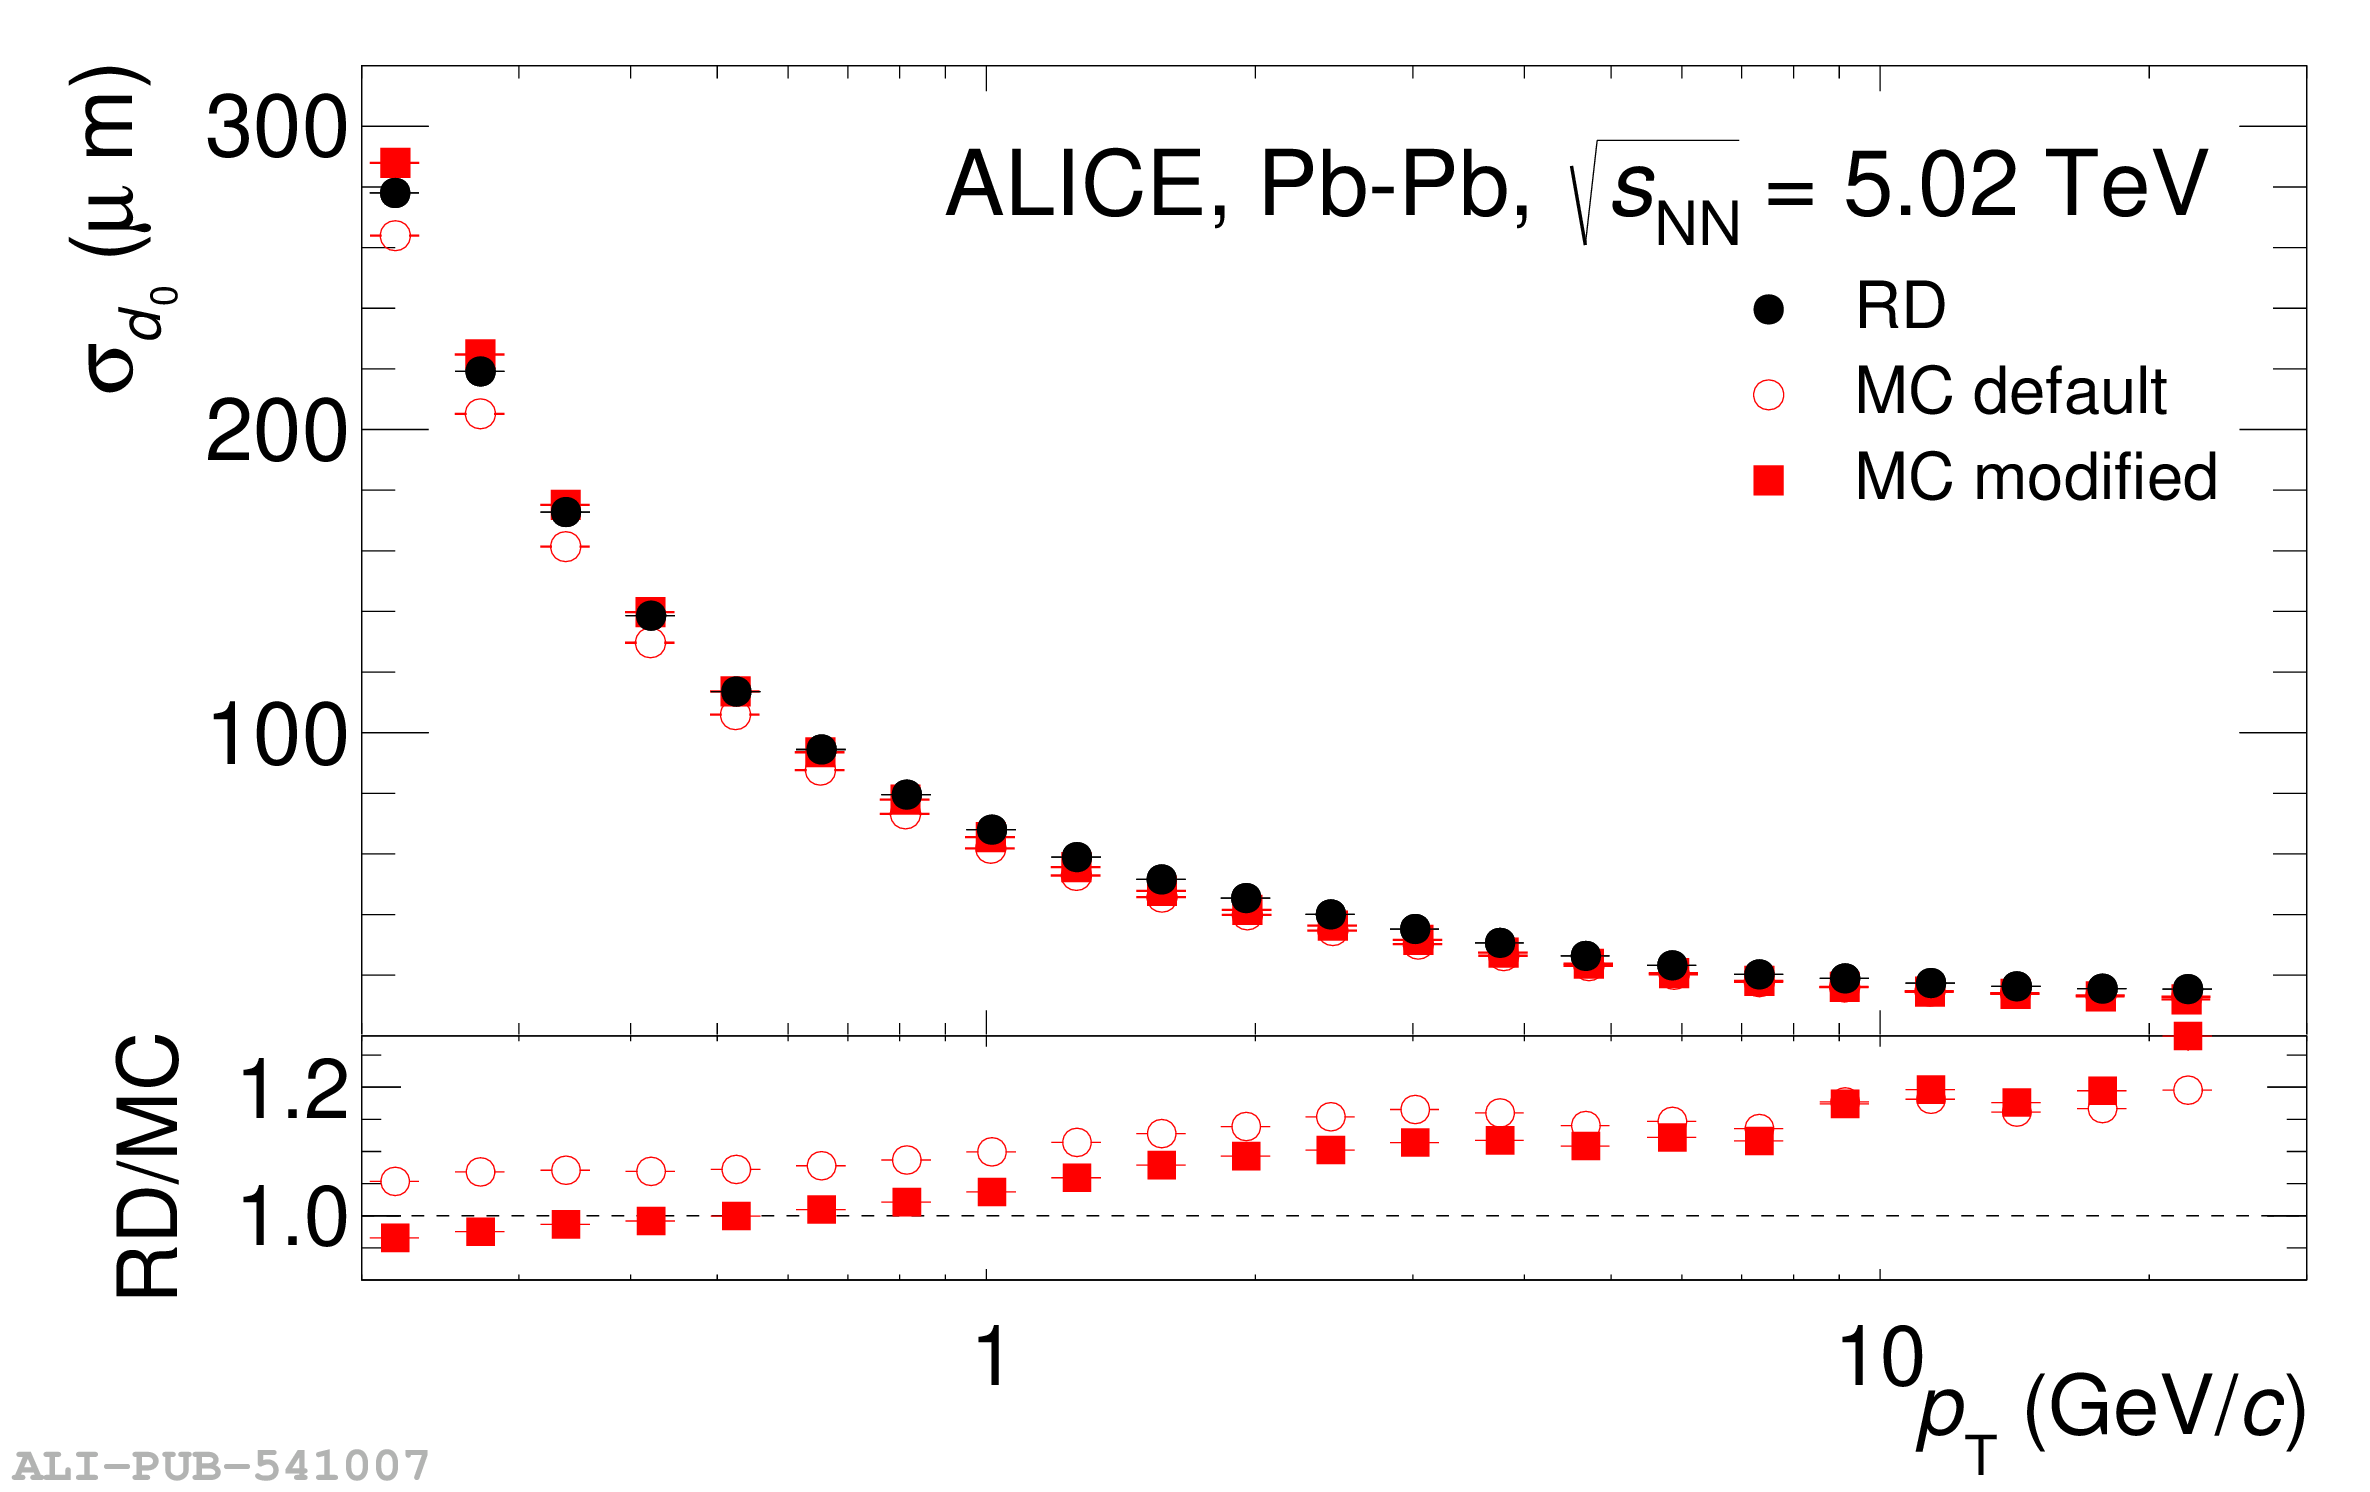
Top: Impact-parameter resolution of reconstructed charged particles requiring a hit in the first ITS pixel layer as a function of $\pT$ in RD, default MC, and modified MC with the correction factors as given in Table 3. Bottom: Ratio of impact-parameter resolution to the one in the default MC (open circles) and modified MC (squares).