(Top) Radial distributions of reconstructed photon vertices in experimental data and in MC simulations are shown as black and red lines, respectively. Using the full MC information contributions from true photons (purple line), secondary photons (olive line), and combinatorial pairs (green line) are identified. The e$^+$e$^-$ pairs from $\pi^0$ (or $\eta$) Dalitz decays, wrongly identified as photon conversions, are depicted as blue shaded areas. (Bottom) Ratio of the radial distribution of reconstructed photon vertices in RD (black line) and MC (red line). Vertical lines in grey and blue numbers indicate the twelve radial intervals and their respective indices used in the analysis. | 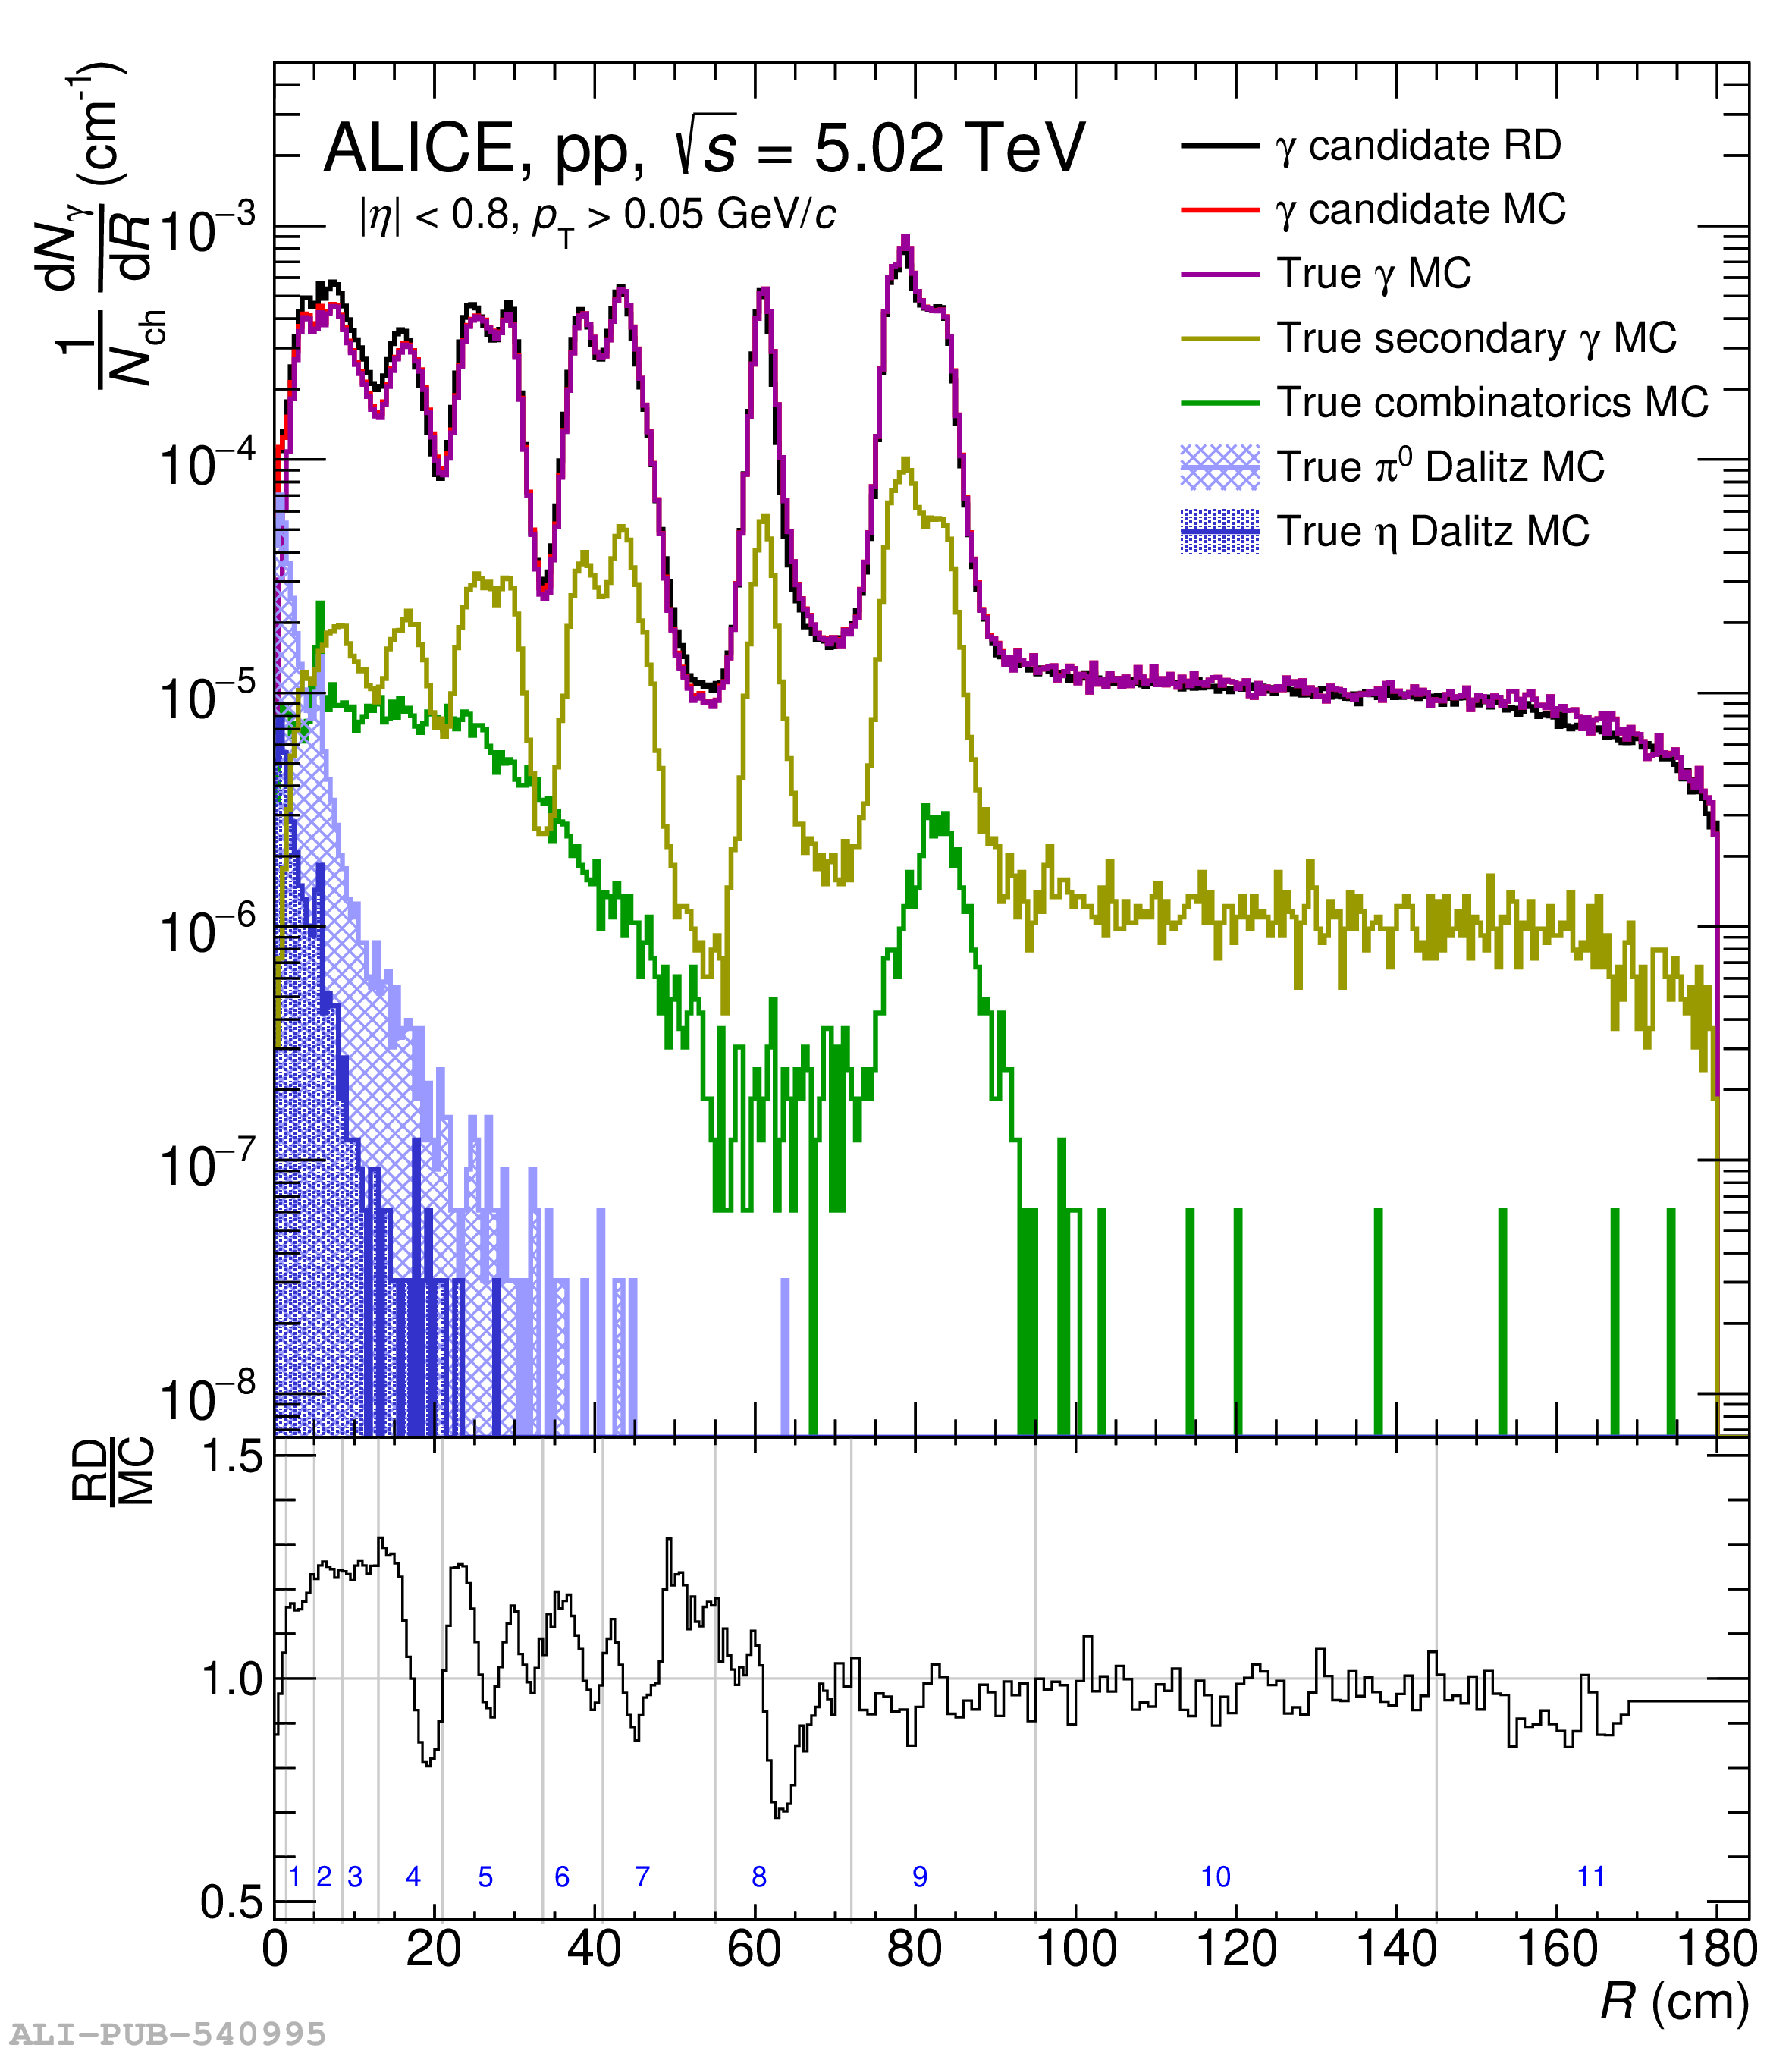 |