Distribution of the weights ${\Omega}_i$ and $\omega_i$ as a function of the radial position of the conversion point. Statistical uncertainties are given by the vertical bars, and systematic uncertainties are depicted by shaded areas, except for the first two intervals where only statistical uncertainties are quoted. Notice the zero $\omega_i$ systematic uncertainty in the calibration intervals (95 cm$< R< $ 145 cm), thusan horizontal line is drawn displaying the radial interval. The width in spatial direction of the uncertainty box for the $\Omega_i$ was shrunk for better visibility. | 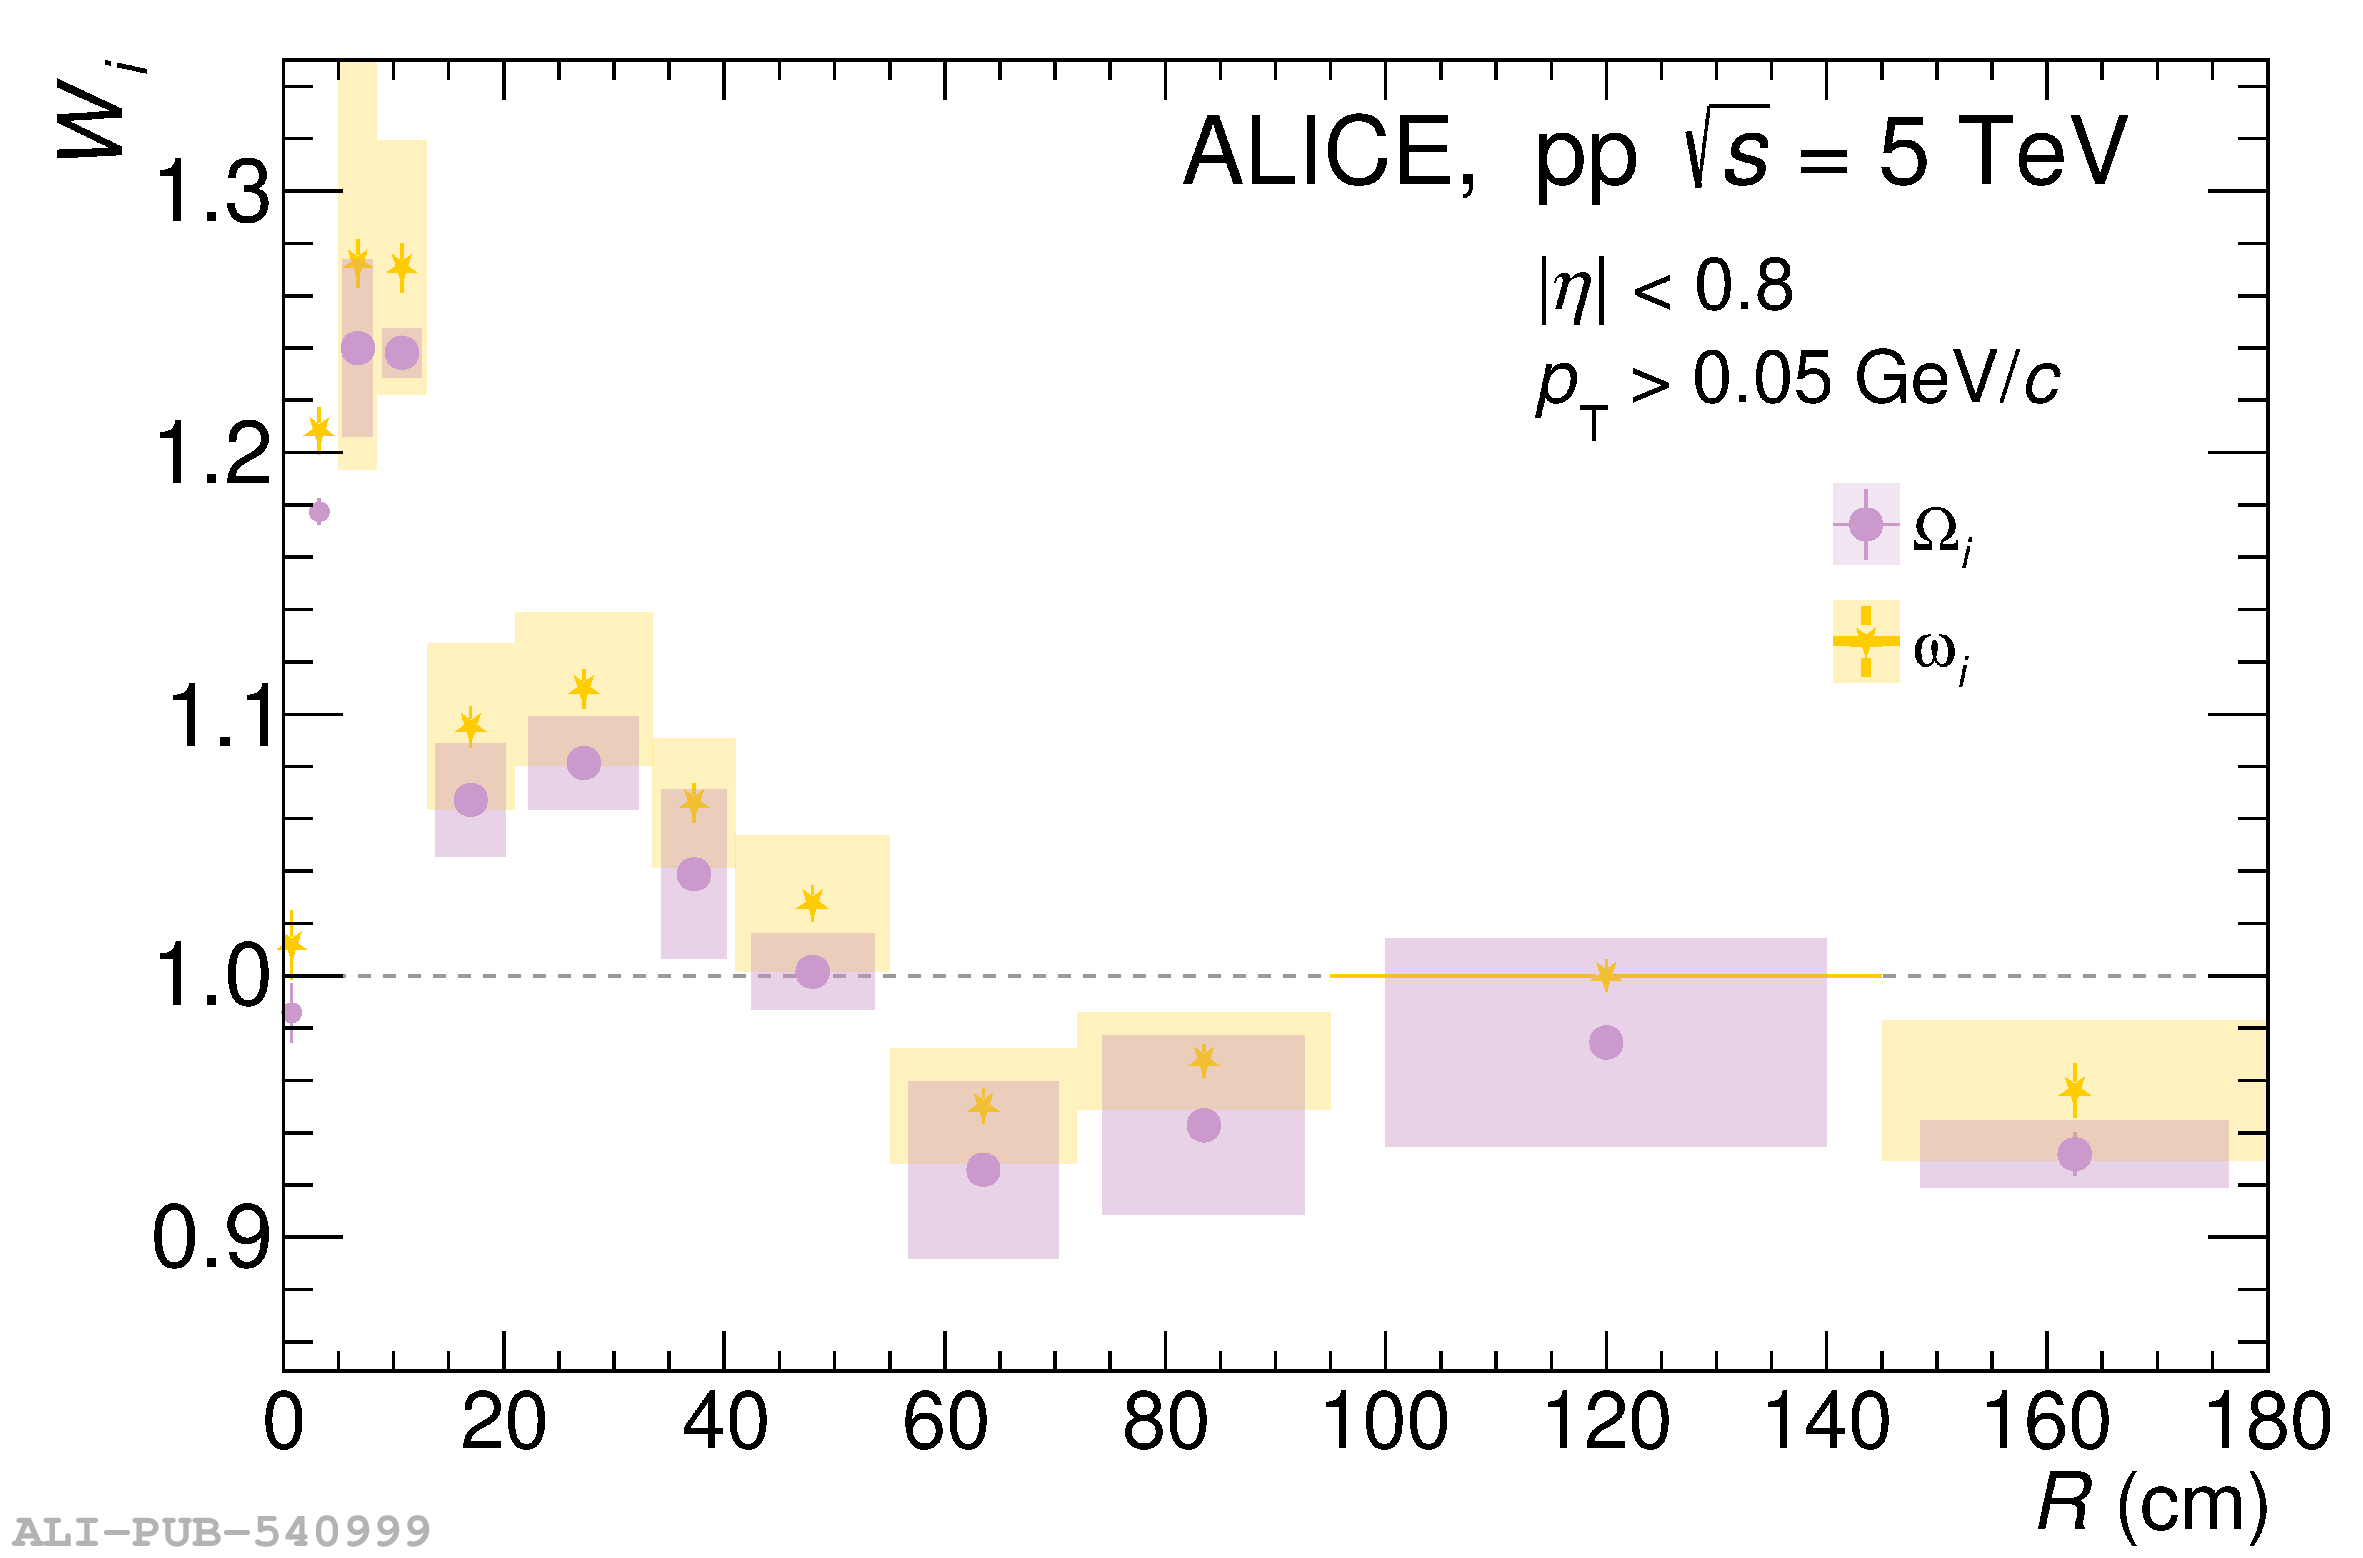 |