The production of $\pi^\pm$, ${\rm K}^\pm$, and $(\overline{\rm p})$p is measured in pp collisions at $\sqrt{s}=13$ TeV in different topological regions. Particle transverse momentum ($p_{\rm T}$) spectra are measured in the ``toward'', ``transverse'', and ``away'' angular regions defined with respect to the direction of the leading particle in the event. While the toward and away regions contain the fragmentation products of the near-side and away-side jets, respectively, the transverse region is dominated by particles from the Underlying Event (UE). The relative transverse activity classifier, $R_{\rm T}=N_{\rm T}/\langle N_{\rm T}\rangle$, is used to group events according to their UE activity, where $N_{\rm T}$ is the measured charged-particle multiplicity per event in the transverse region and $\langle N_{\rm T}\rangle$ is the mean value over all the analysed events. The first measurements of identified particle $p_{\rm T}$ spectra as a function of $R_{\rm T}$ in the three topological regions are reported. The yield of high transverse momentum particles relative to the $R_{\rm T}$-integrated measurement decreases with increasing $R_{\rm T}$ in both the toward and away regions, indicating that the softer UE dominates particle production as $R_{\rm T}$ increases and validating that $R_{\rm T}$ can be used to control the magnitude of the UE. Conversely, the spectral shapes in the transverse region harden significantly with increasing $R_{\rm T}$. This hardening follows a mass ordering, being more significant for heavier particles. The $p_{\rm T}$-differential particle ratios $({\rm p+\overline{p}})/(\pi^+ +\pi^-)$ and $({\rm K^+ +K^-})/(\pi^+ +\pi^-)$ in the low UE limit $(R_{\rm T}\rightarrow 0)$ approach expectations from Monte Carlo generators such as PYTHIA 8 with Monash 2013 tune and EPOS LHC, where the jet-fragmentation models have been tuned to reproduce ${\rm e^+ e^-}$ results.
JHEP 06 (2023) 027
HEP Data
e-Print: arXiv:2301.10120 | PDF | inSPIRE
CERN-EP-2022-286
Figure group
Figure 1
Illustration of the toward, transverse, and away regions in the azimuthal angle plane with respect to the direction of the leading particle. The leading particle is represented with the longest upright arrow. The UE is represented with the small arrows transverse to the leading particle. The red cones represent the jet and away-side jet. | 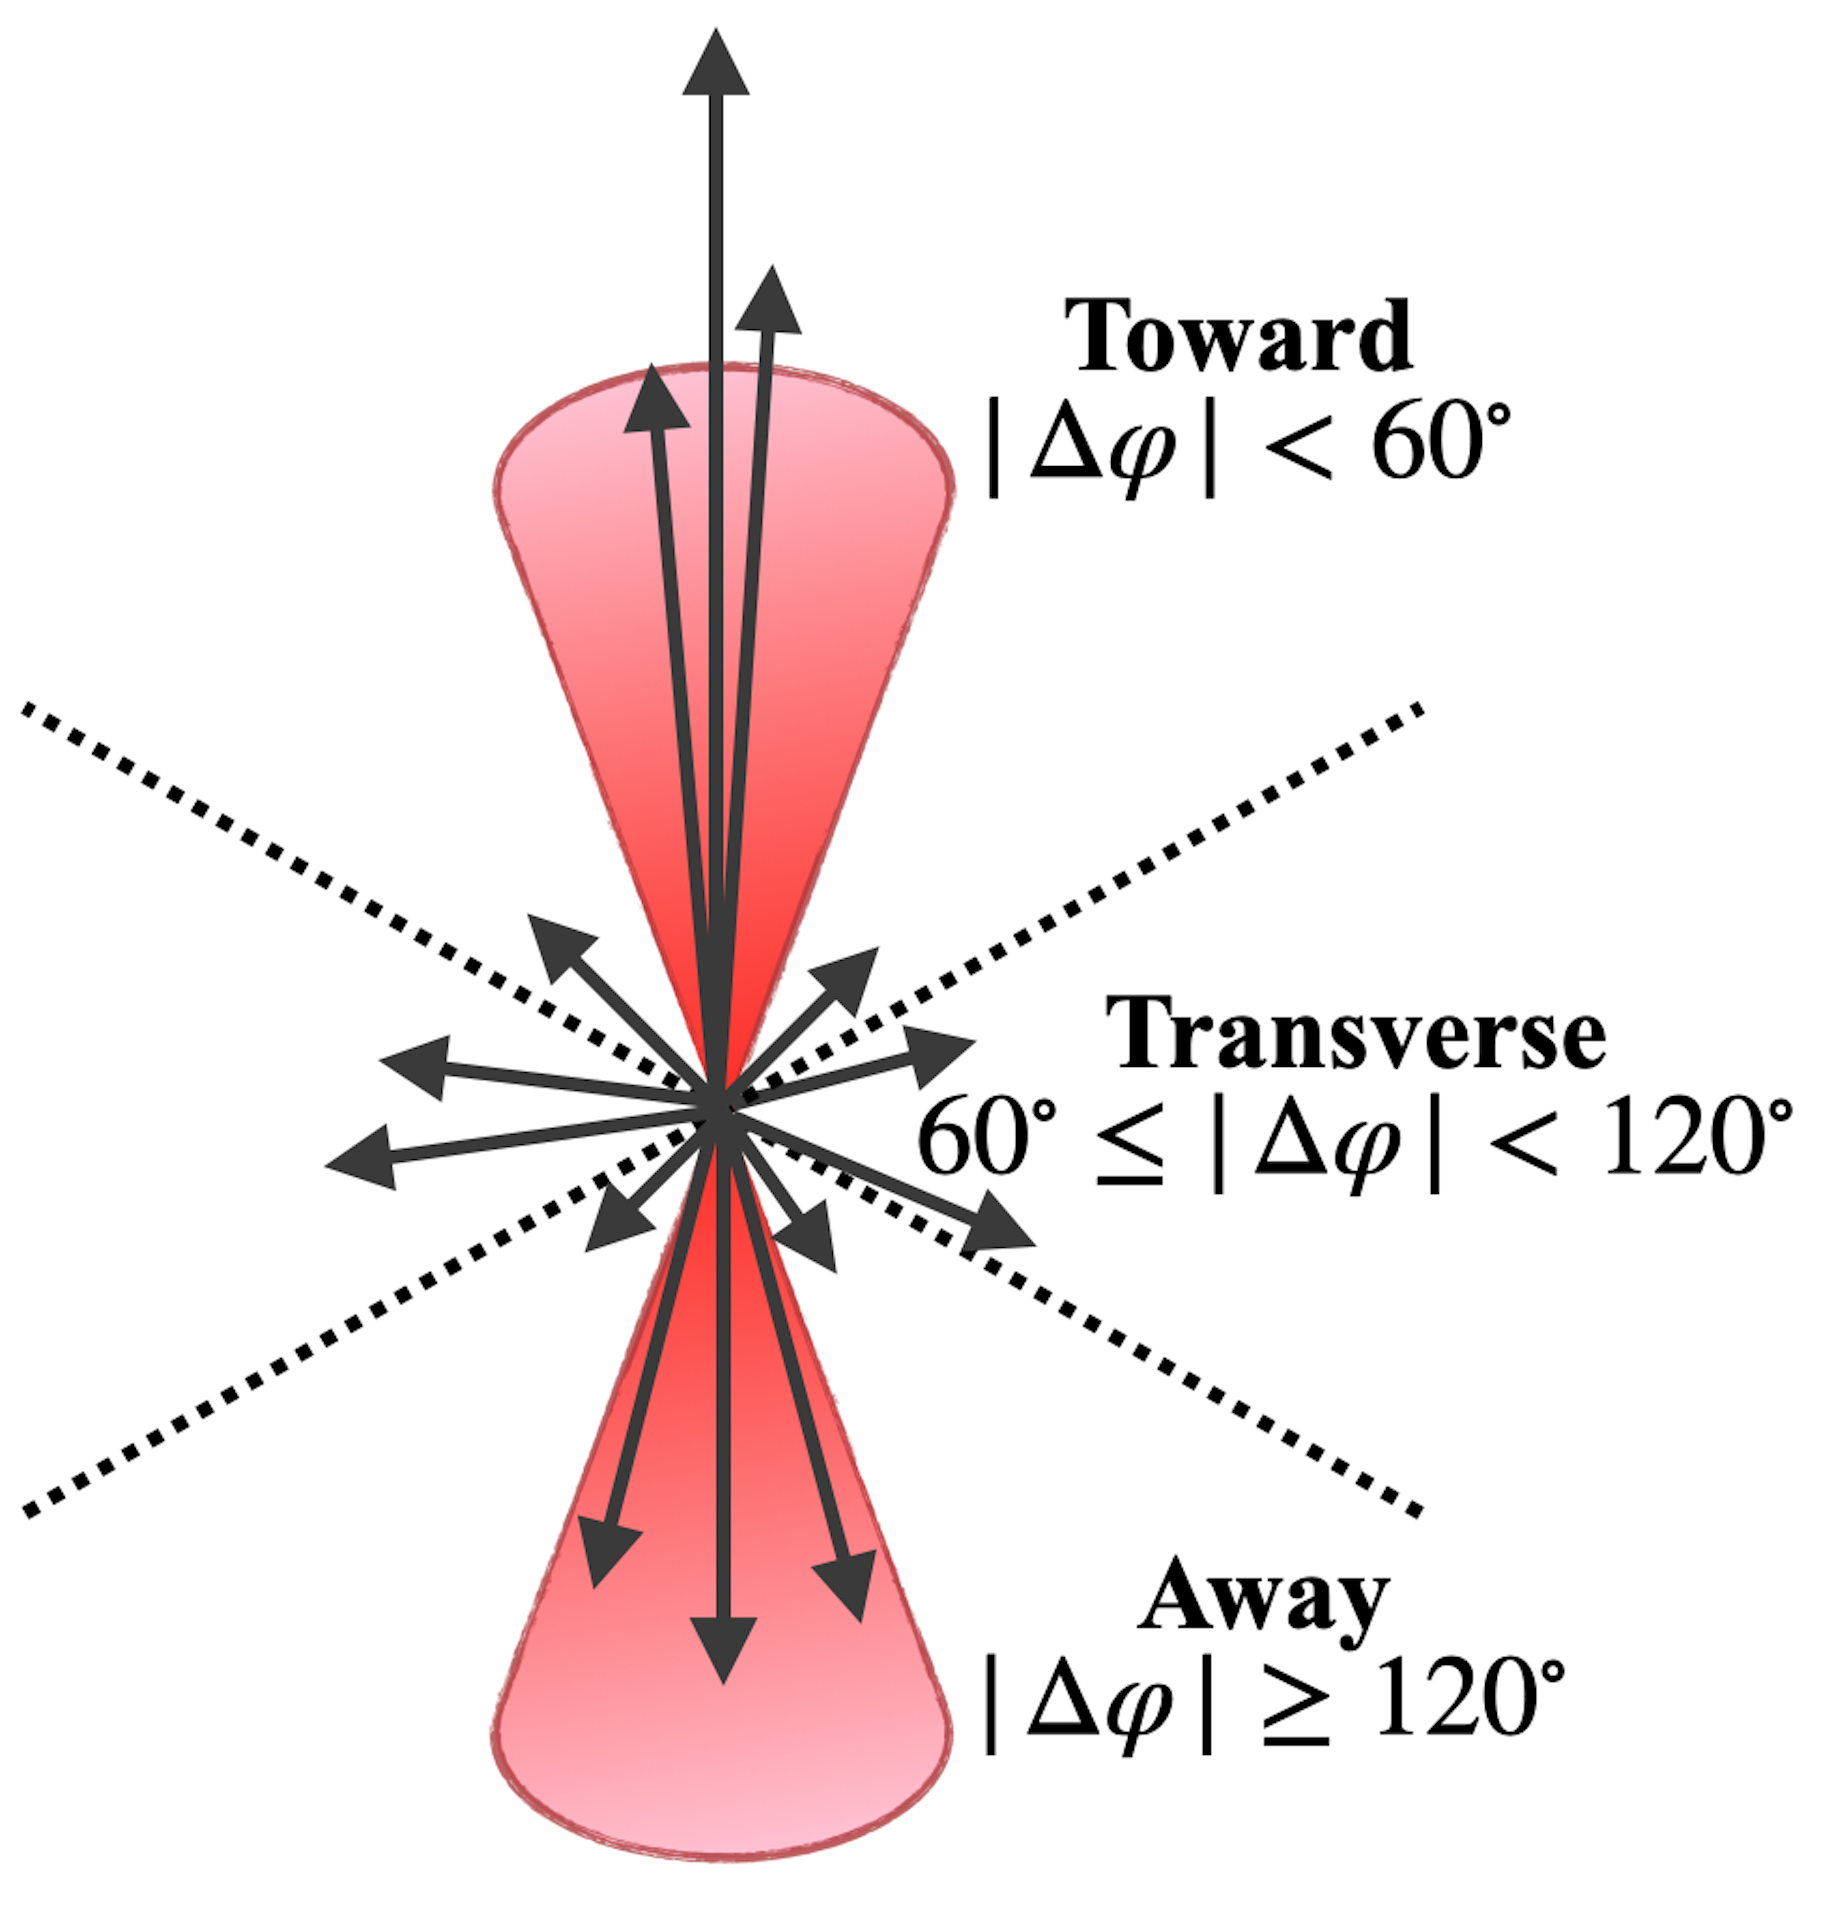 |
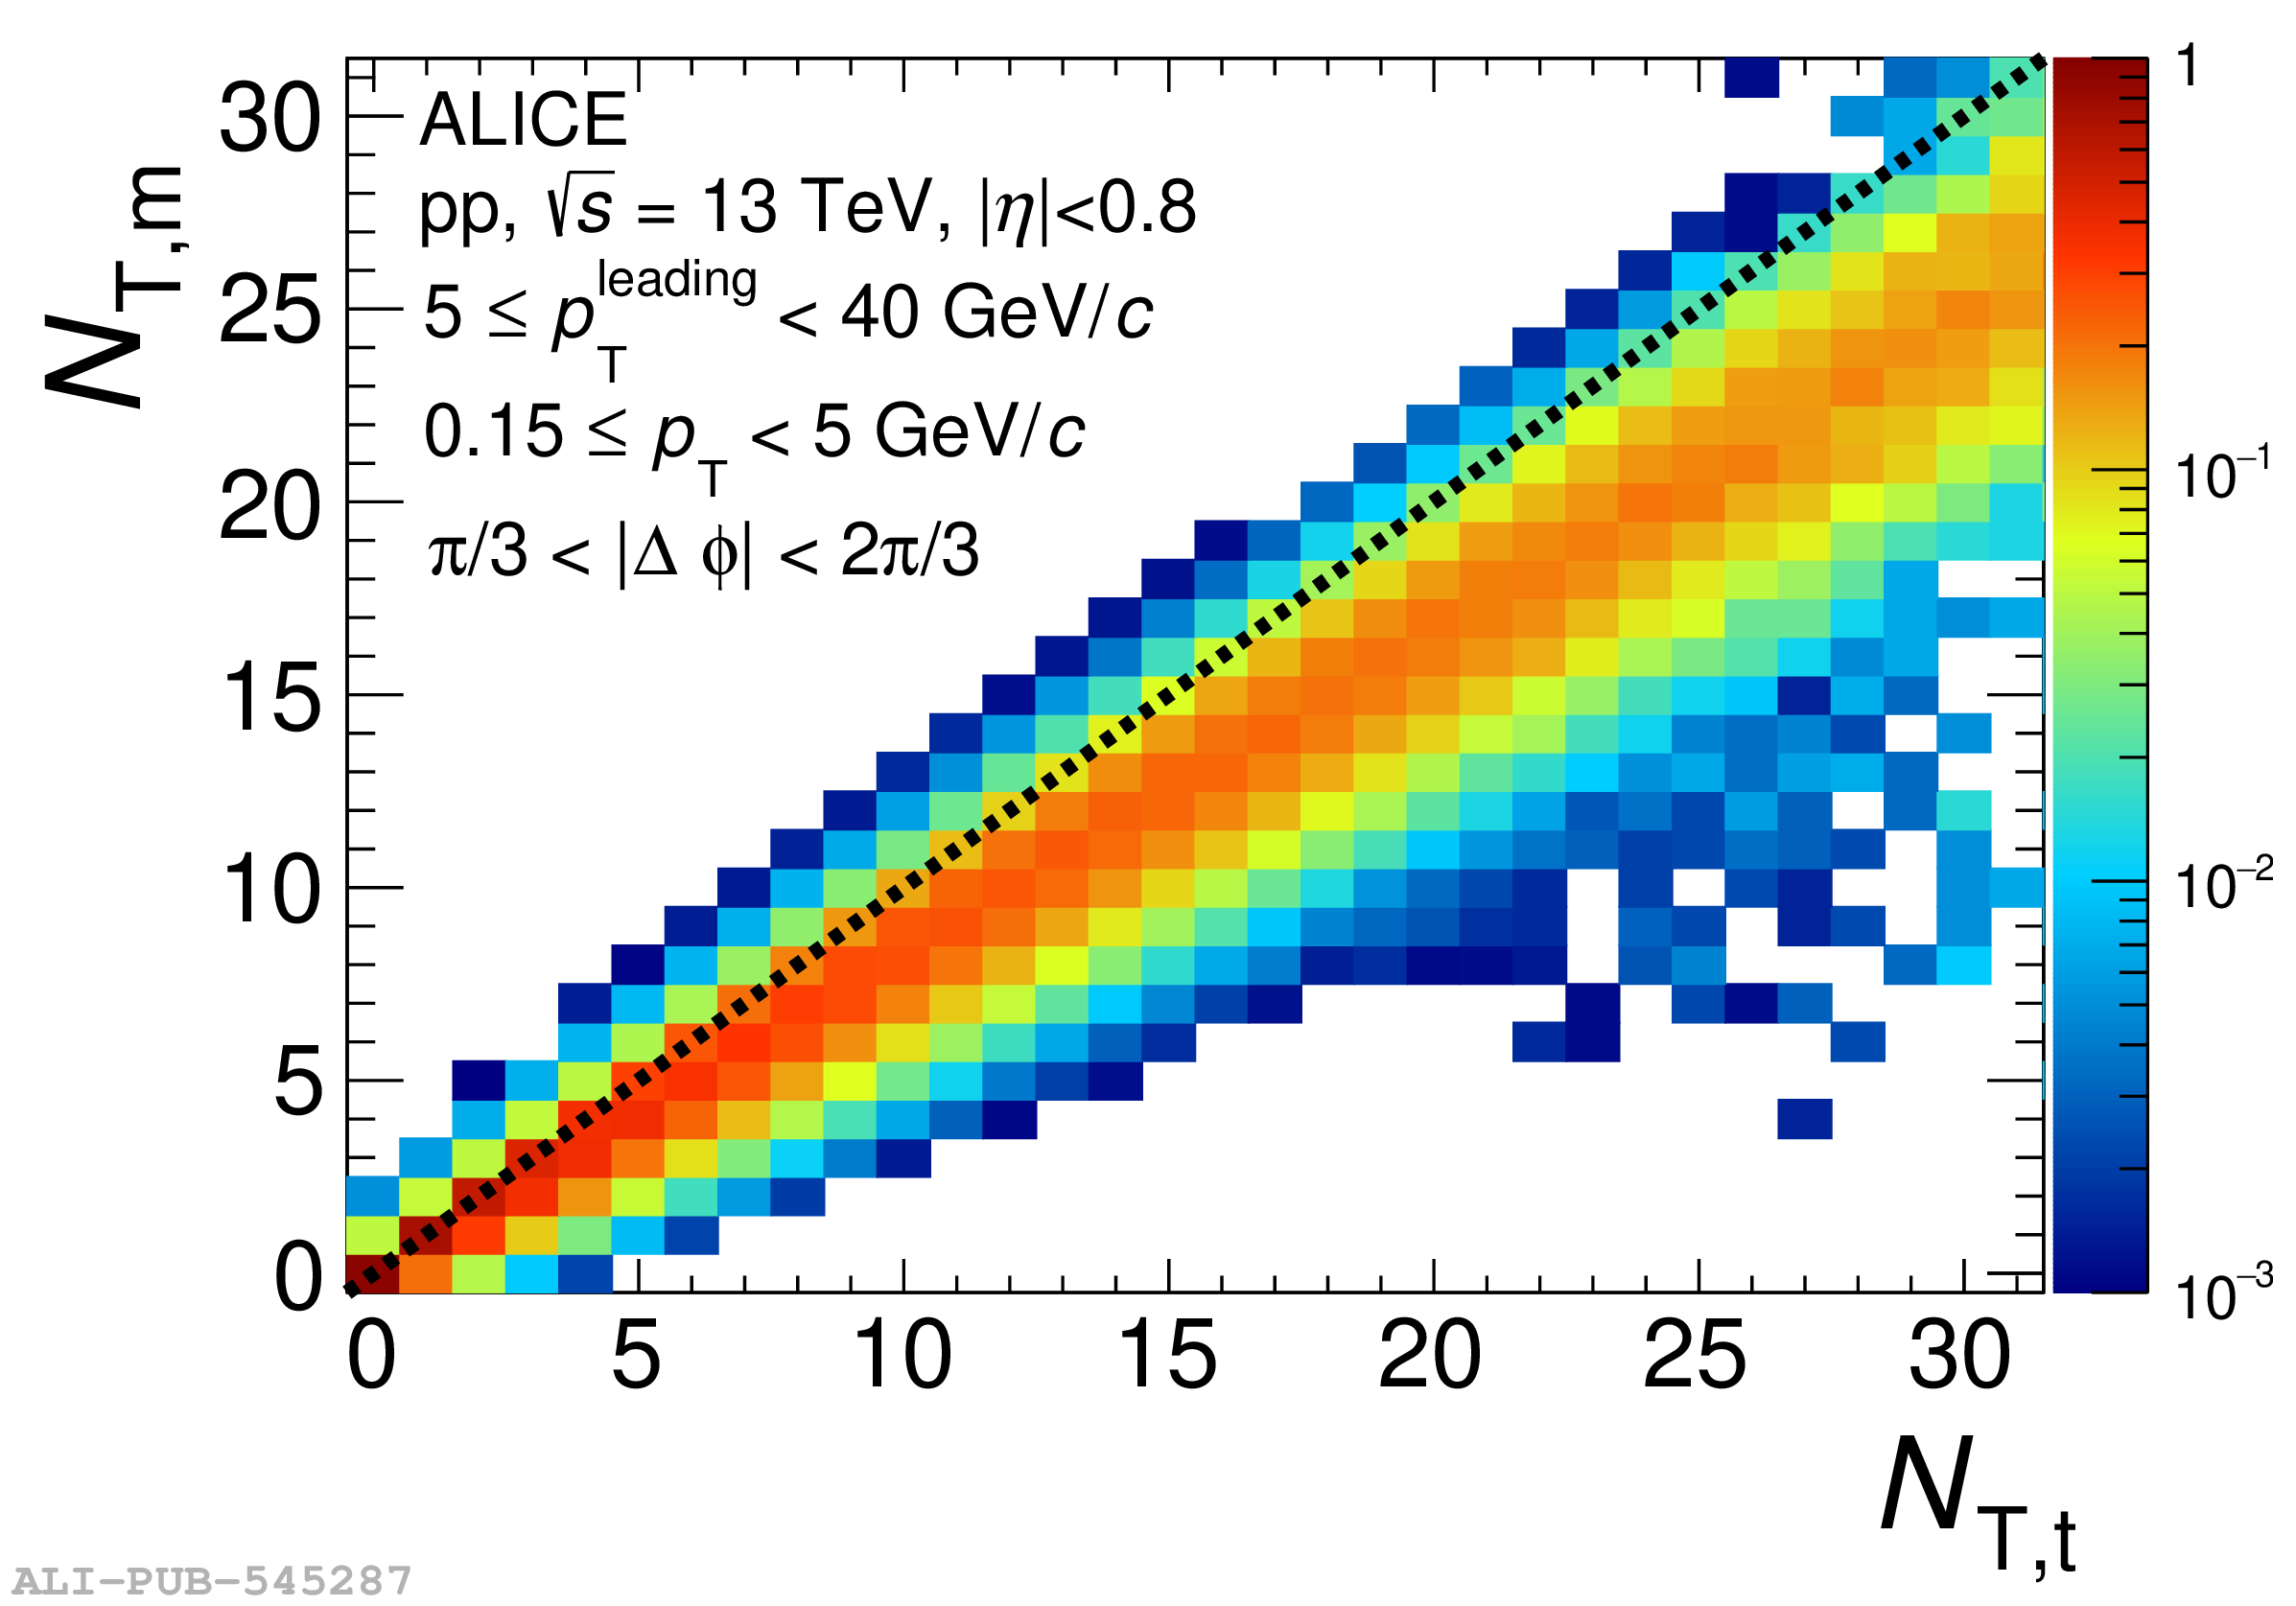
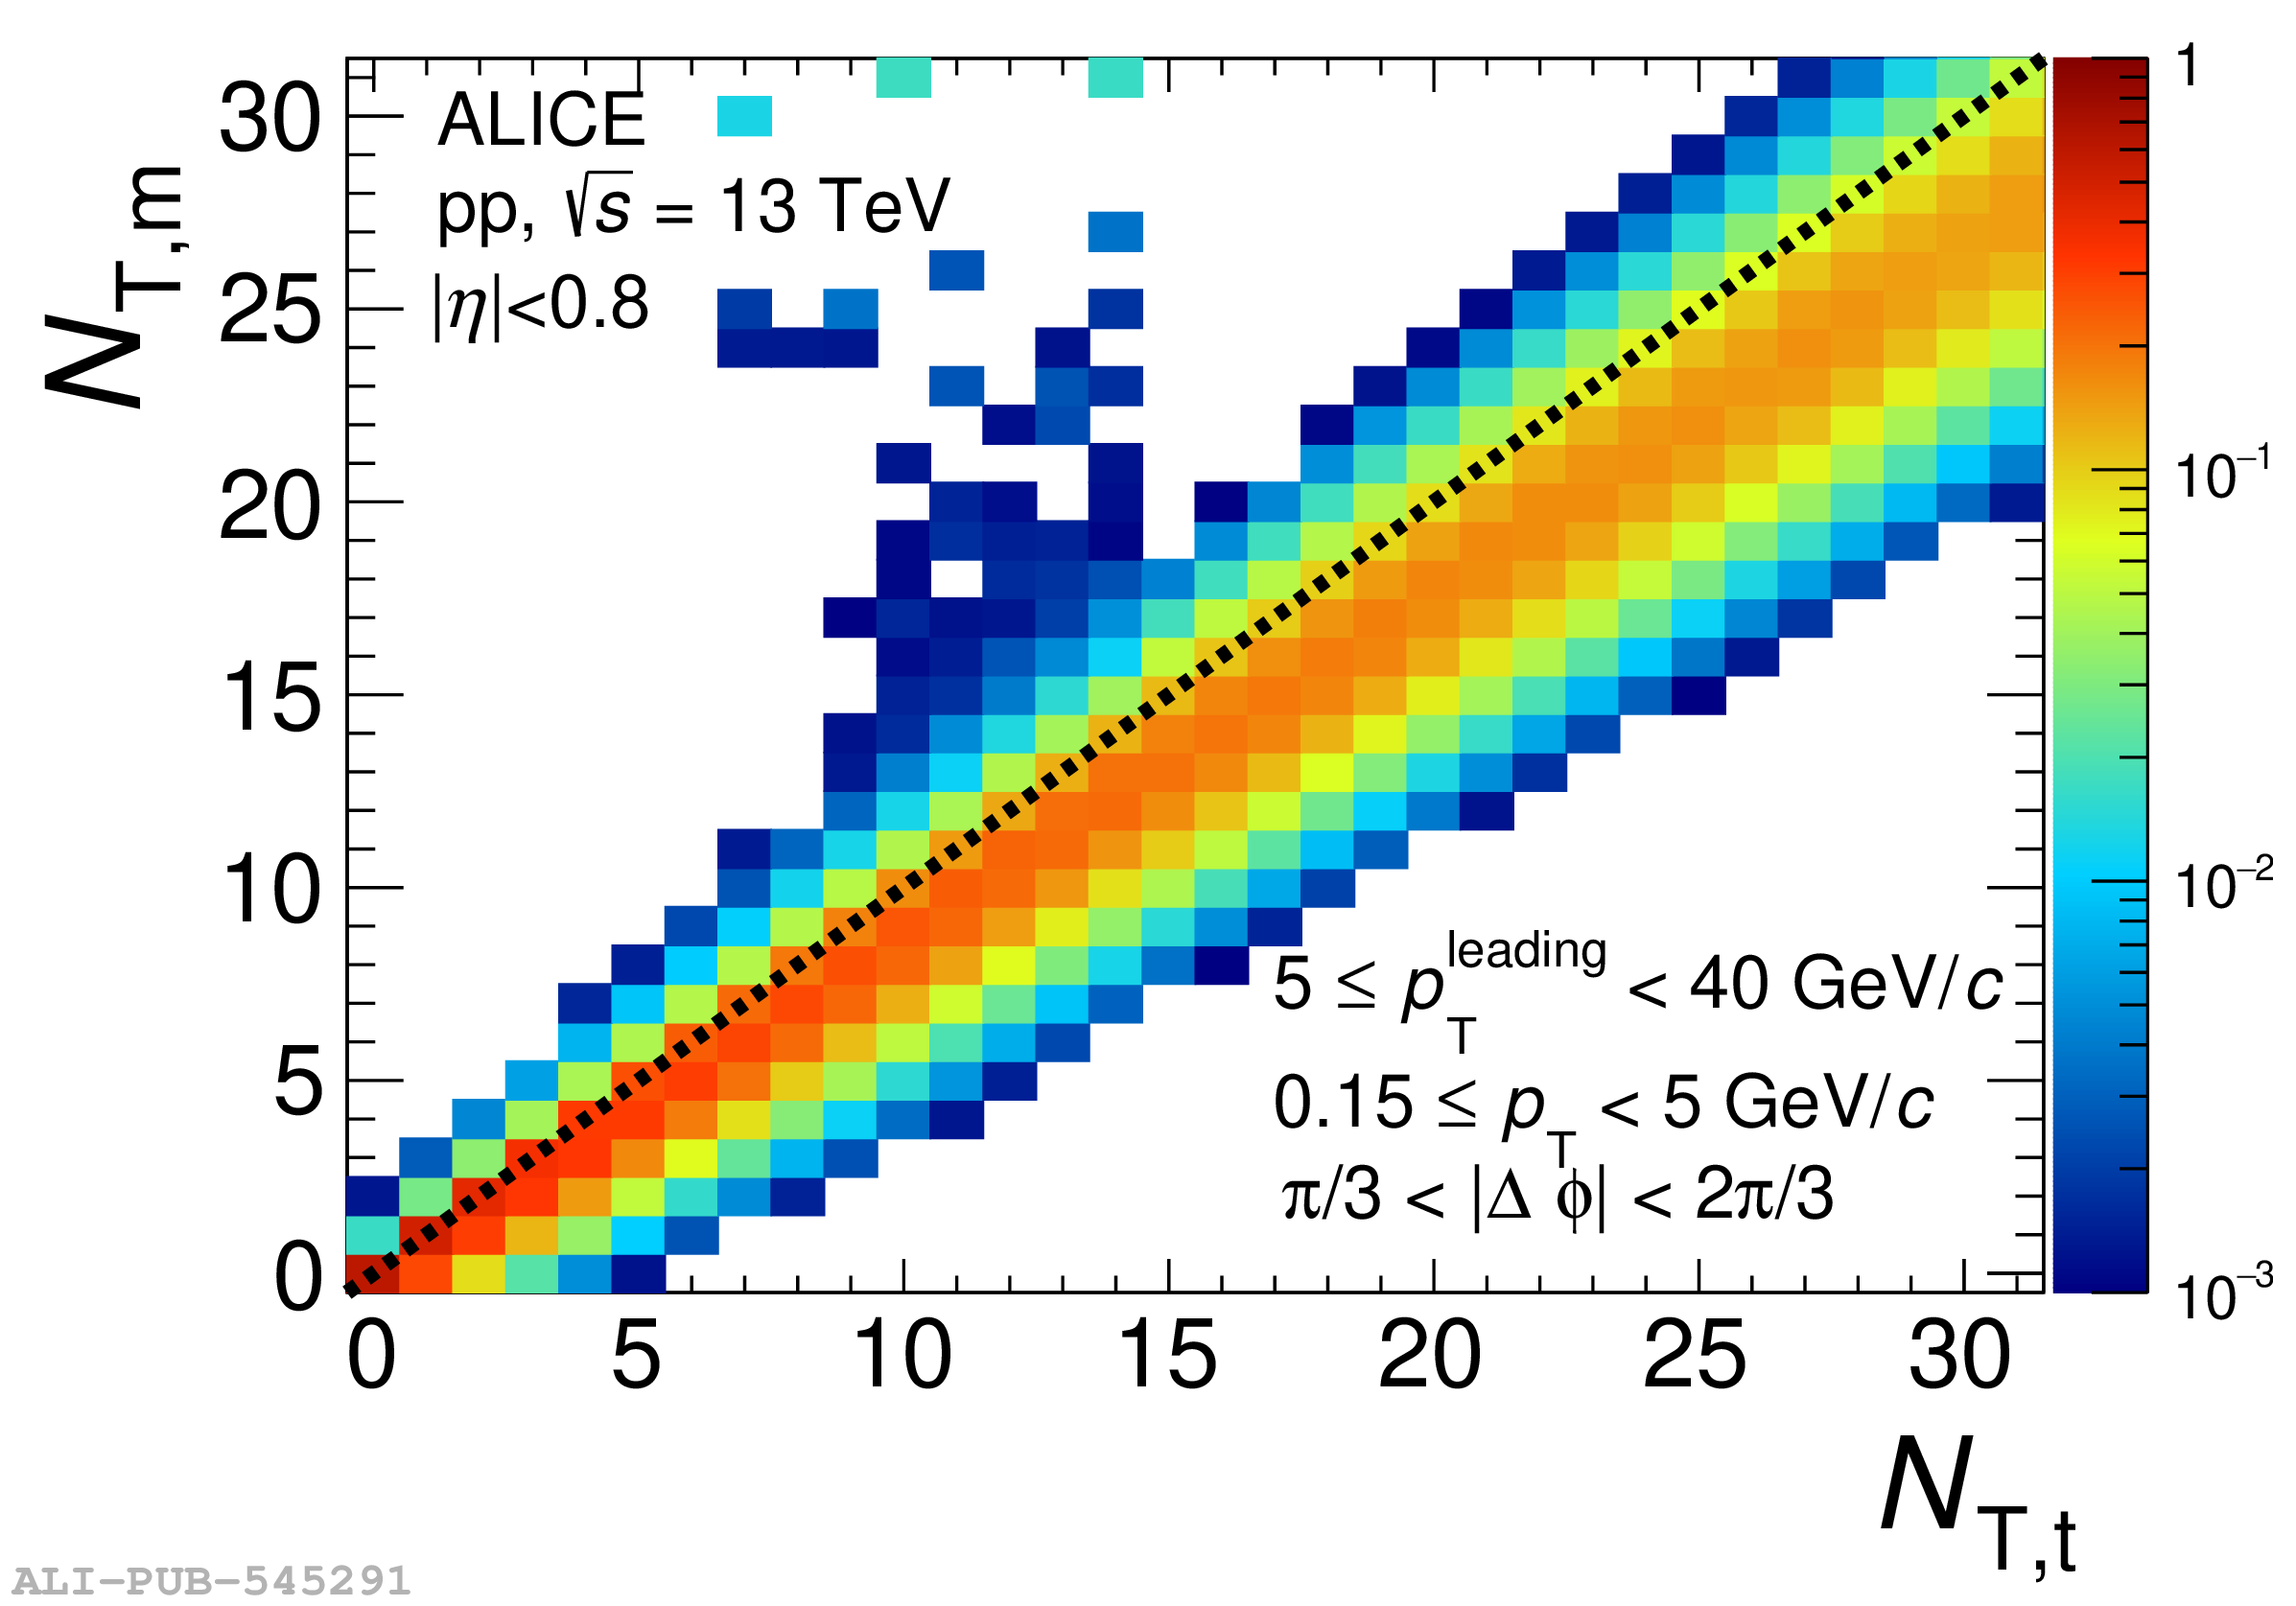
Figure 3
$N_{\rm T}$ (left) and $R_{\rm T}$ (right) probability distributions in the transverse region in events with the leading particle. The data are represented with solid black markers and statistical and systematic uncertainties with error bars and boxes, respectively. Model predictions are presented with colour lines and the bands around the model predictions represent only the statistical uncertainty. The bottom panels show the model-to-data ratios. The grey band centred at one in the bottom panel represents the systematic uncertainties of the data. | 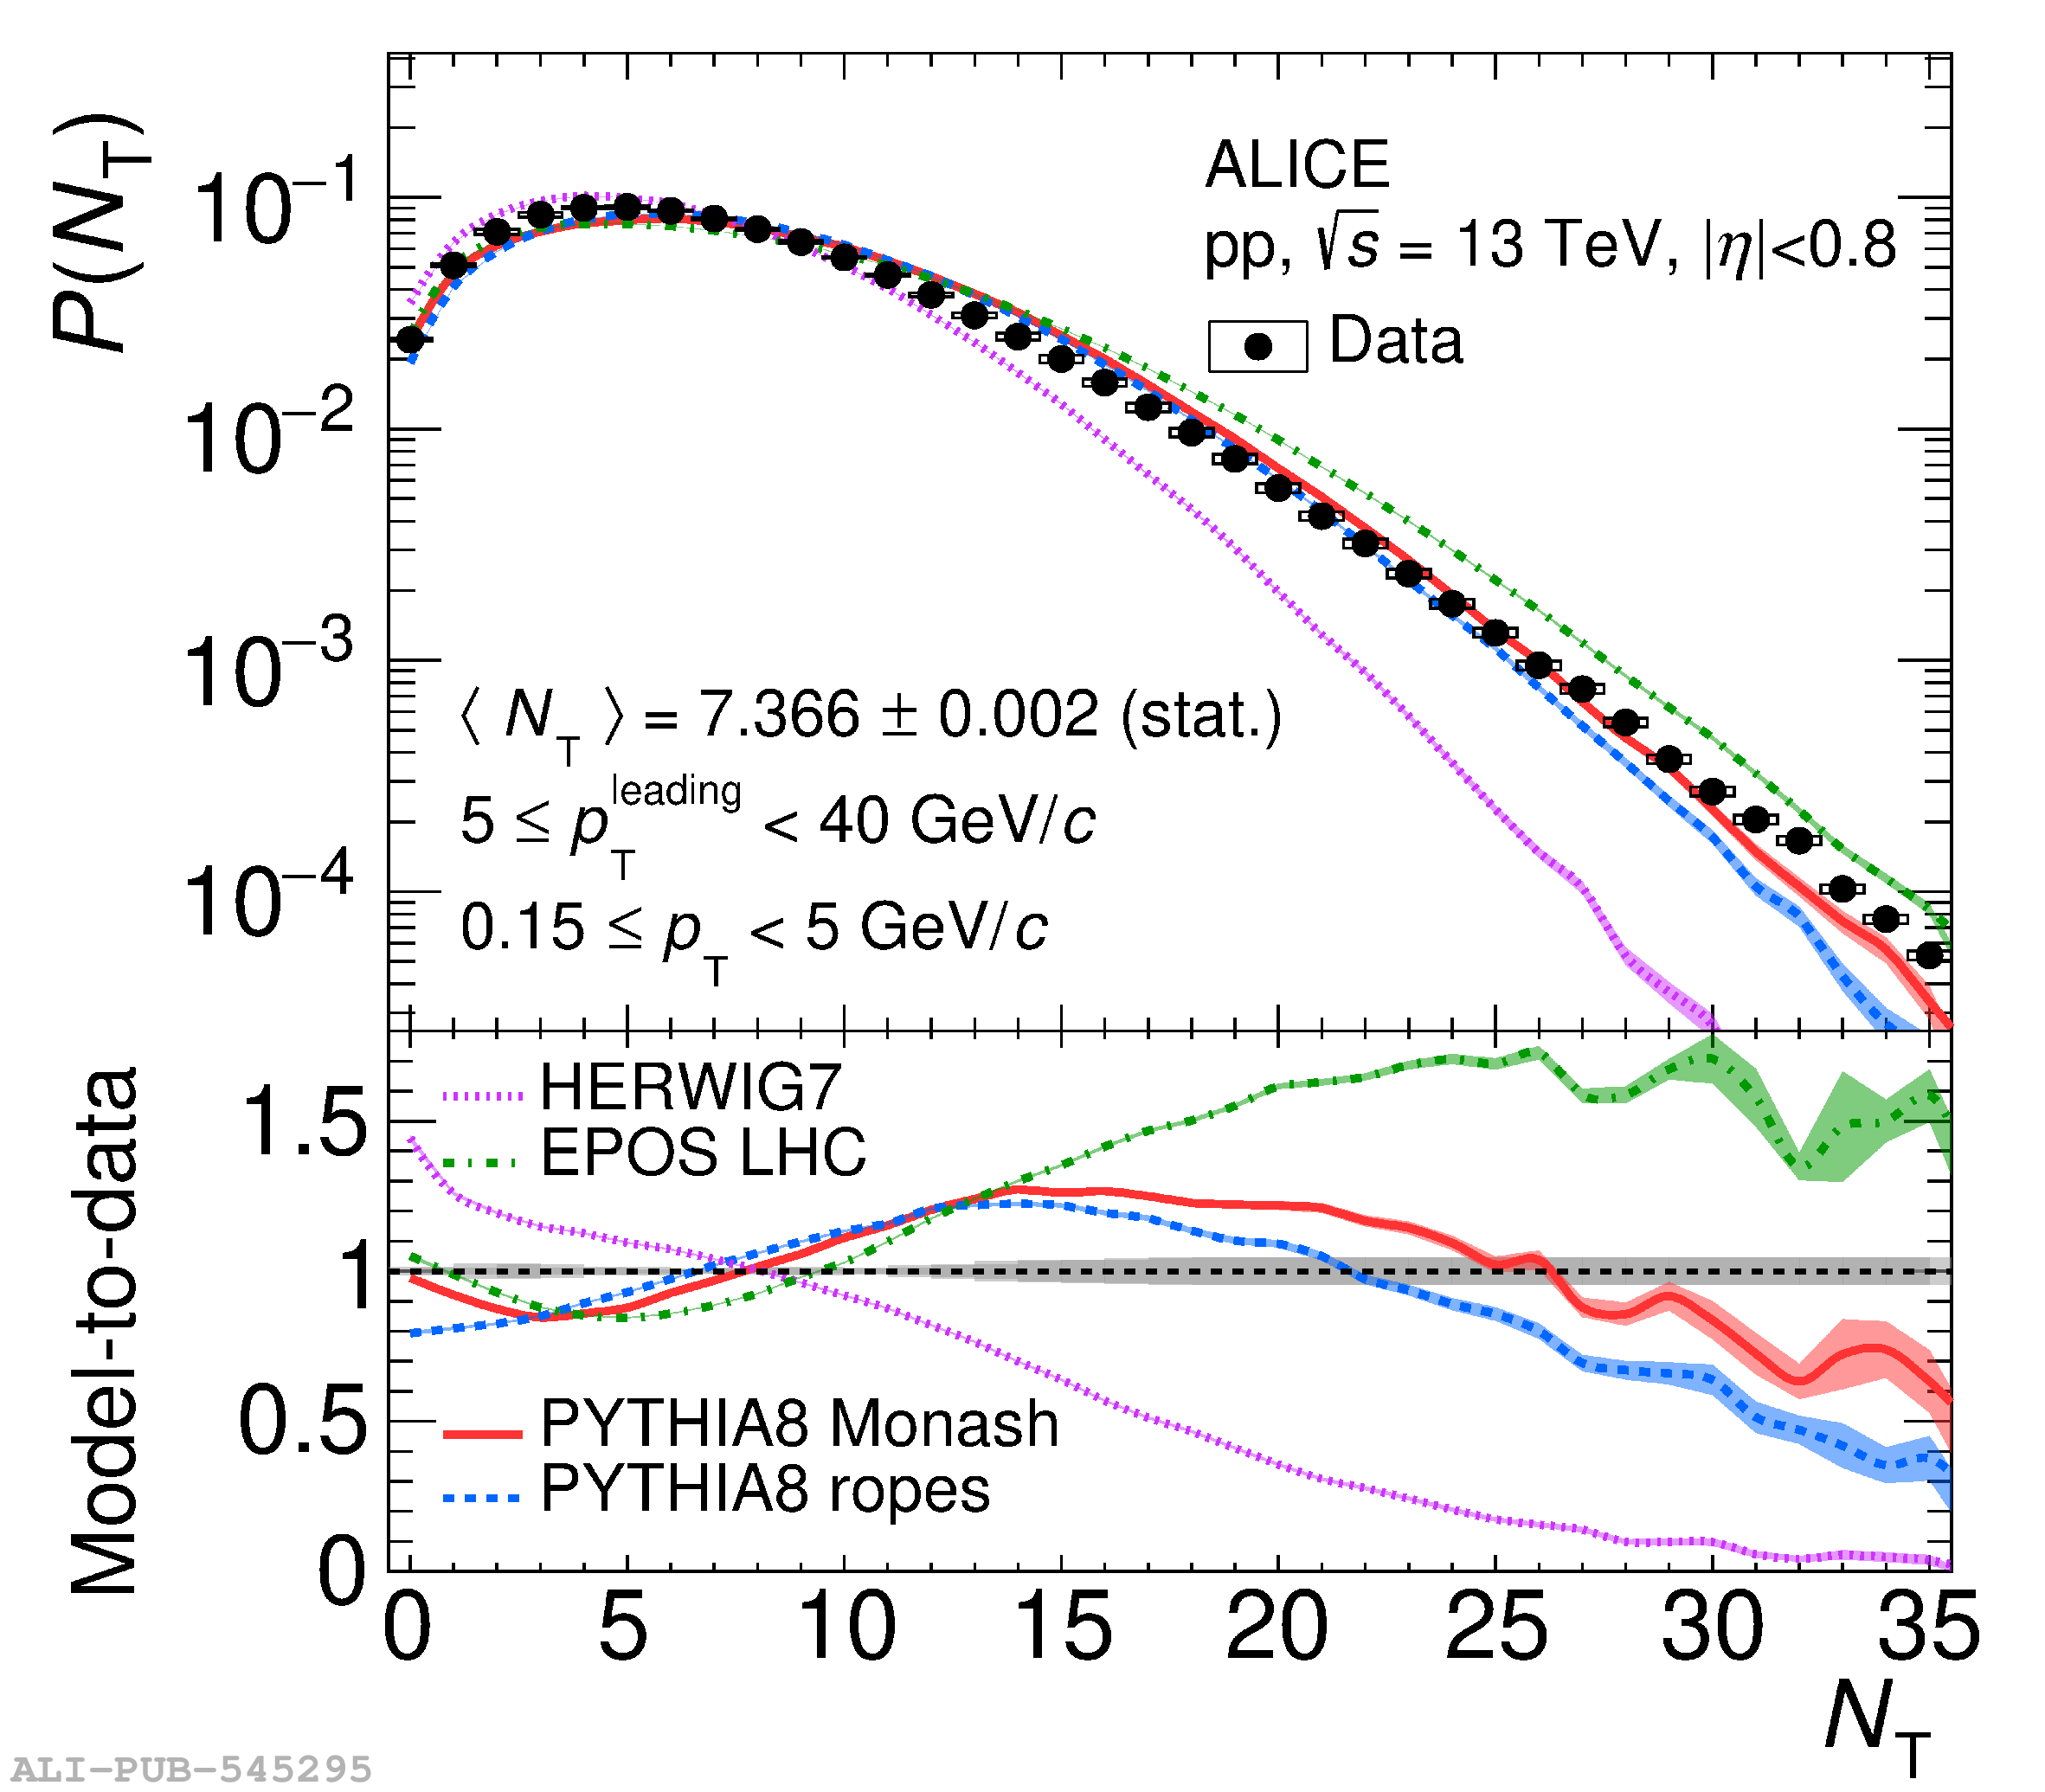 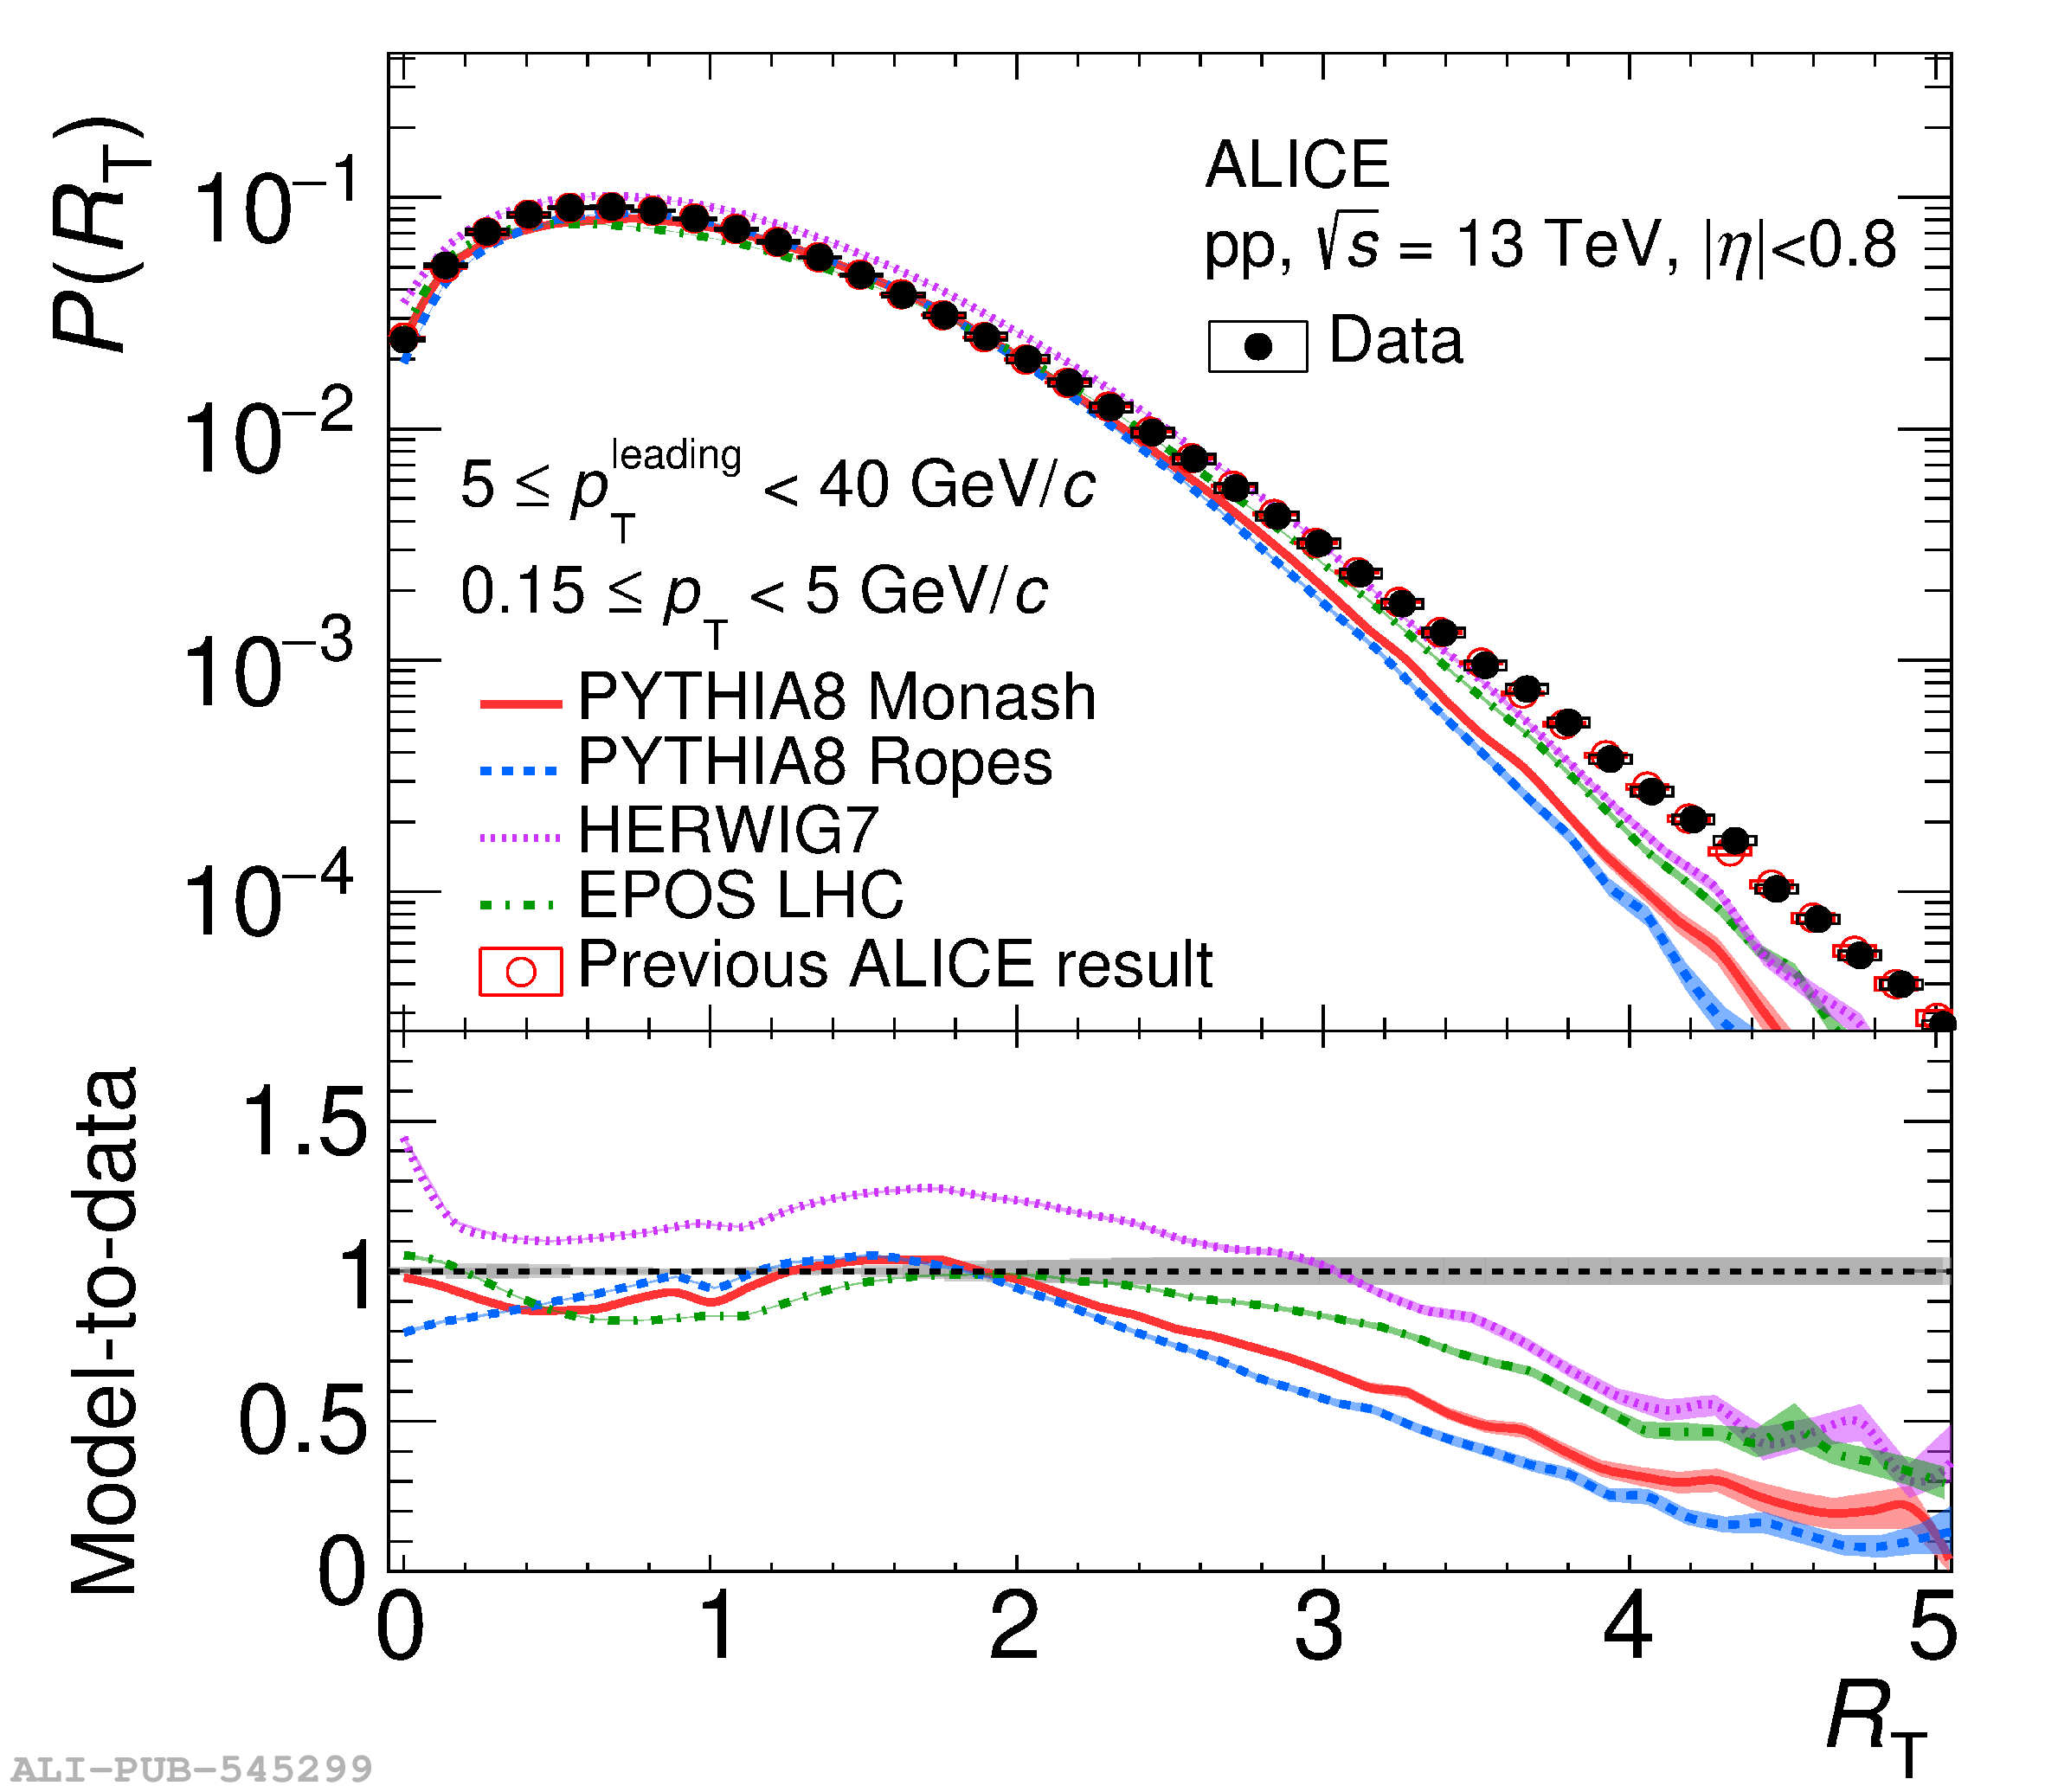 |
Figure 4
Transverse momentum spectra (top panels) of pions as a function of $R_{\rm T}$ and ratios to the $R_{\rm T}$-integrated spectrum (bottom panels). The toward, away, and transverse regions are shown from left to right. The statistical and systematic uncertainties are represented with bars and boxes, respectively. | 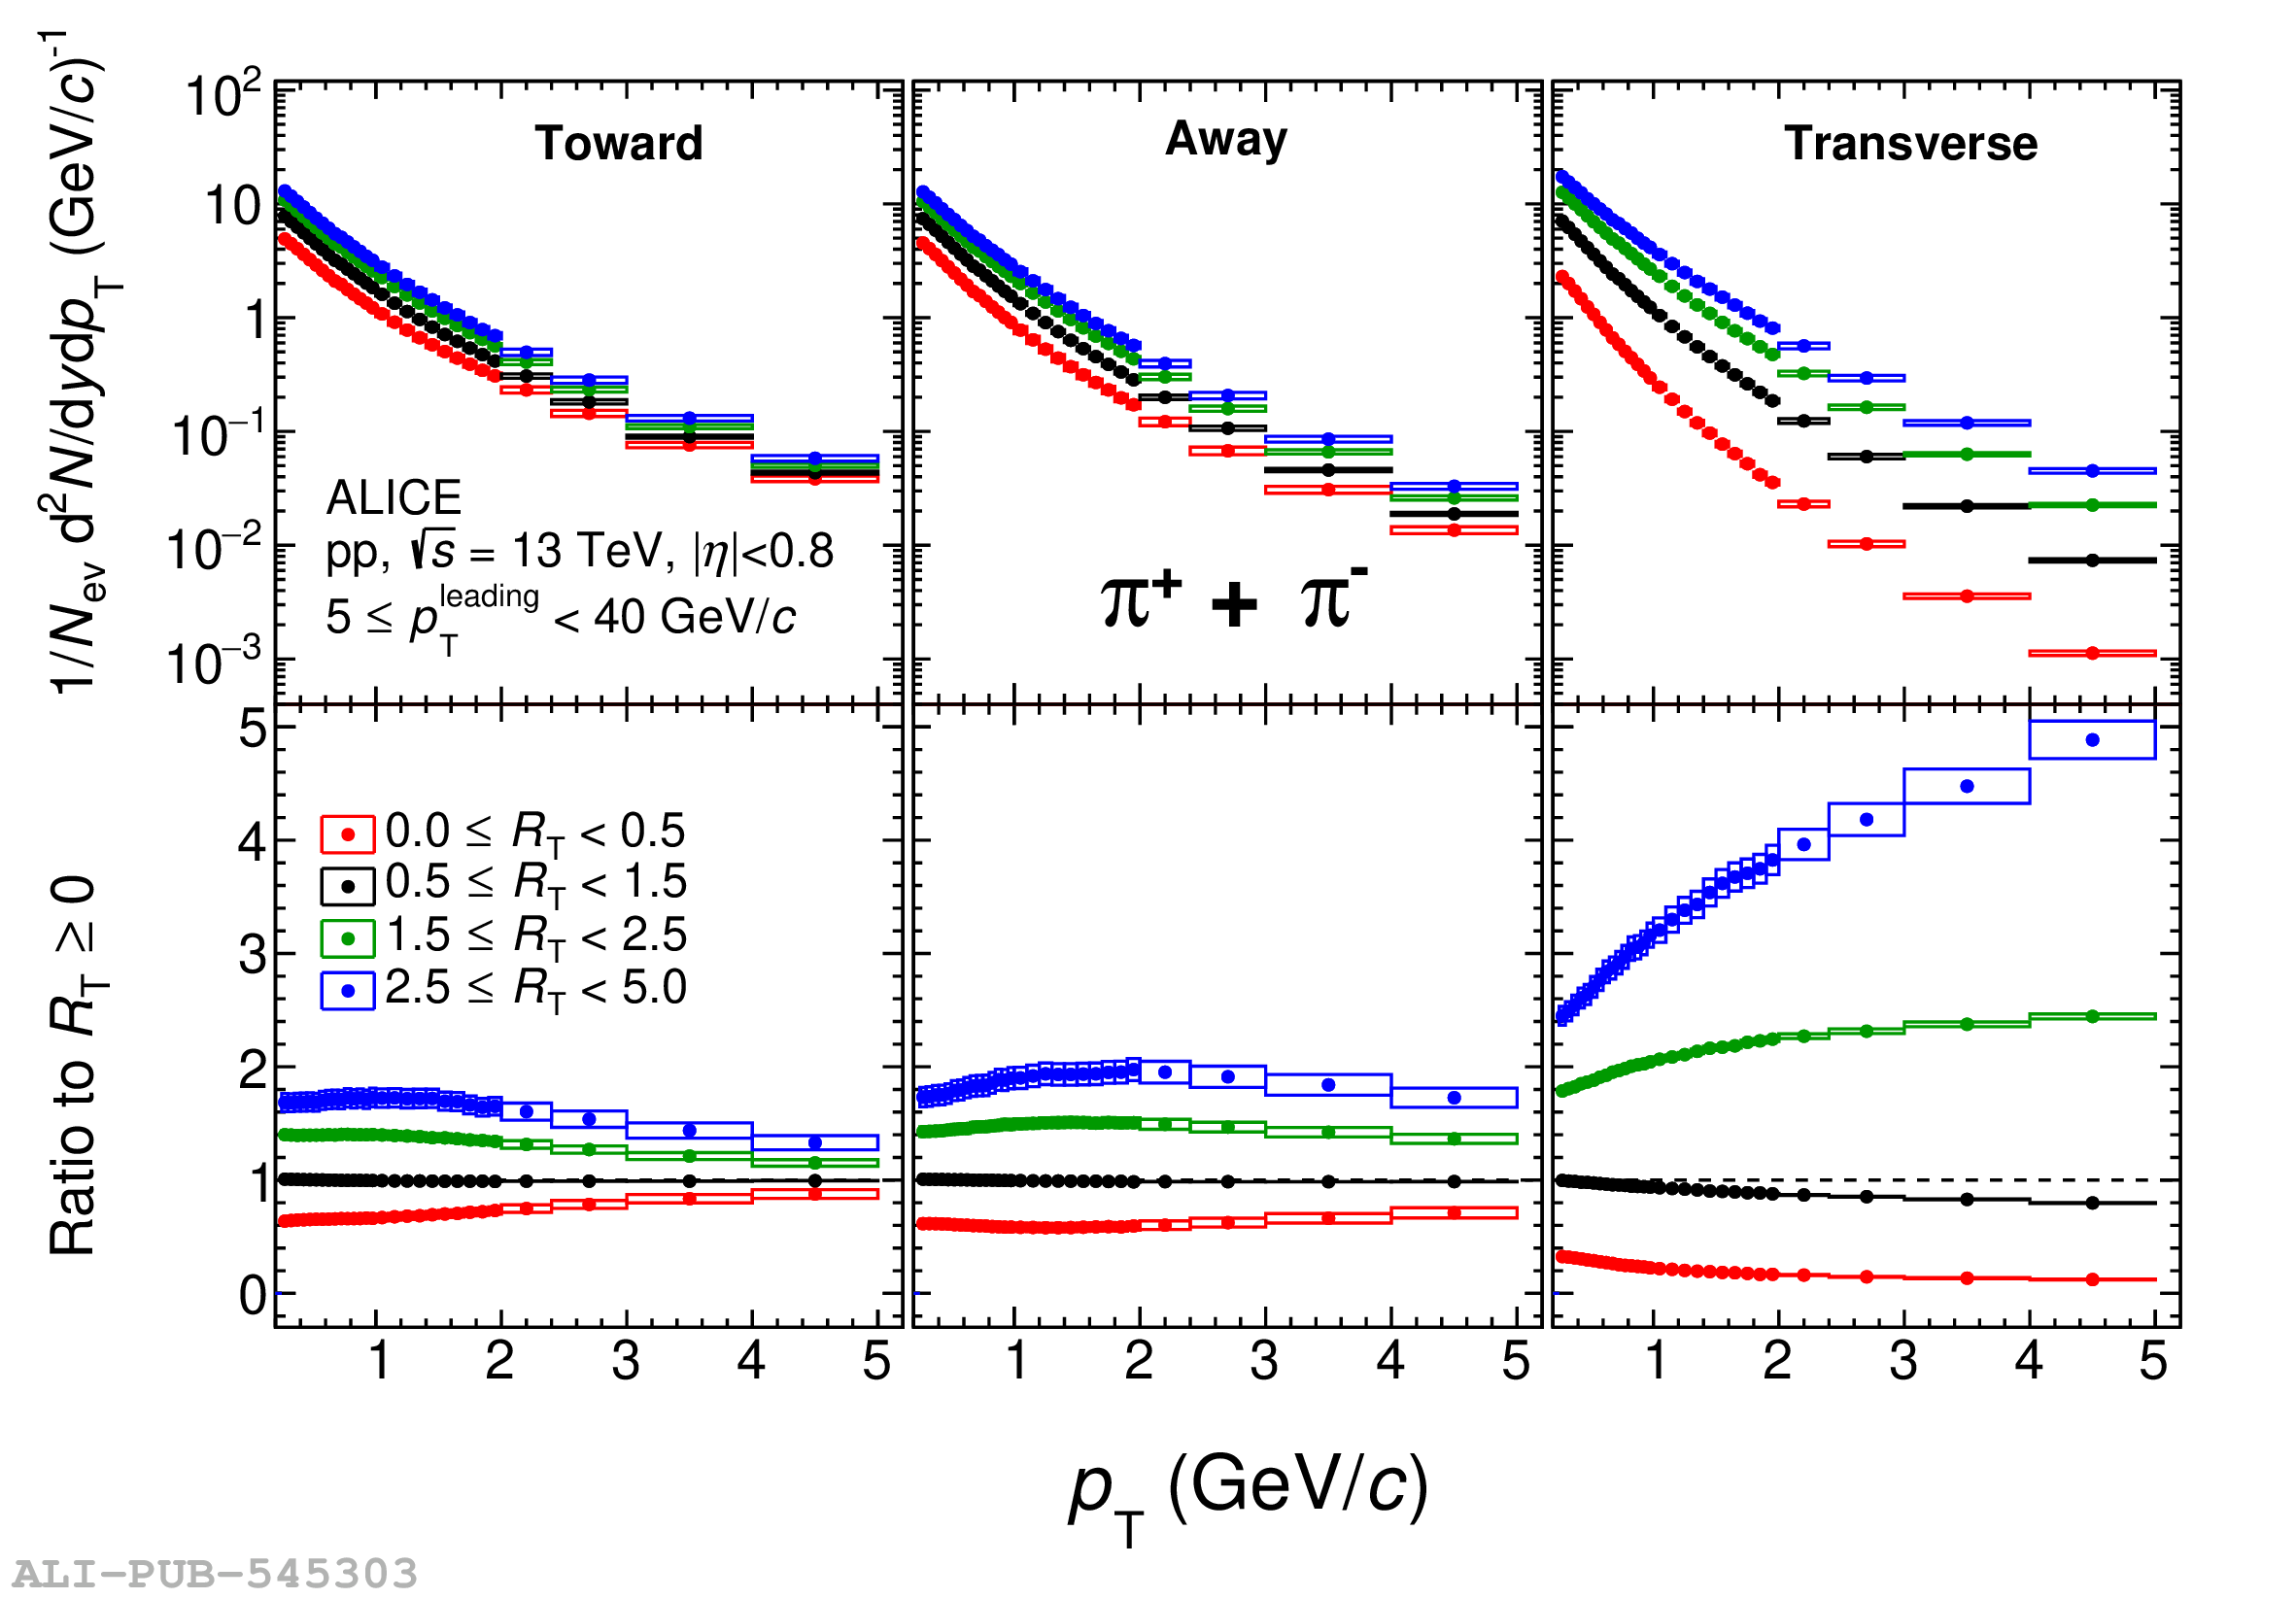 |
Figure 5
Transverse momentum spectra (top panels) of kaons as a function of $R_{\rm T}$ and ratios to the $R_{\rm T}$-integrated spectrum (bottom panels). The toward, away, and transverse regions are shown from left to right. The statistical and systematic uncertainties are represented with bars and boxes, respectively. |  |
Figure 6
Transverse momentum spectra (top panels) of protons as a function of $R_{\rm T}$ and ratios to the $R_{\rm T}$-integrated spectrum (bottom panels). The toward, away, and transverse regions are shown from left to right. The statistical and systematic uncertainties are represented with bars and boxes, respectively. | 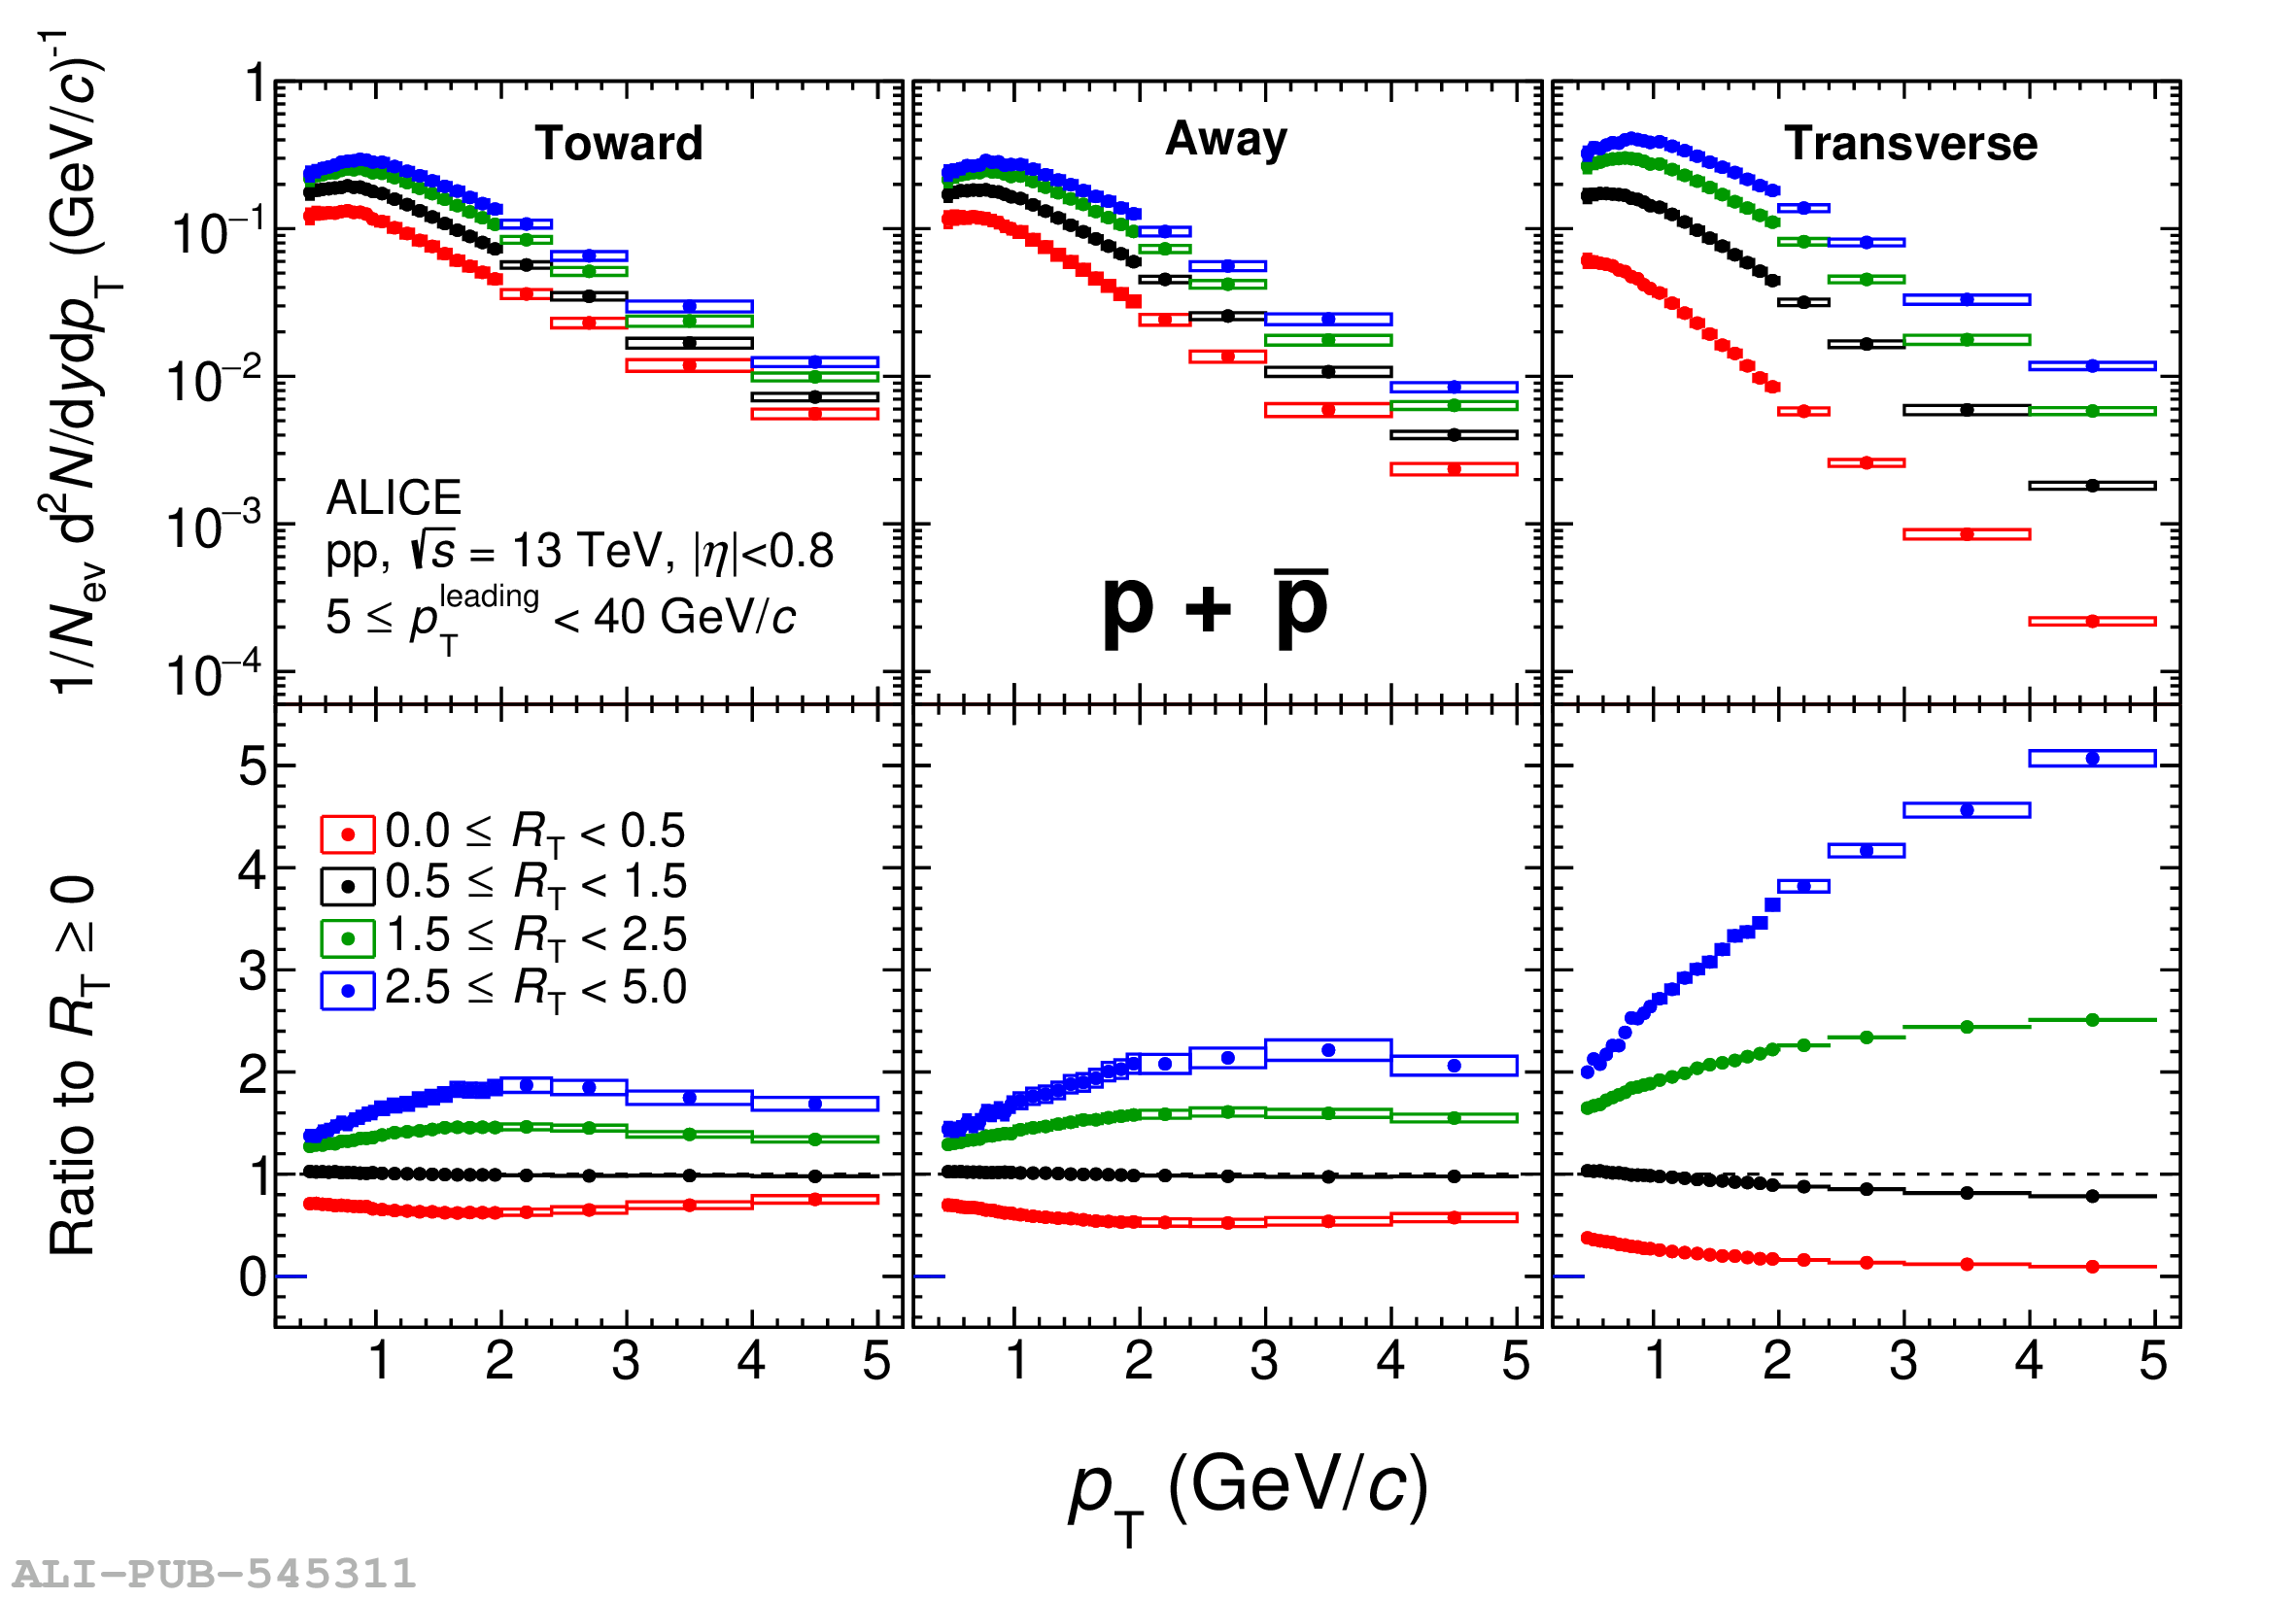 |
Figure 7
Model-to-data ratios of the transverse momentum spectra. The results are shown for two $R_{\rm T}$ intervals: $0\leq R_{\rm T} < 0.5$ (top figure) and $2.5\leq R_{\rm T} < 5$ (bottom figure). The ratios in the toward, away and transverse regions are shown on the left, middle and right column, respectively. The error bands represent the combination of the statistical and systematic uncertainties on the model-to-data ratios. | 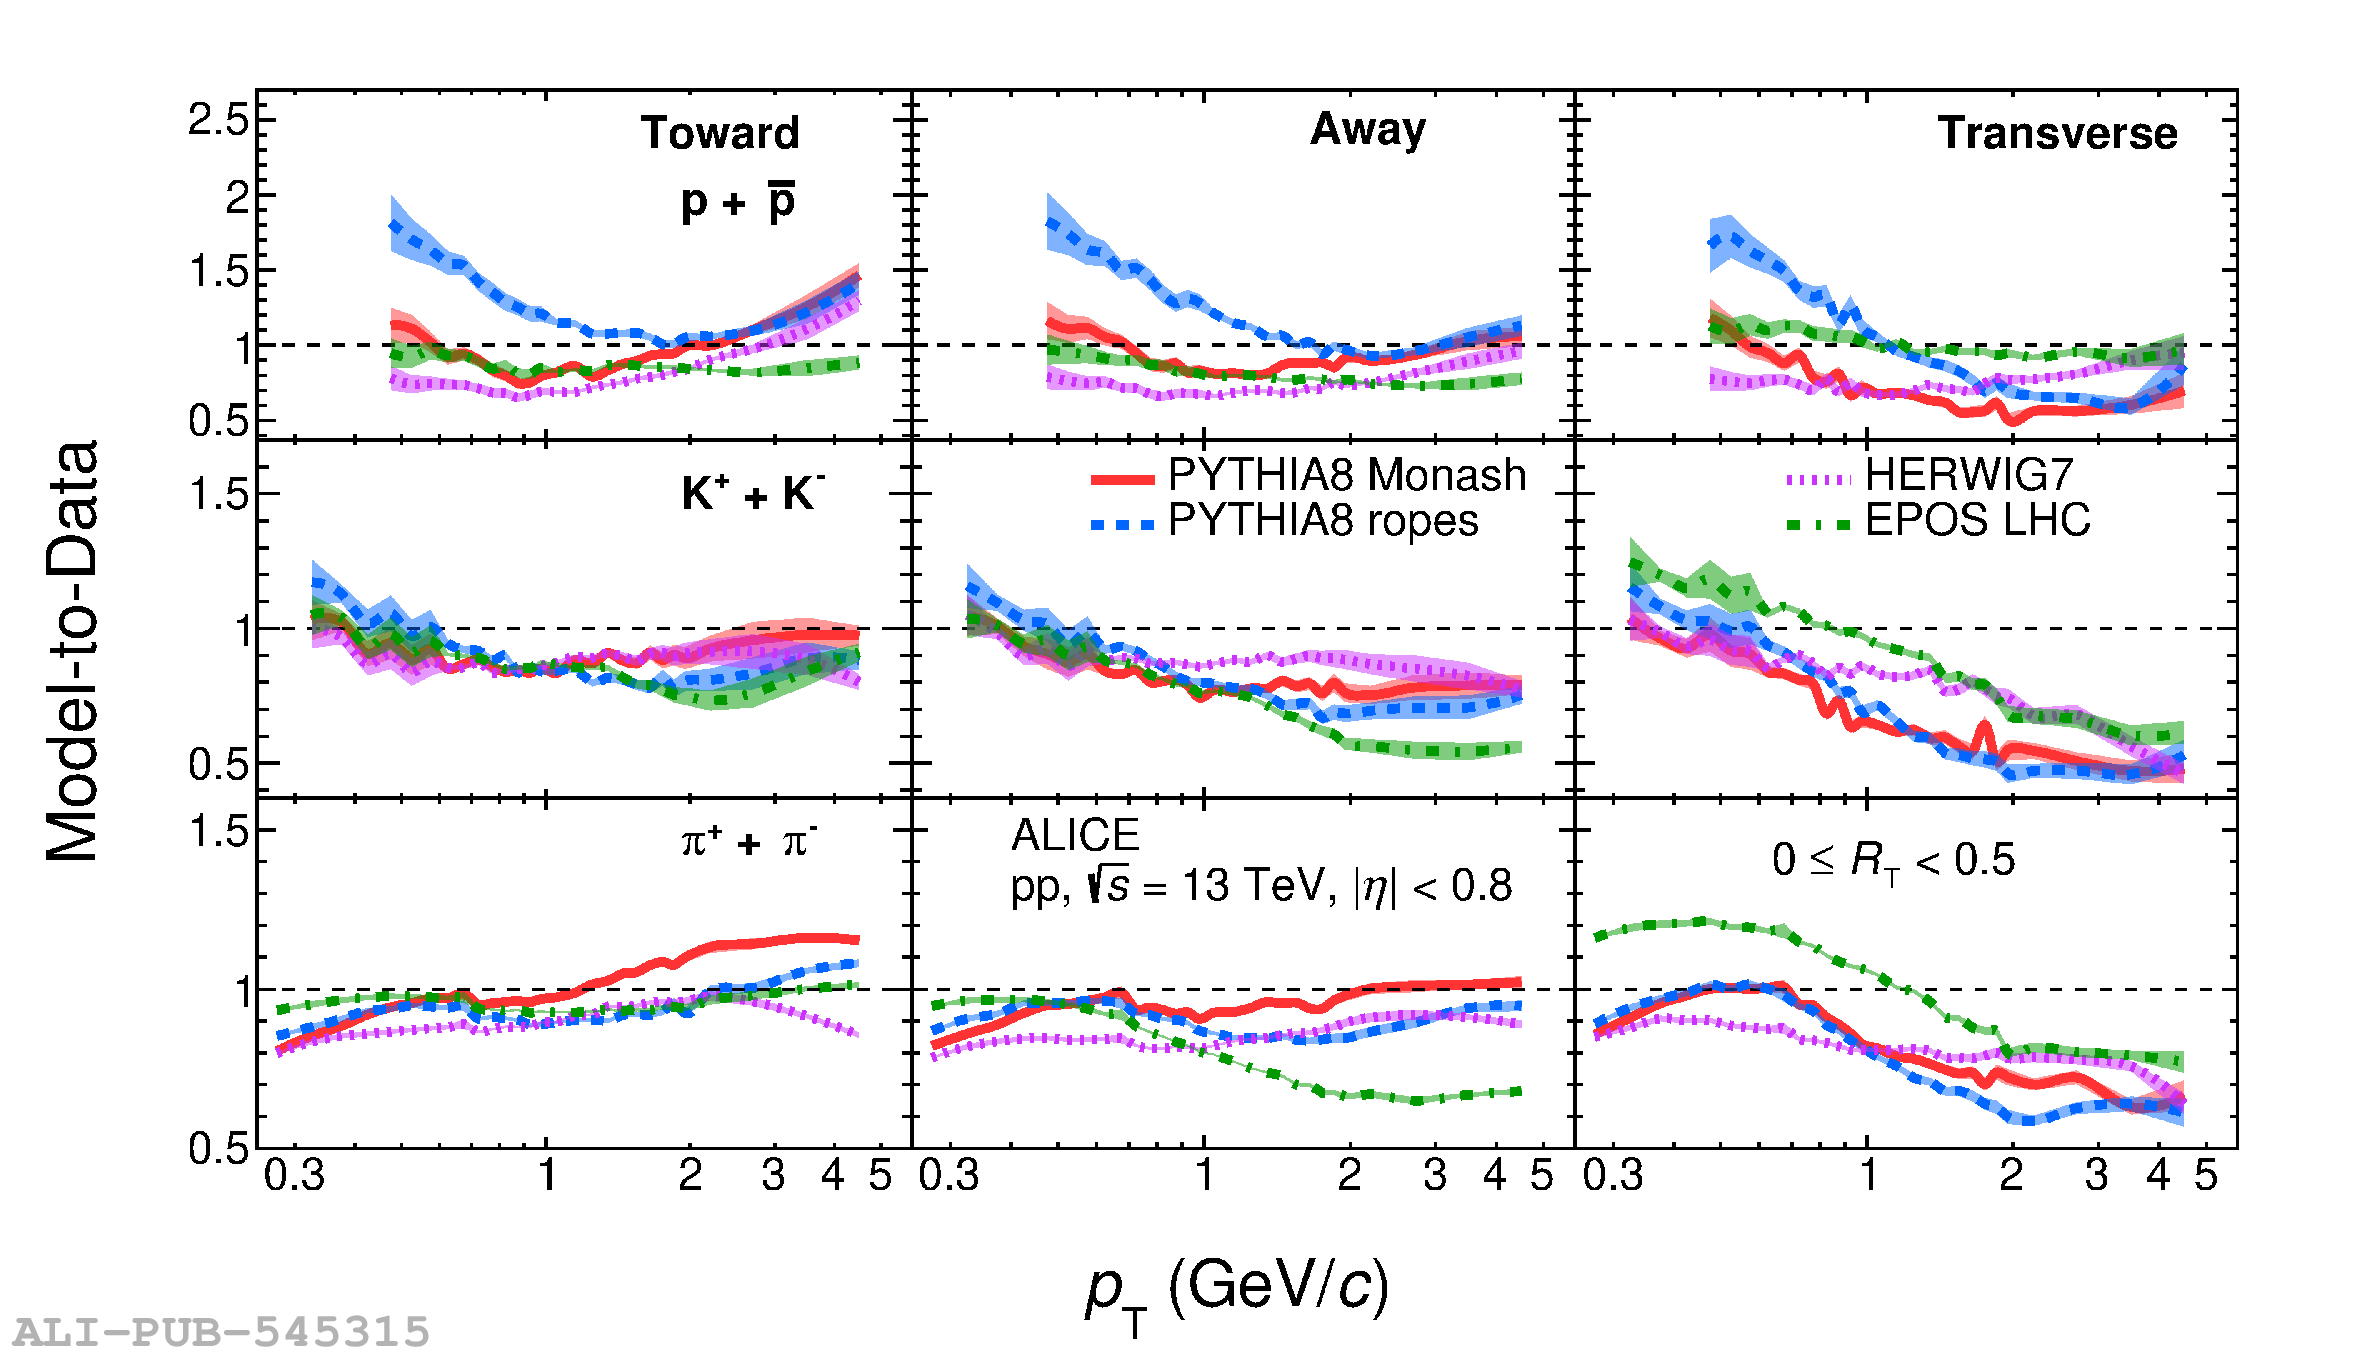 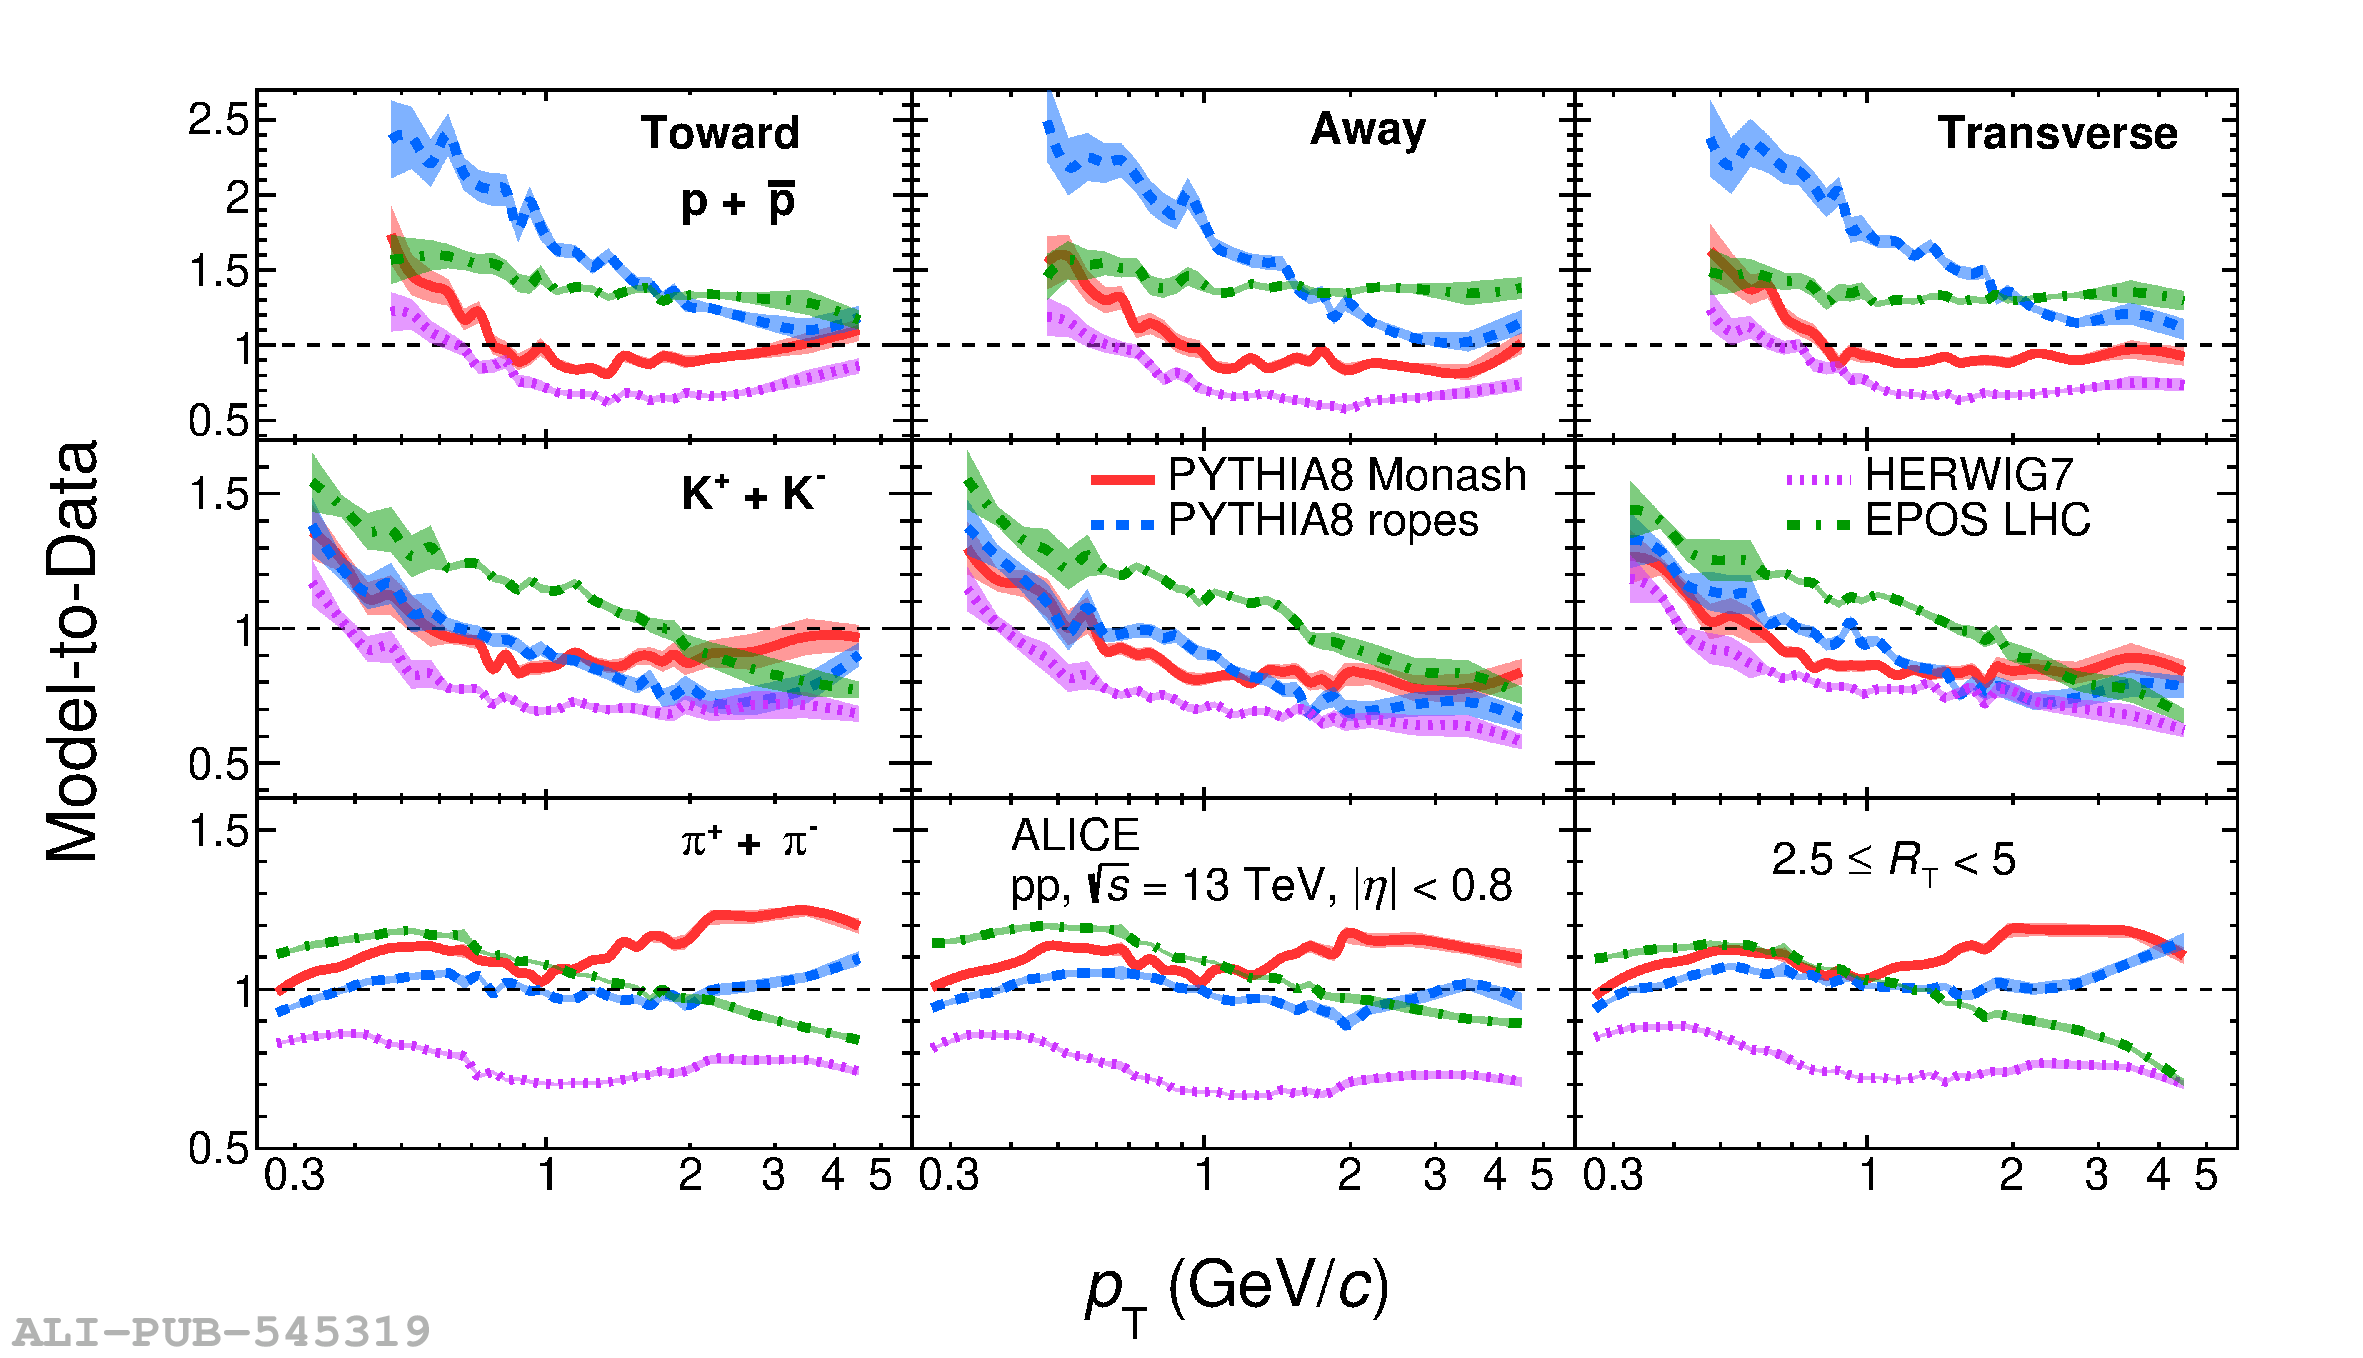 |
Figure 8
$p_{\rm T}$-differential particle ratios as a function of $R_{\rm T}$. The top (bottom) row shows the ${\rm K}/\pi$ (${\rm p}/\pi$) ratio. The results in the toward, away, and transverse regions are shown from left to right. Statistical and systematic uncertainties are represented with error bars and boxes, respectively. The inclusive minimum-bias particle ratios in pp collisions at the same centre-of-mass energy are overlaid. | 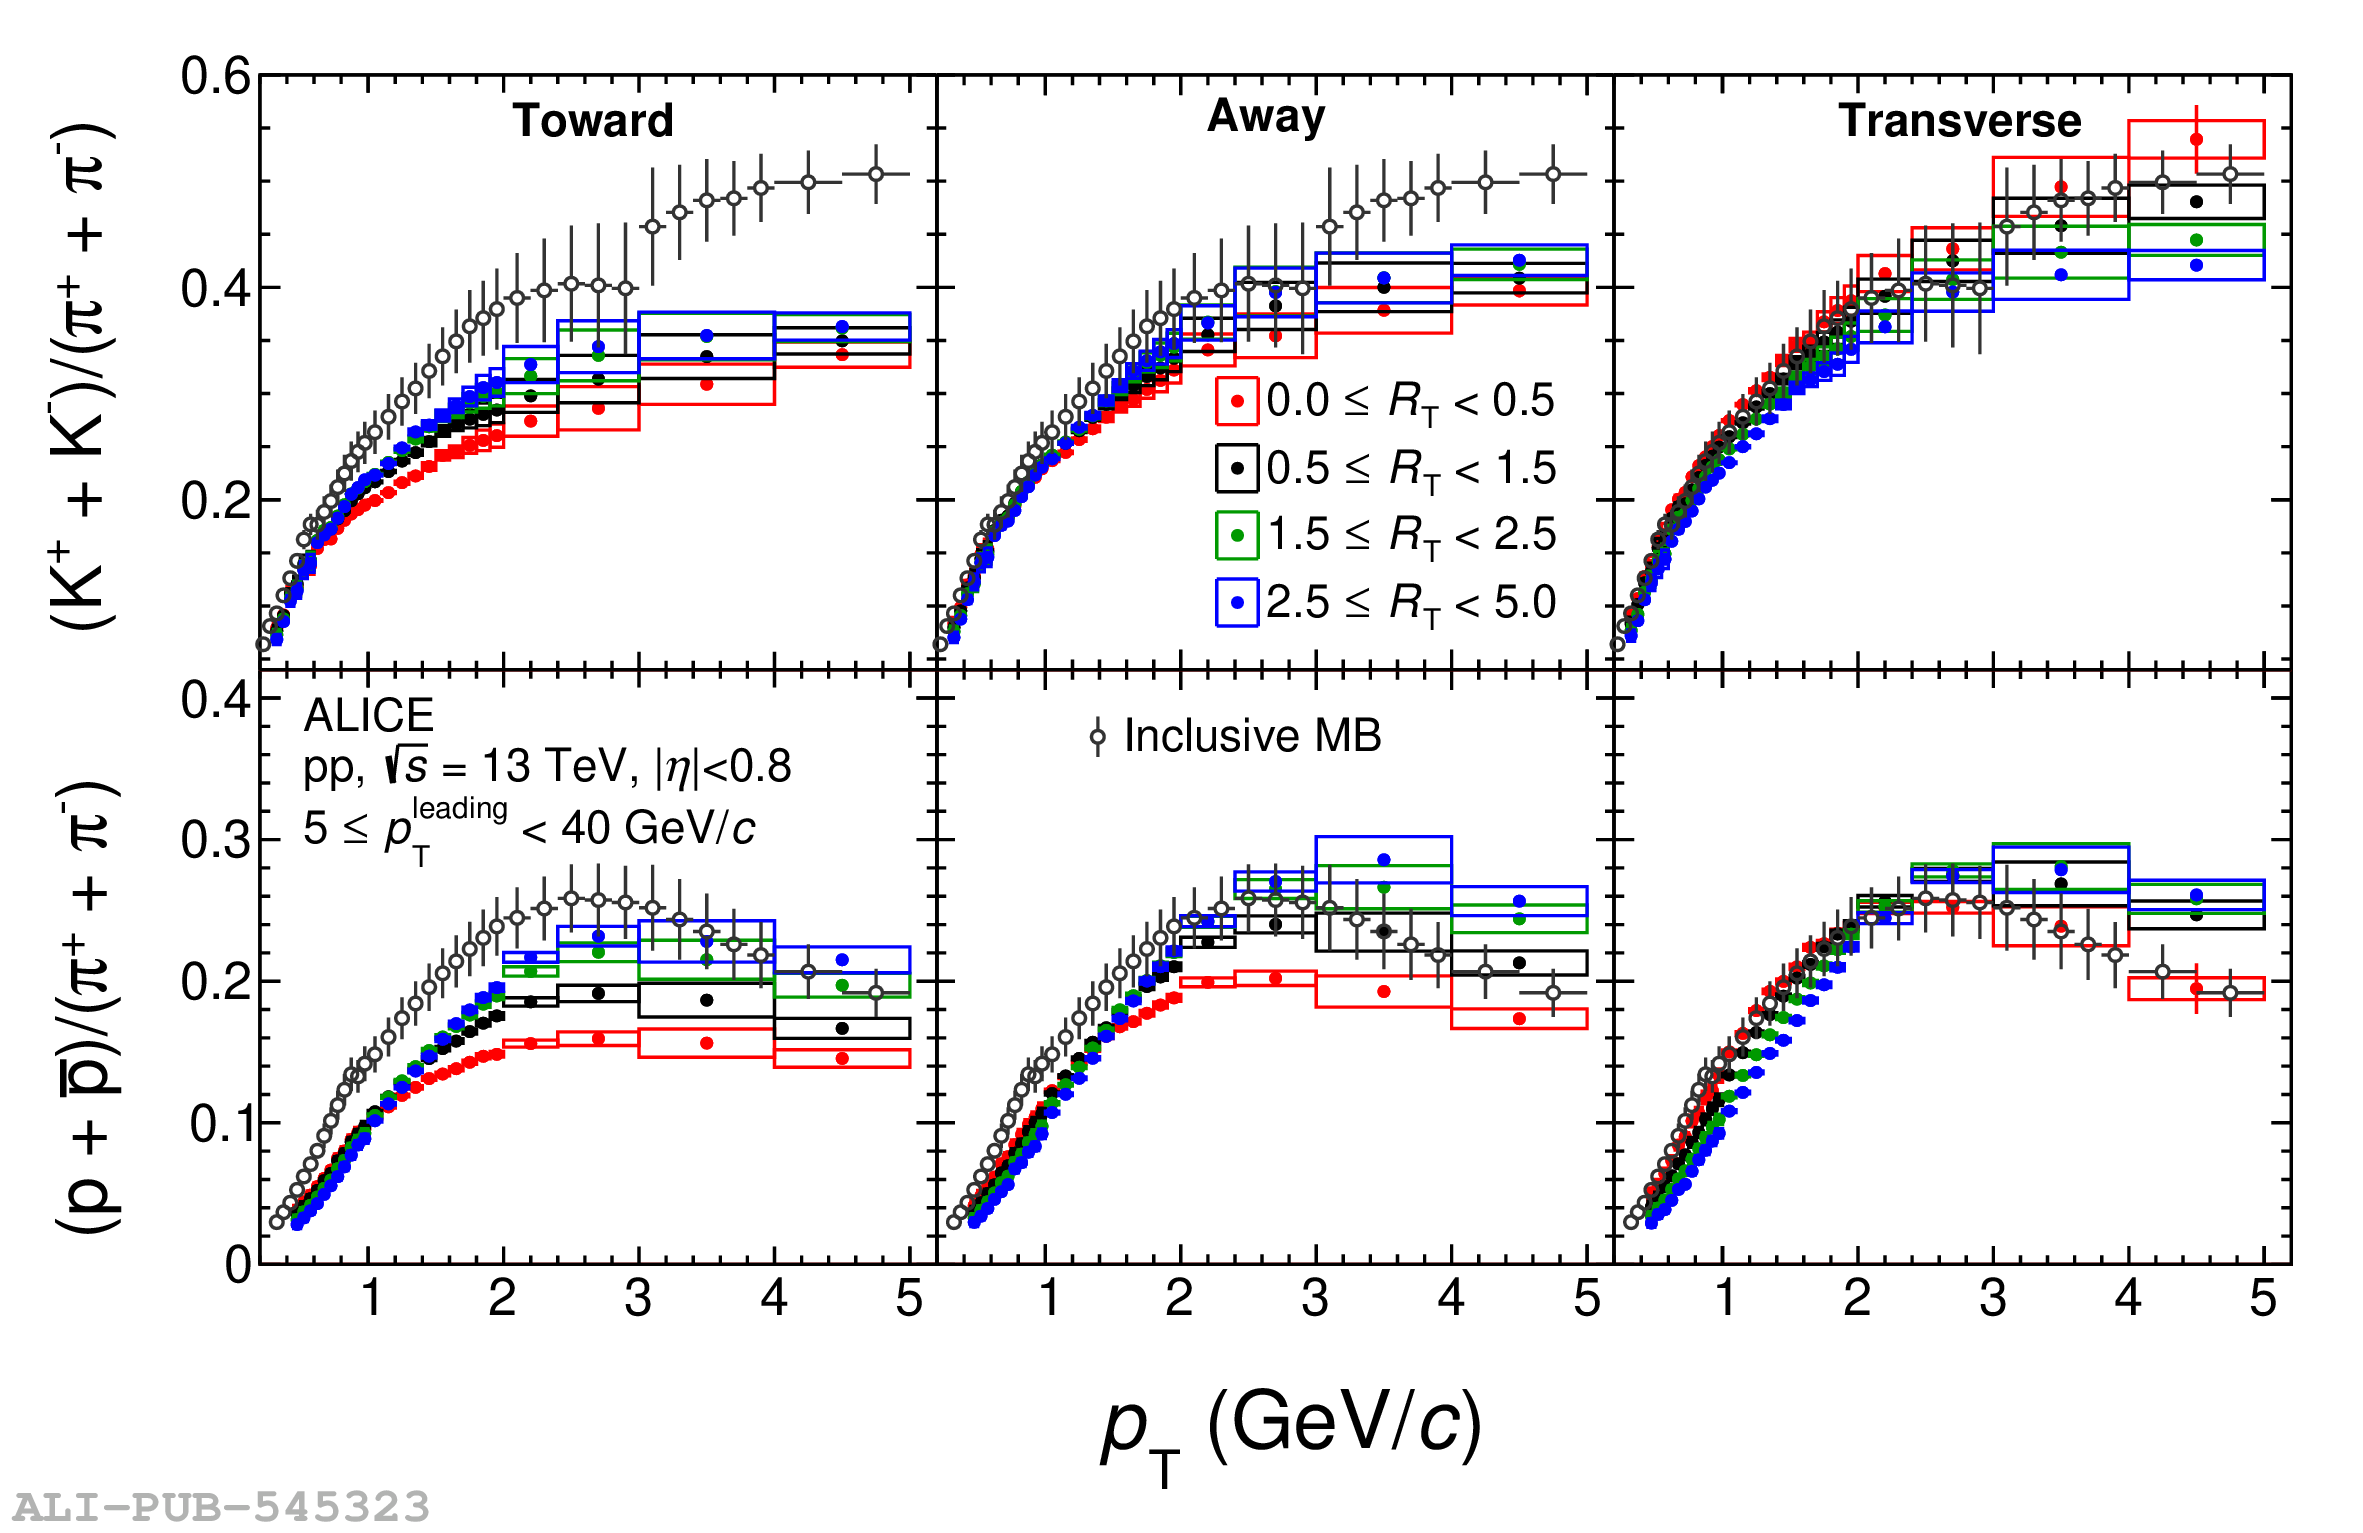 |
Figure 9
Kaon-to-pion and proton-to-pion ratios as a function of $p_{\rm T}$ for two $R_{\rm T}$ intervals: $0 \leq R_{\rm T} < 0.5$ (red markers) and $2.5 \leq R_{\rm T} < 5$ (blue markers). The particle ratios in the toward, away and, transverse regions are shown from left to right. The PYTHIA 8 Monash and PYTHIA 8 ropes (EPOS LHC and HERWIG7) predictions are shown in the top (bottom) figure. The shaded regions around the model line represent the statistical uncertainties. | 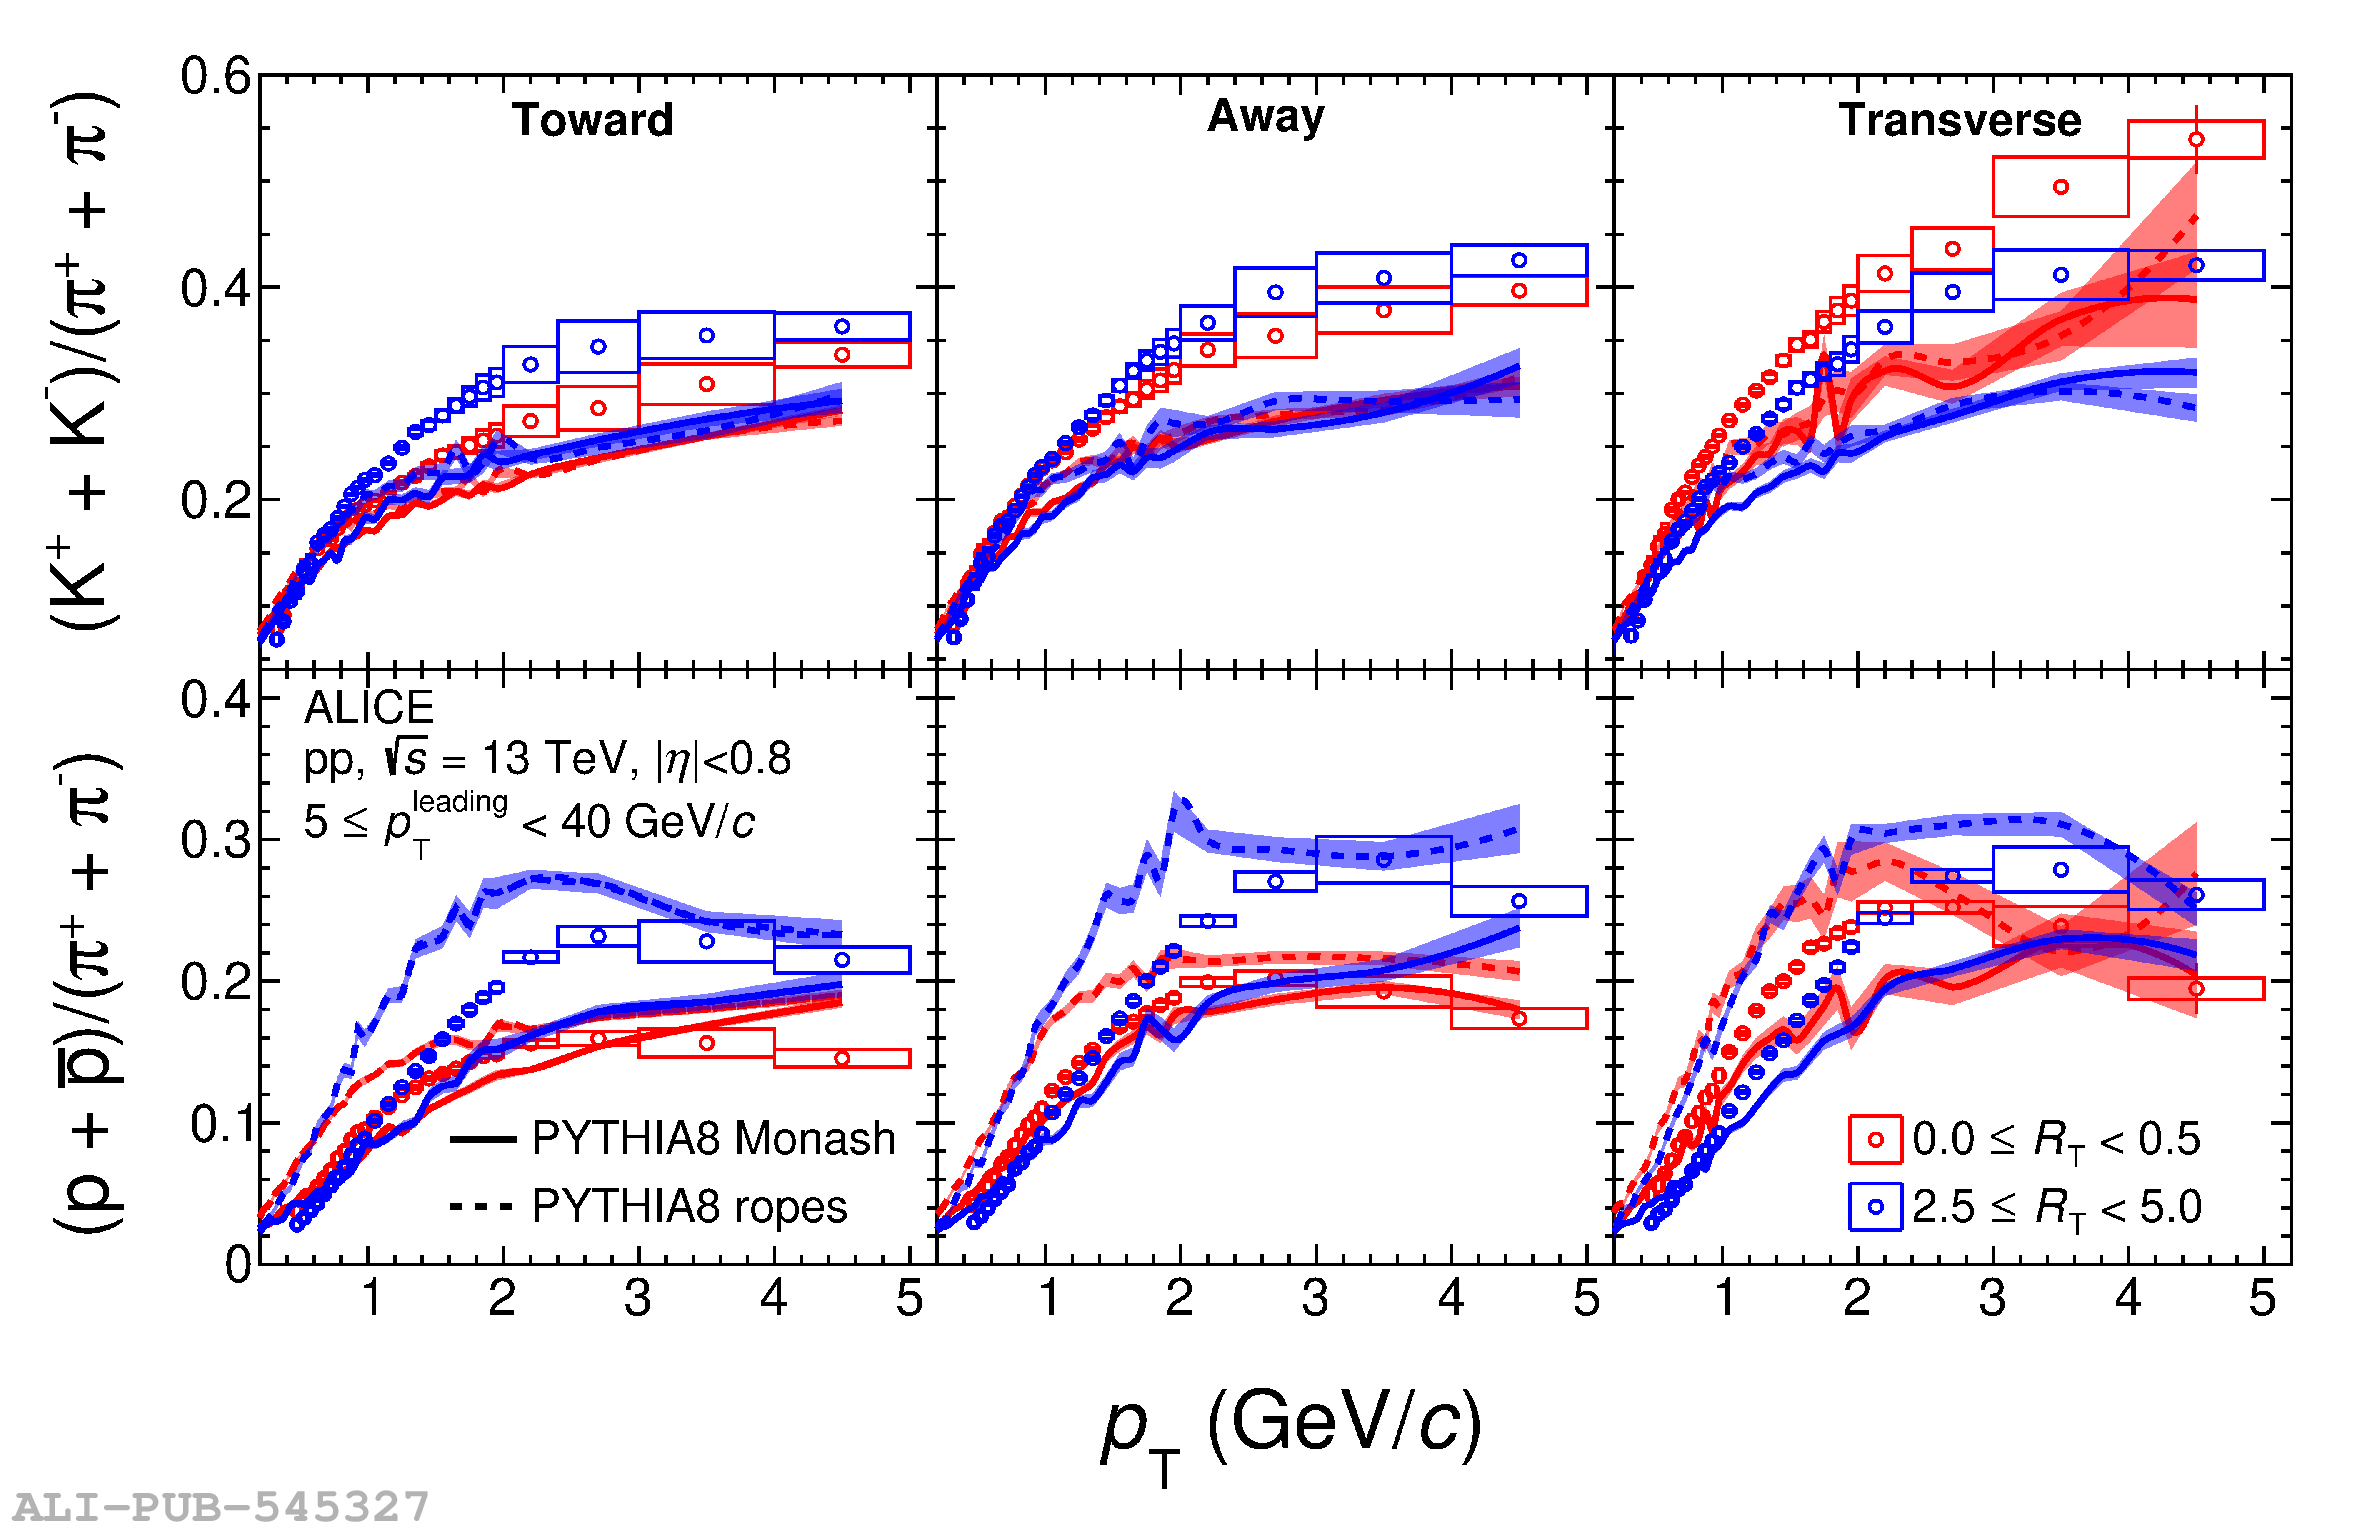 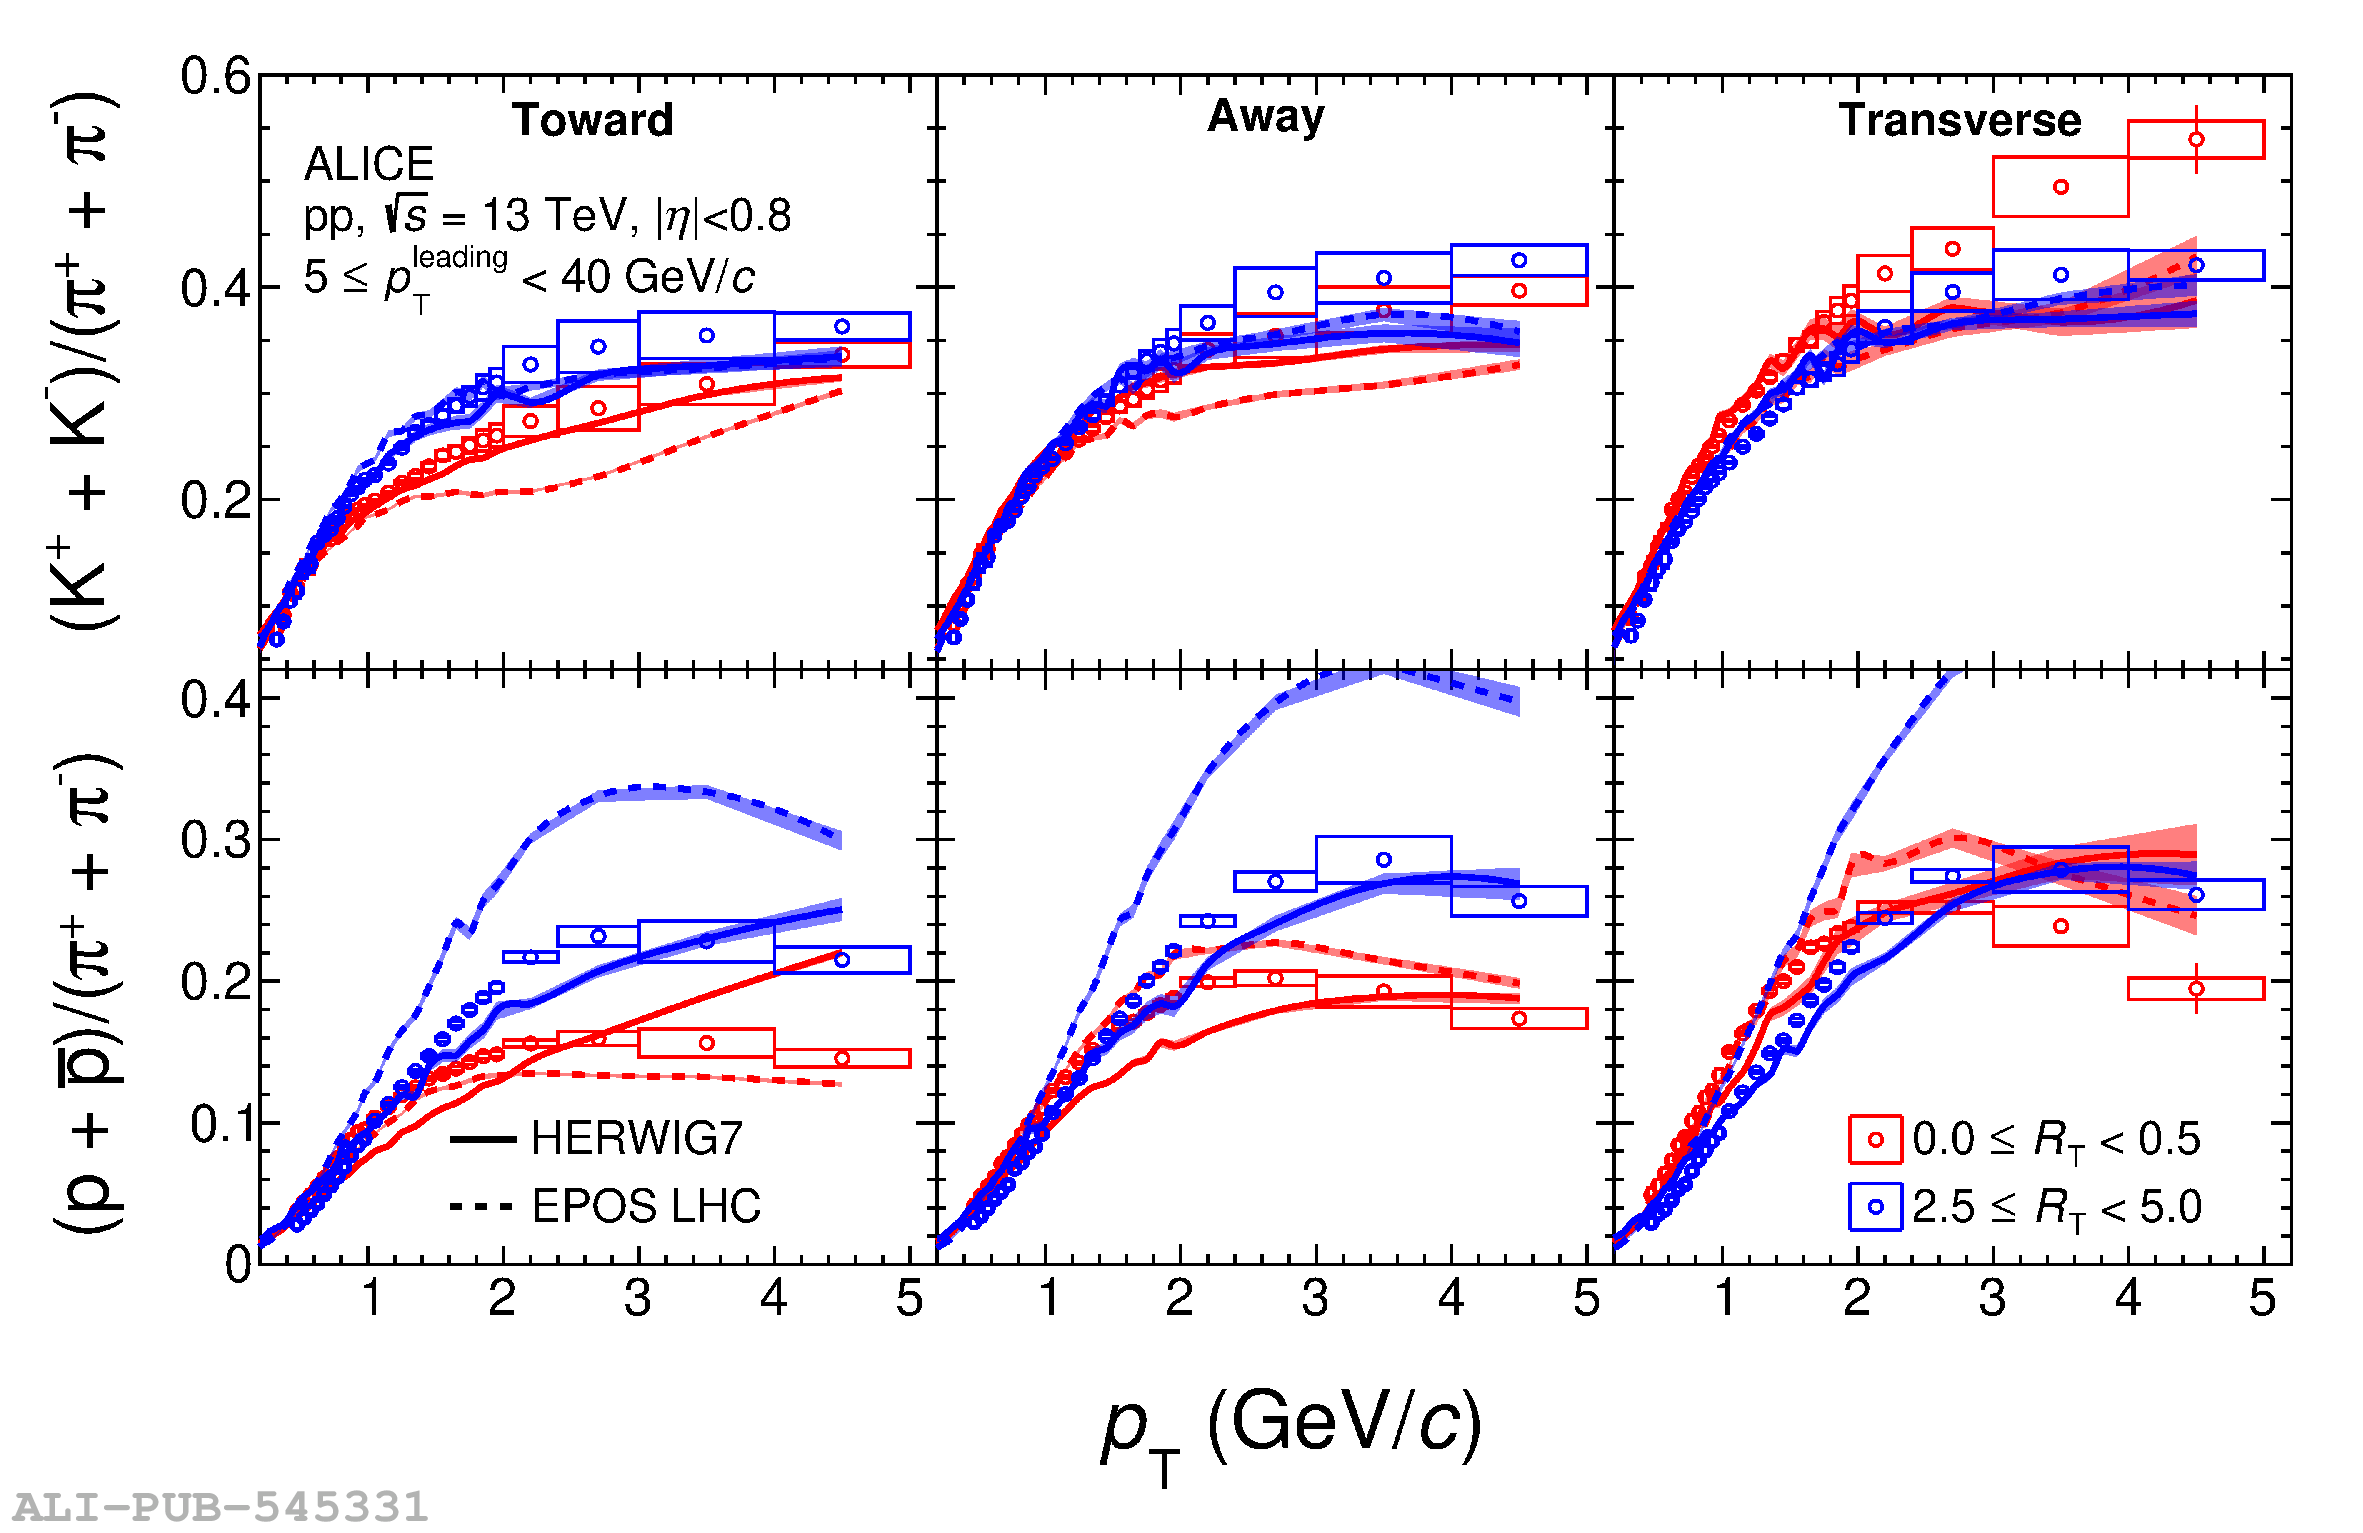 |
Figure 10
Average transverse momentum as a function of $R_{\rm T}$. The $\langle p_{\rm T} \rangle$ in the toward, away, and transverse regions are shown from left to right. The results for pion, kaon, and protons are shown in the first, second, and third row, respectively. Statistical and systematic uncertainties are represented with error bars and boxes, respectively. The shaded bands around the model lines represent the statistical uncertainties. | 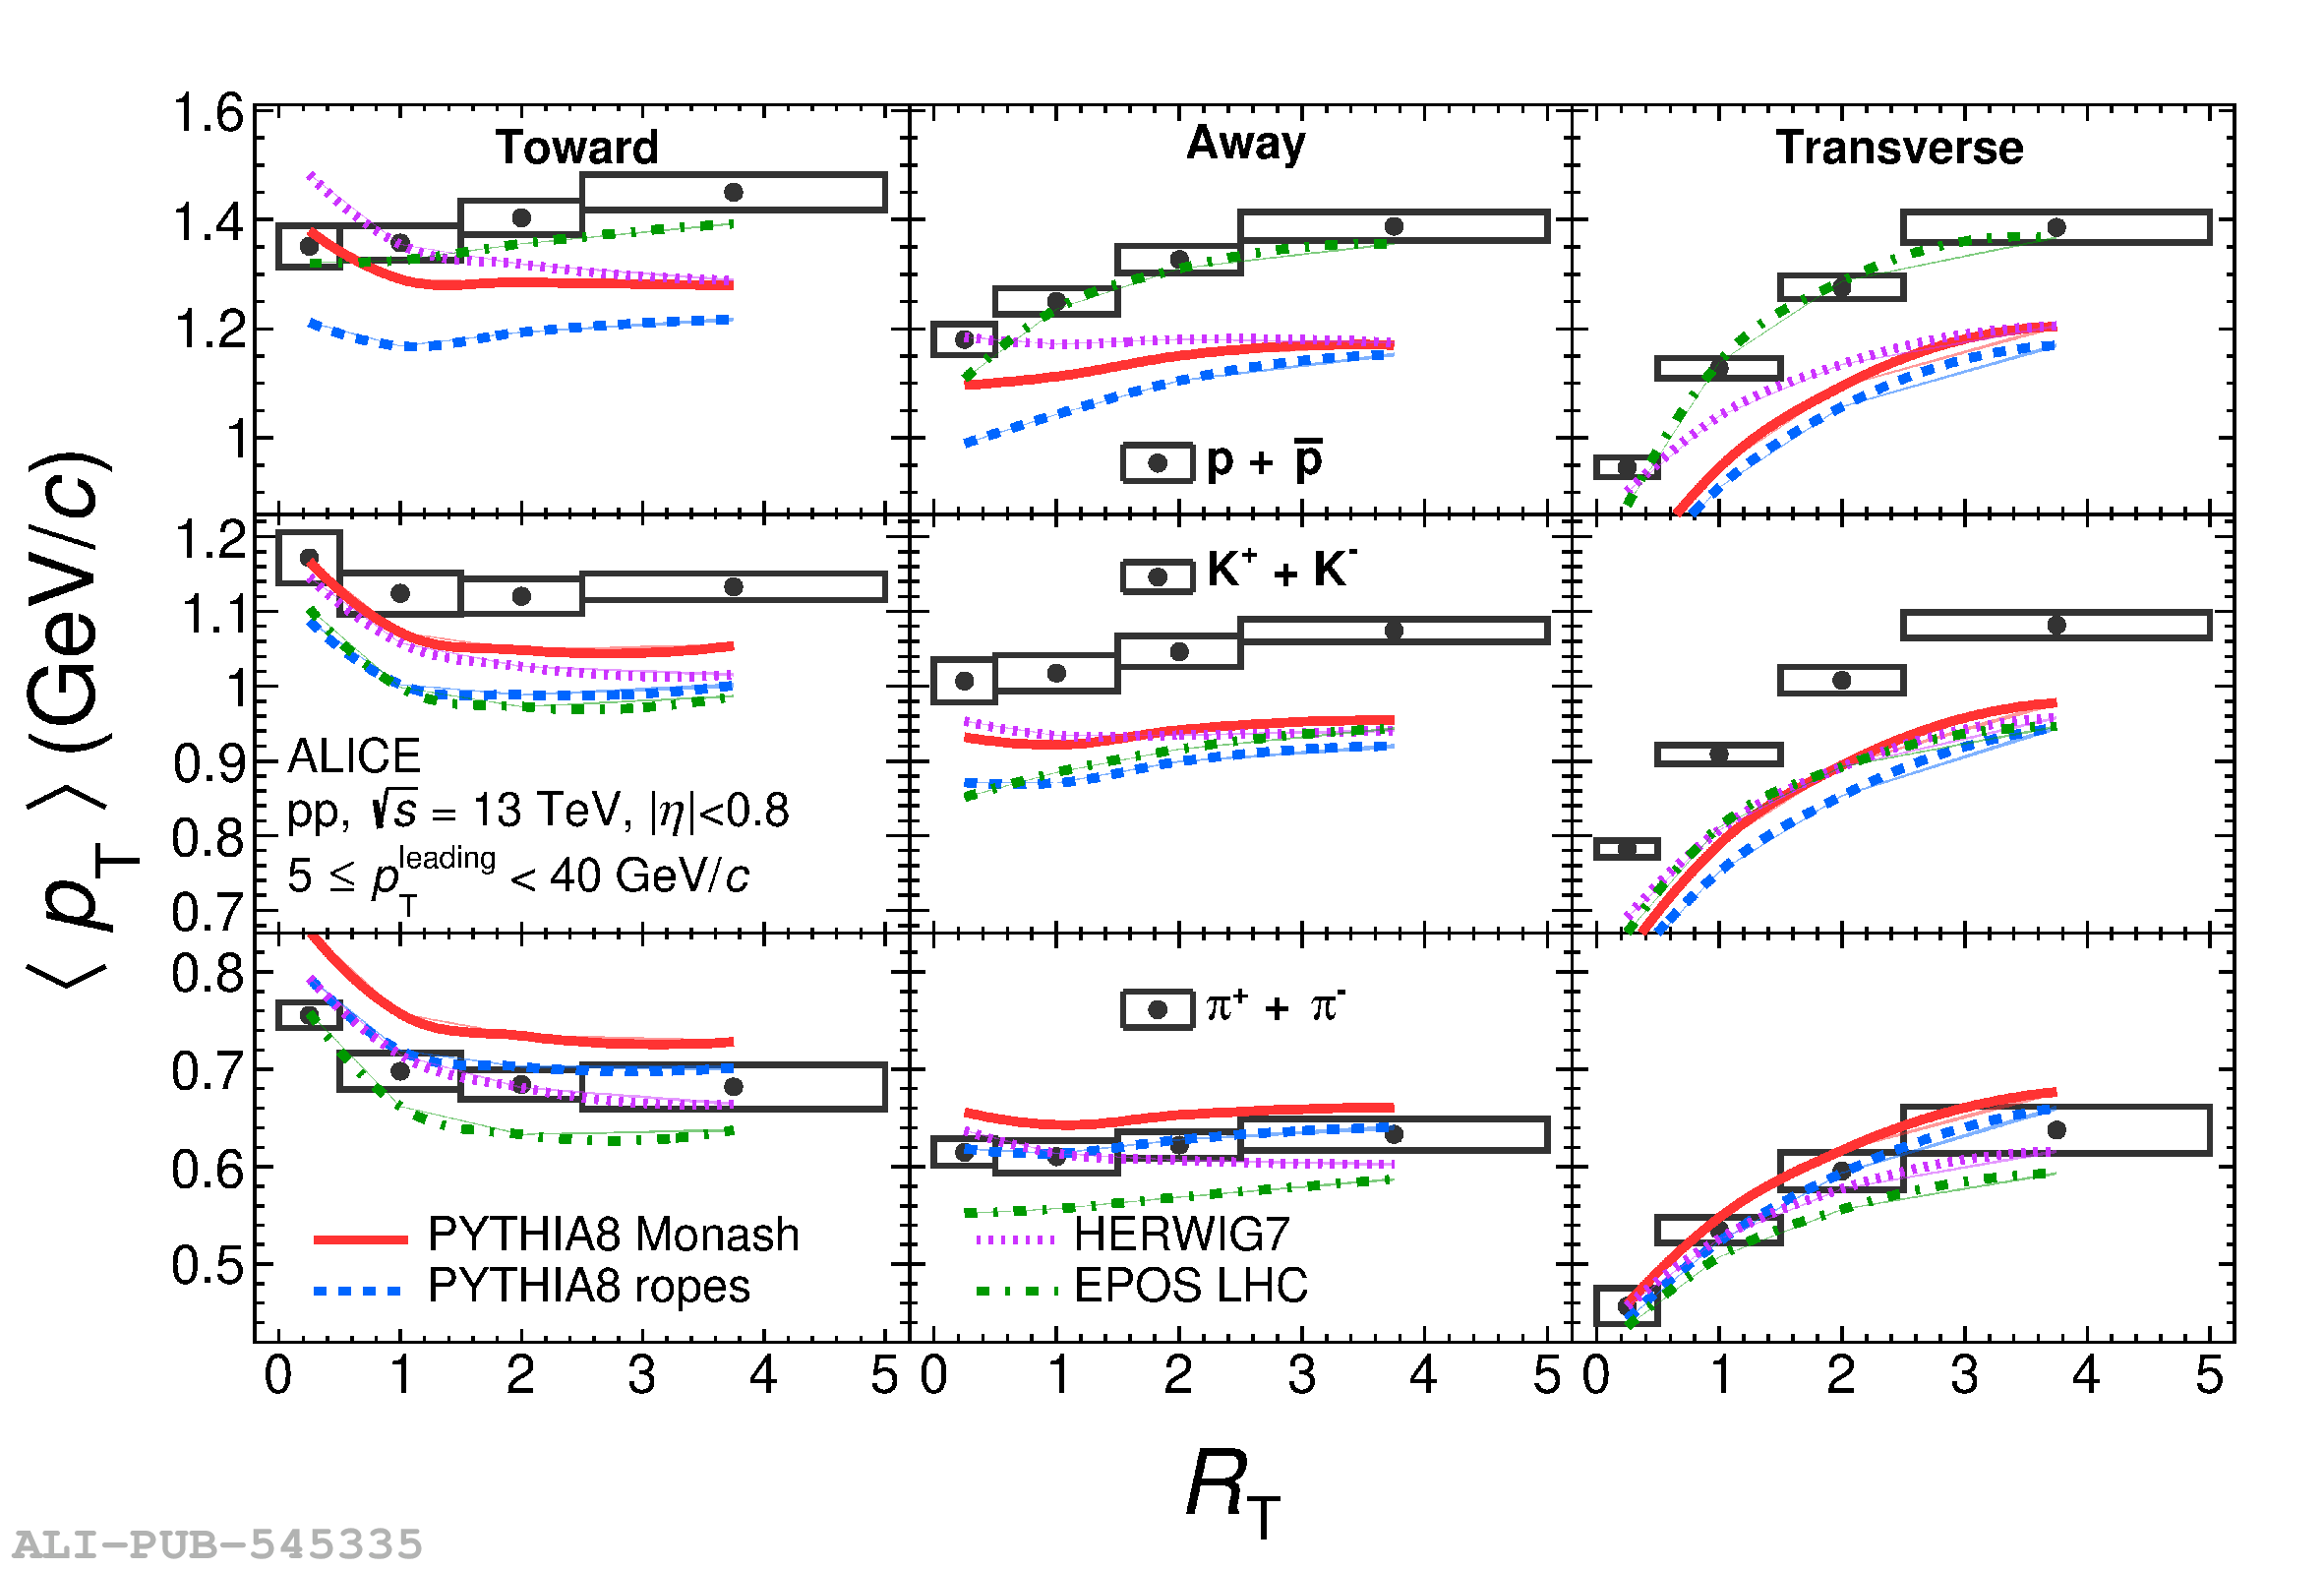 |
Figure 11
Transverse momentum-integrated particle ratios as a function of $R_{\rm T}$. The particle ratios in the toward, away, and transverse regions are shown from left to right. The top (bottom) row plots the ${\rm K}/\pi$ (${\rm p}/\pi$). The statistical and systematic uncertainties are represented with error bars and boxes, respectively. The shaded bands around the model lines represent the statistical uncertainties. | 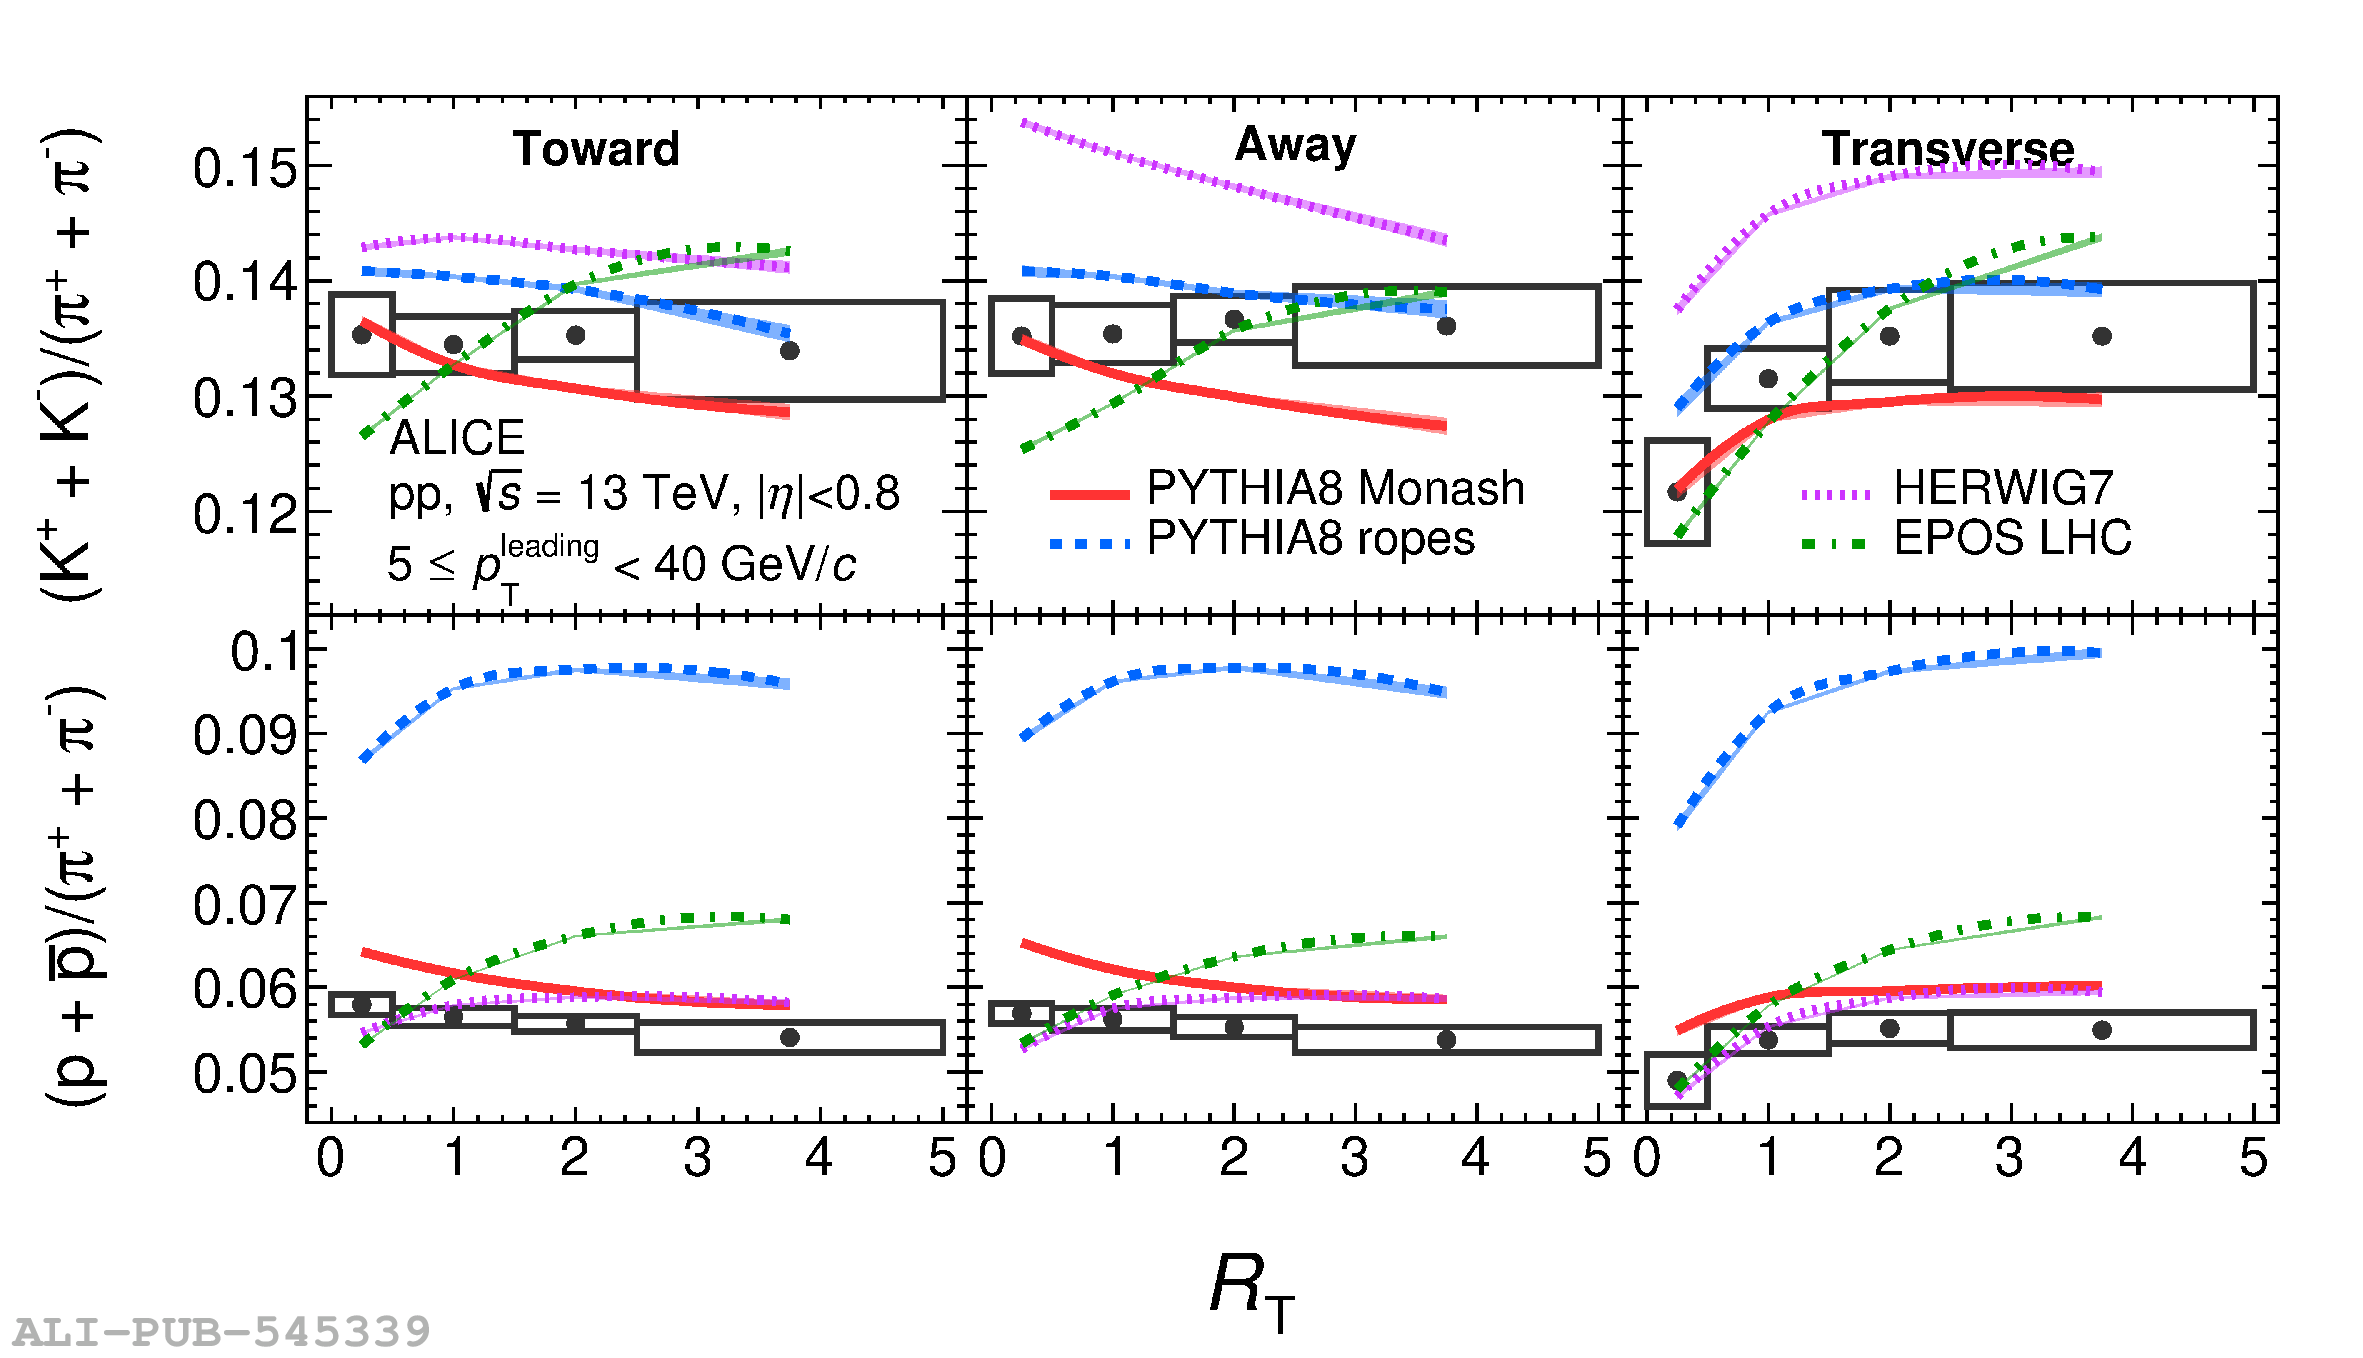 |