Model-to-data ratios of the transverse momentum spectra. The results are shown for two $R_{\rm T}$ intervals: $0\leq R_{\rm T} < 0.5$ (top figure) and $2.5\leq R_{\rm T} < 5$ (bottom figure). The ratios in the toward, away and transverse regions are shown on the left, middle and right column, respectively. The error bands represent the combination of the statistical and systematic uncertainties on the model-to-data ratios. | 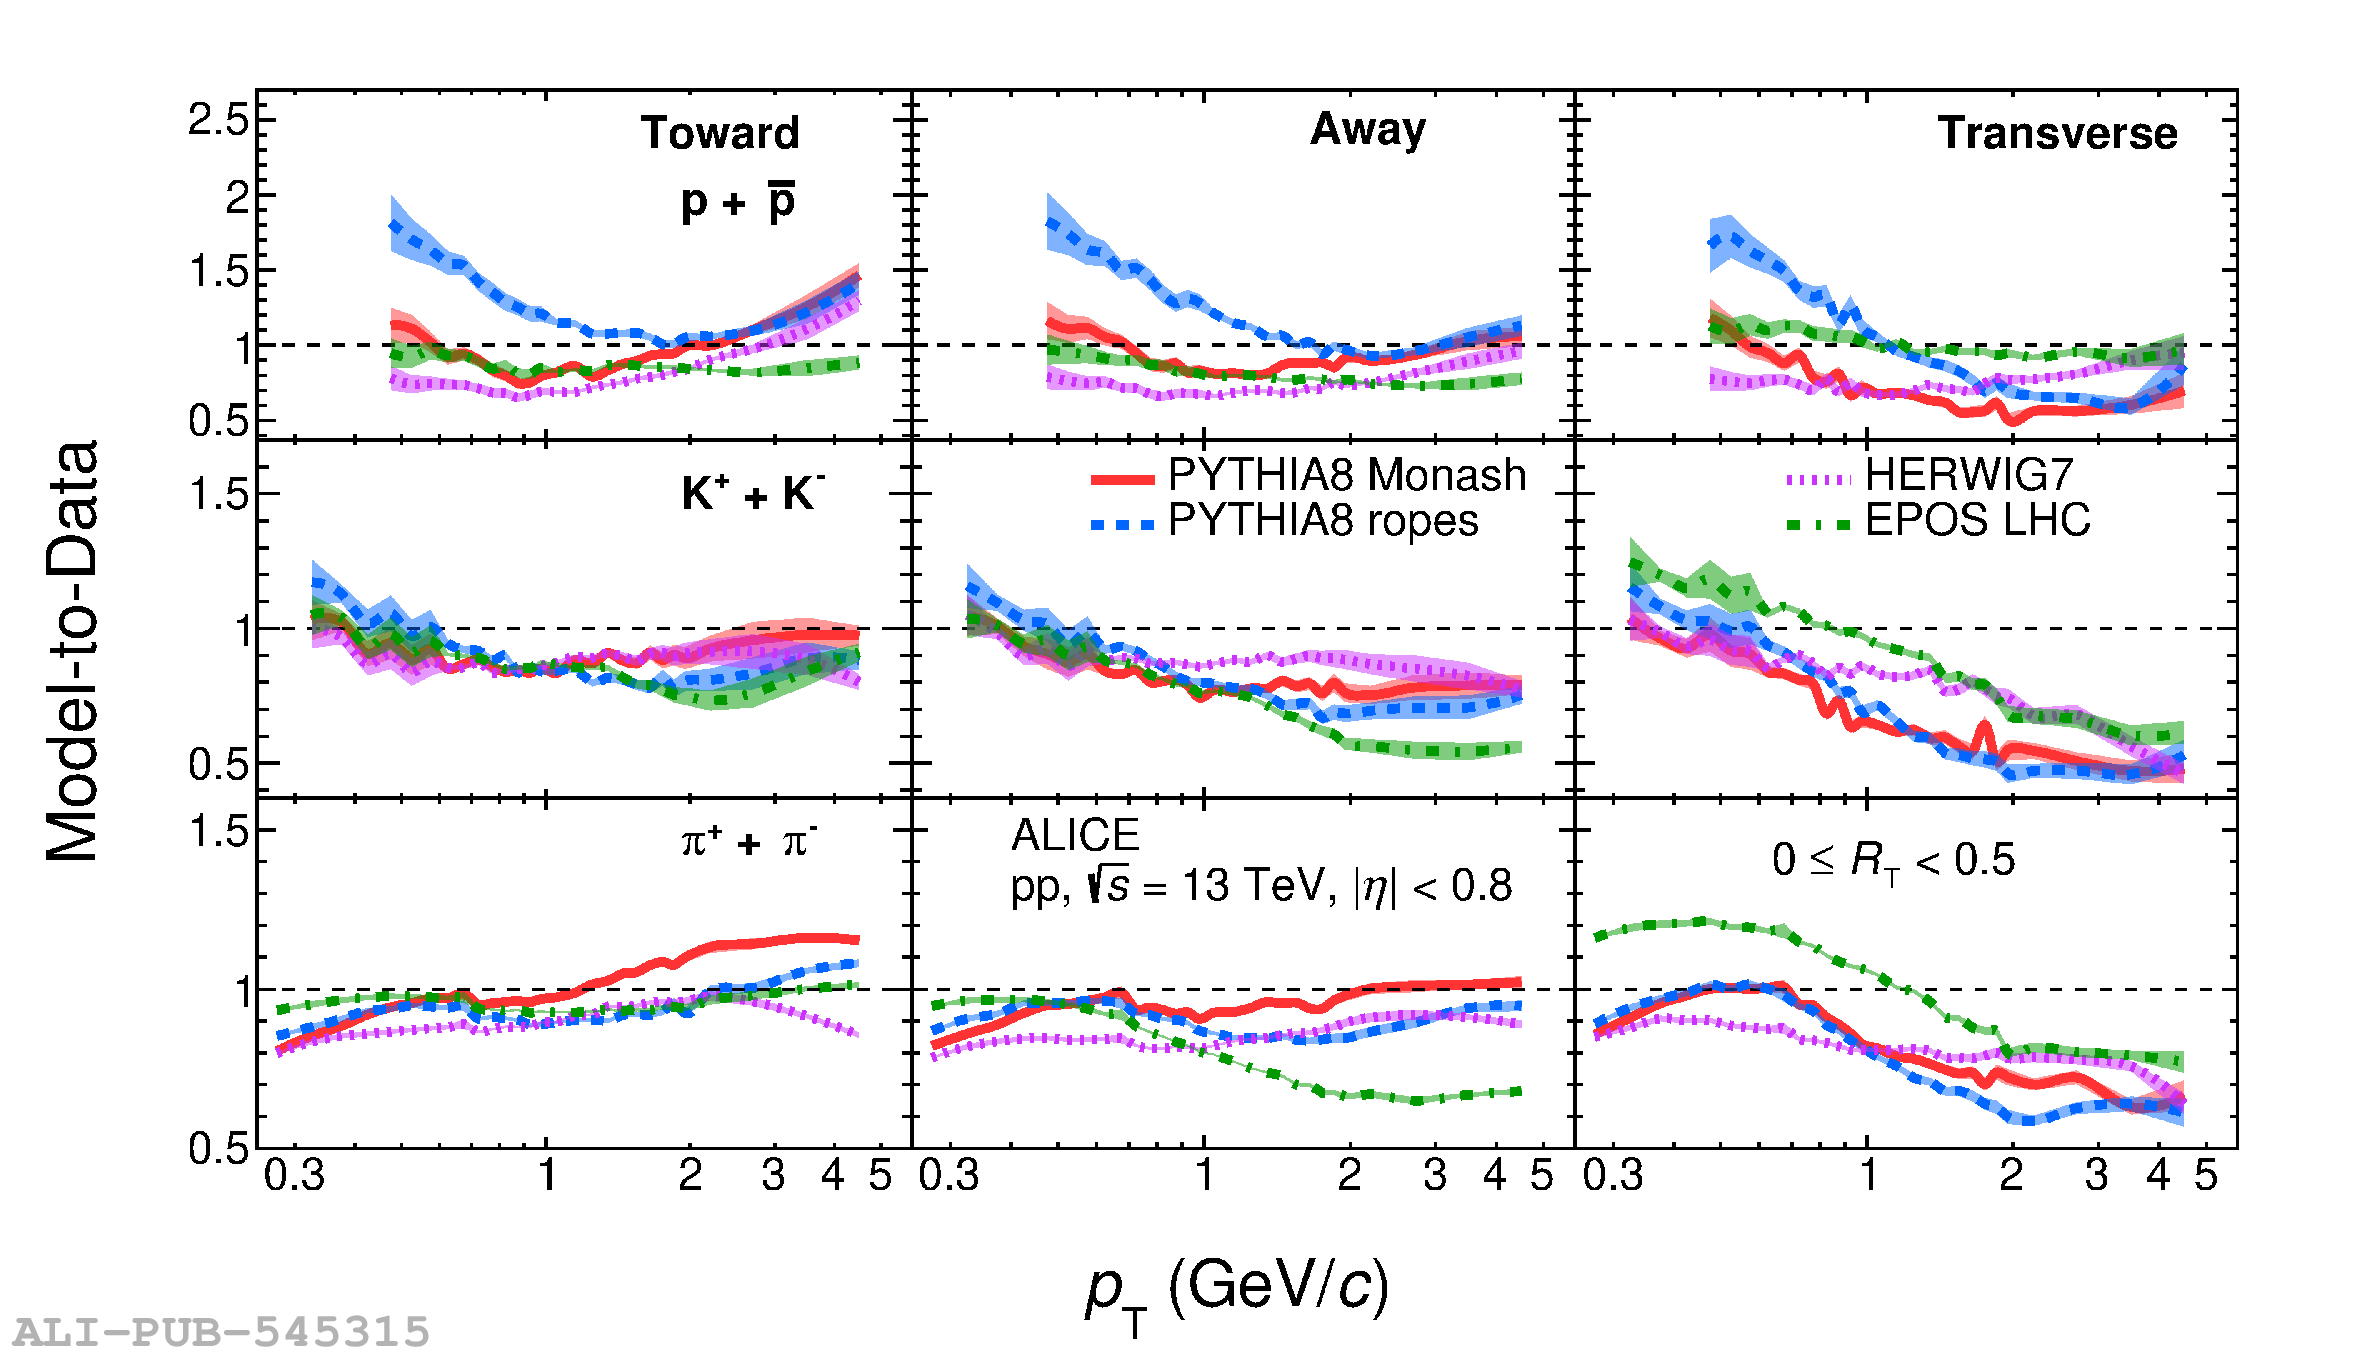 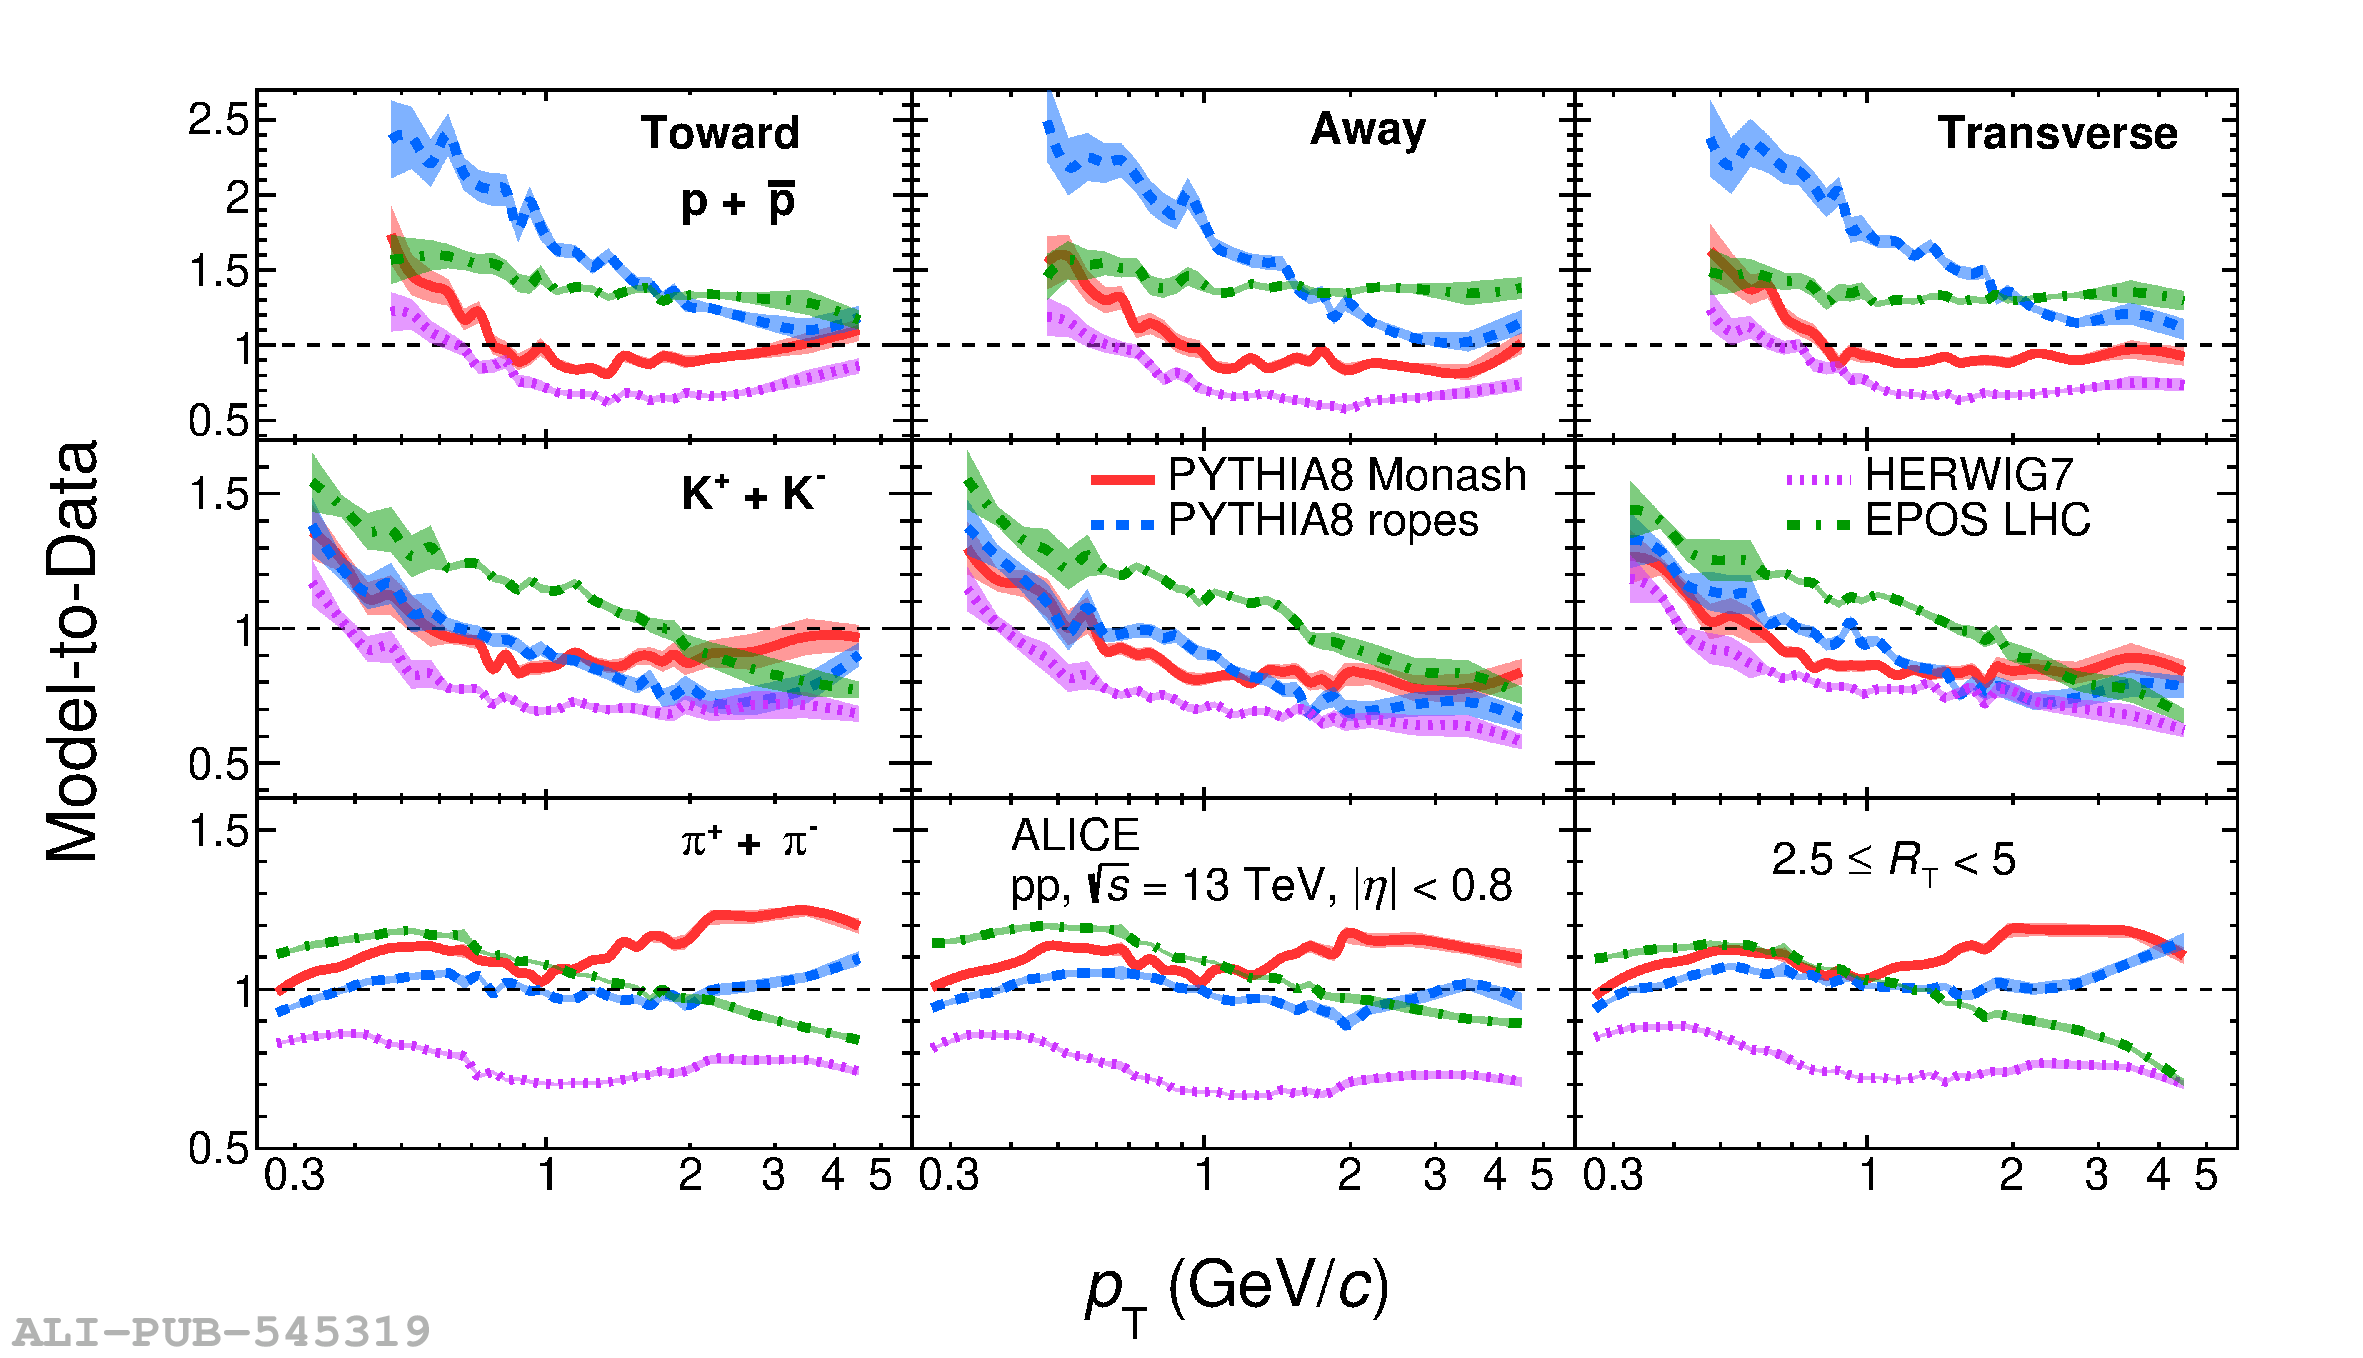 |