Transverse momentum-integrated particle ratios as a function of $R_{\rm T}$. The particle ratios in the toward, away, and transverse regions are shown from left to right. The top (bottom) row plots the ${\rm K}/\pi$ (${\rm p}/\pi$). The statistical and systematic uncertainties are represented with error bars and boxes, respectively. The shaded bands around the model lines represent the statistical uncertainties. | 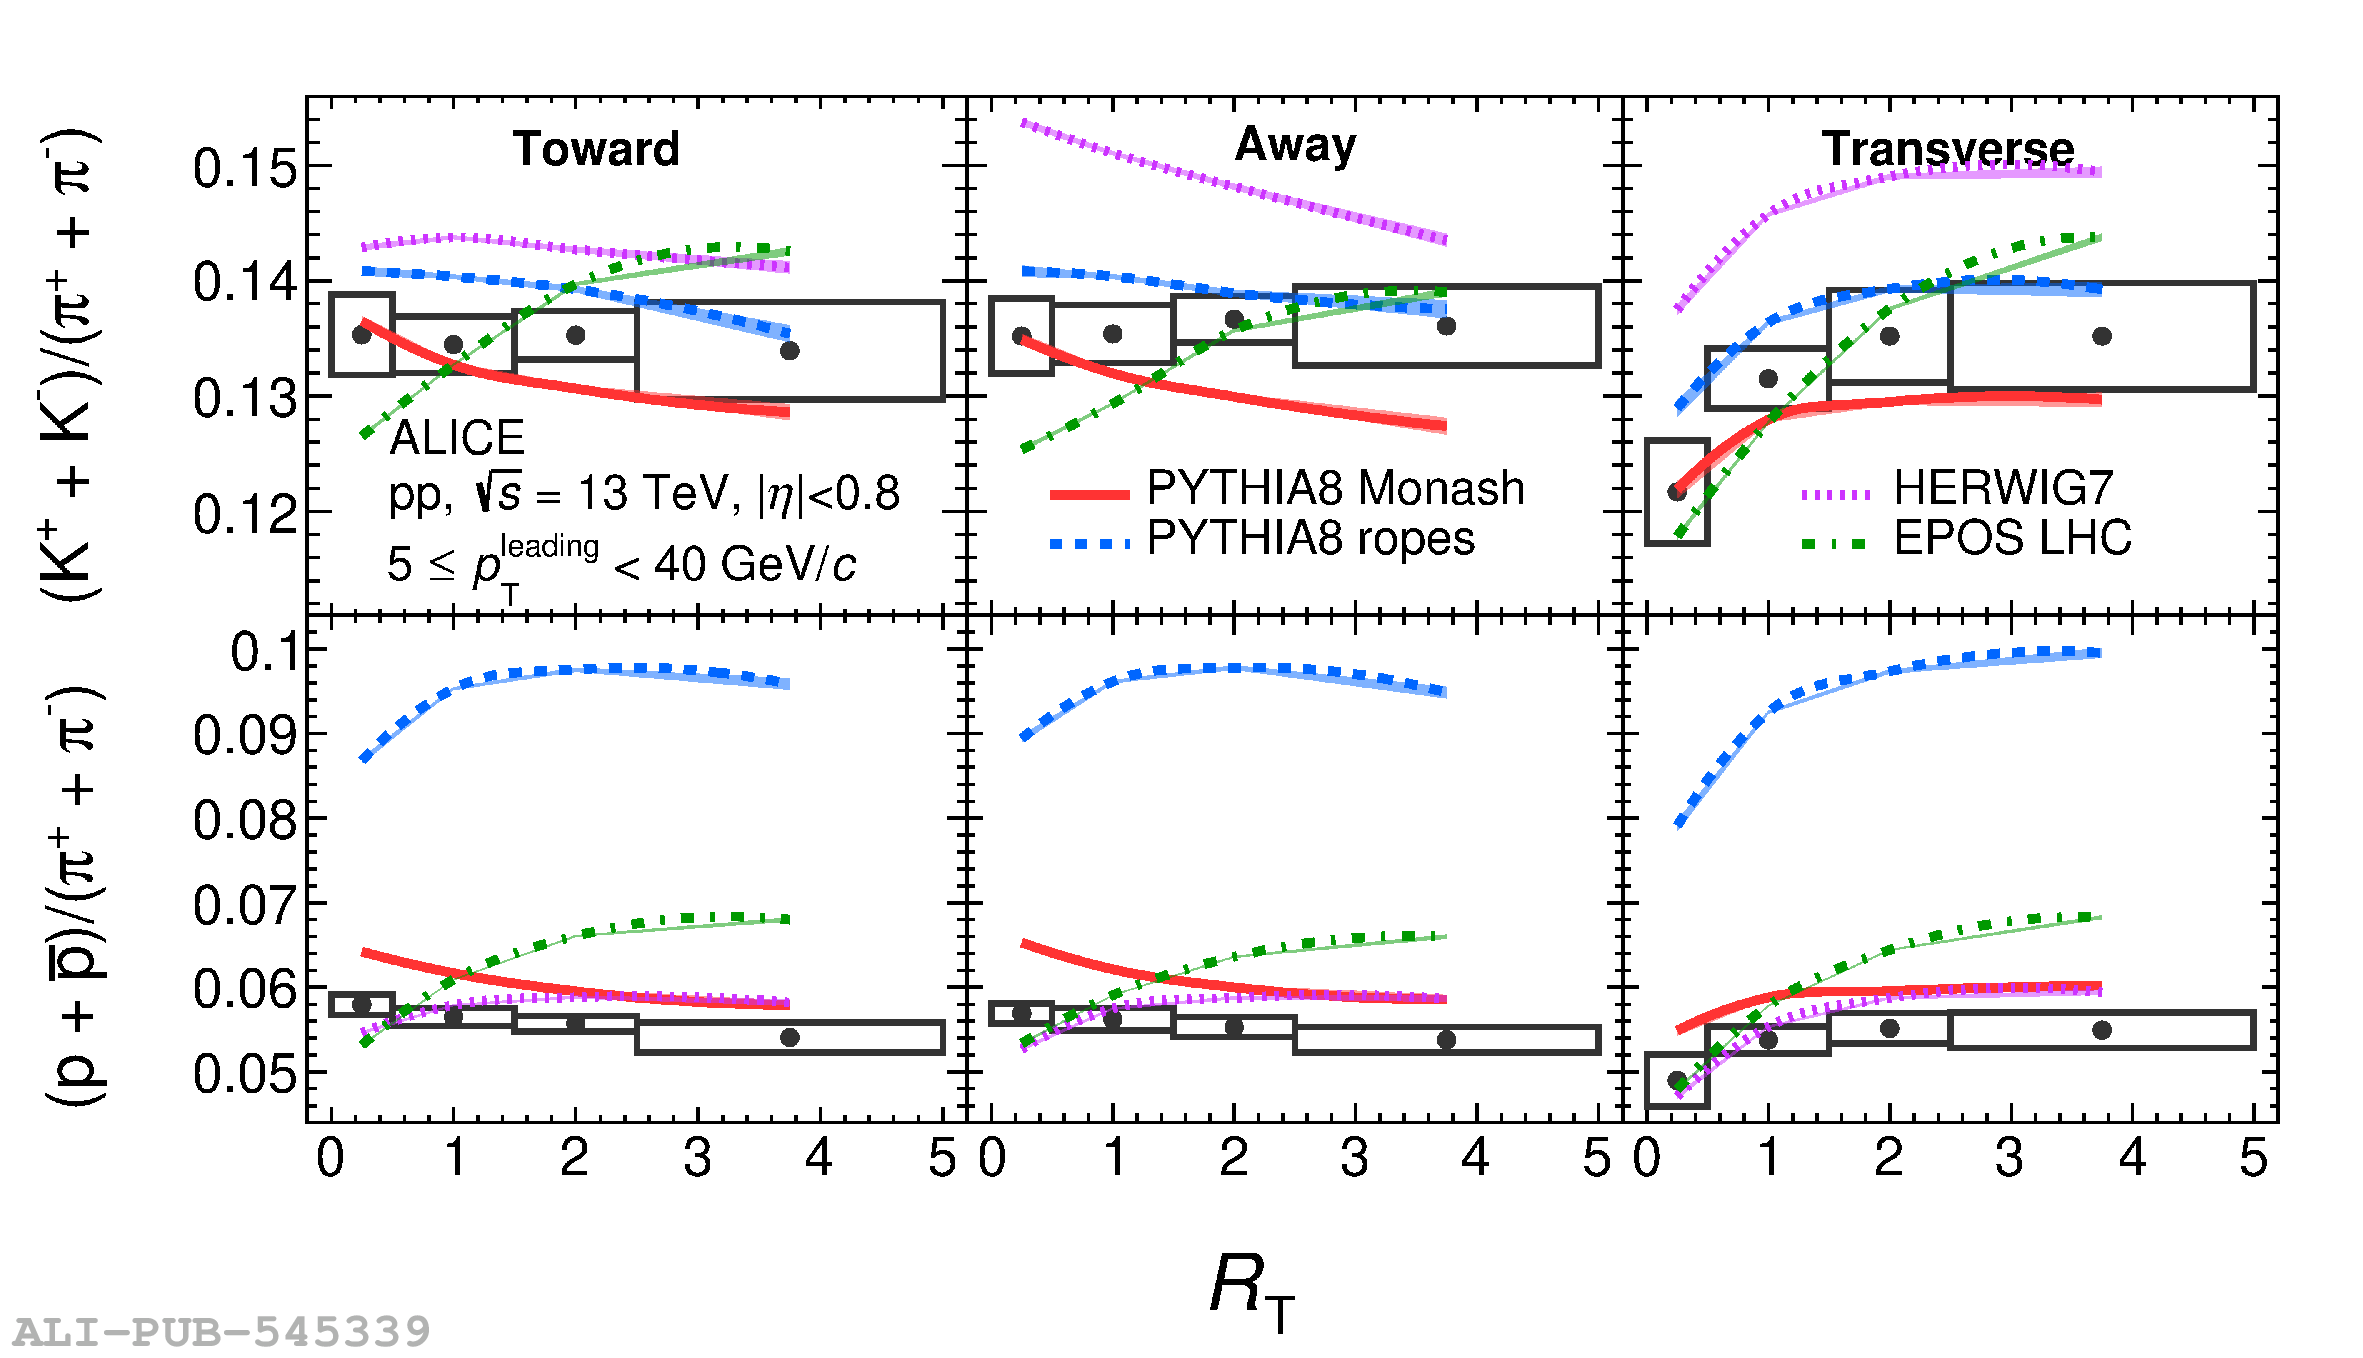 |