Kaon-to-pion and proton-to-pion ratios as a function of $p_{\rm T}$ for two $R_{\rm T}$ intervals: $0 \leq R_{\rm T} < 0.5$ (red markers) and $2.5 \leq R_{\rm T} < 5$ (blue markers). The particle ratios in the toward, away and, transverse regions are shown from left to right. The PYTHIA 8 Monash and PYTHIA 8 ropes (EPOS LHC and HERWIG7) predictions are shown in the top (bottom) figure. The shaded regions around the model line represent the statistical uncertainties. | 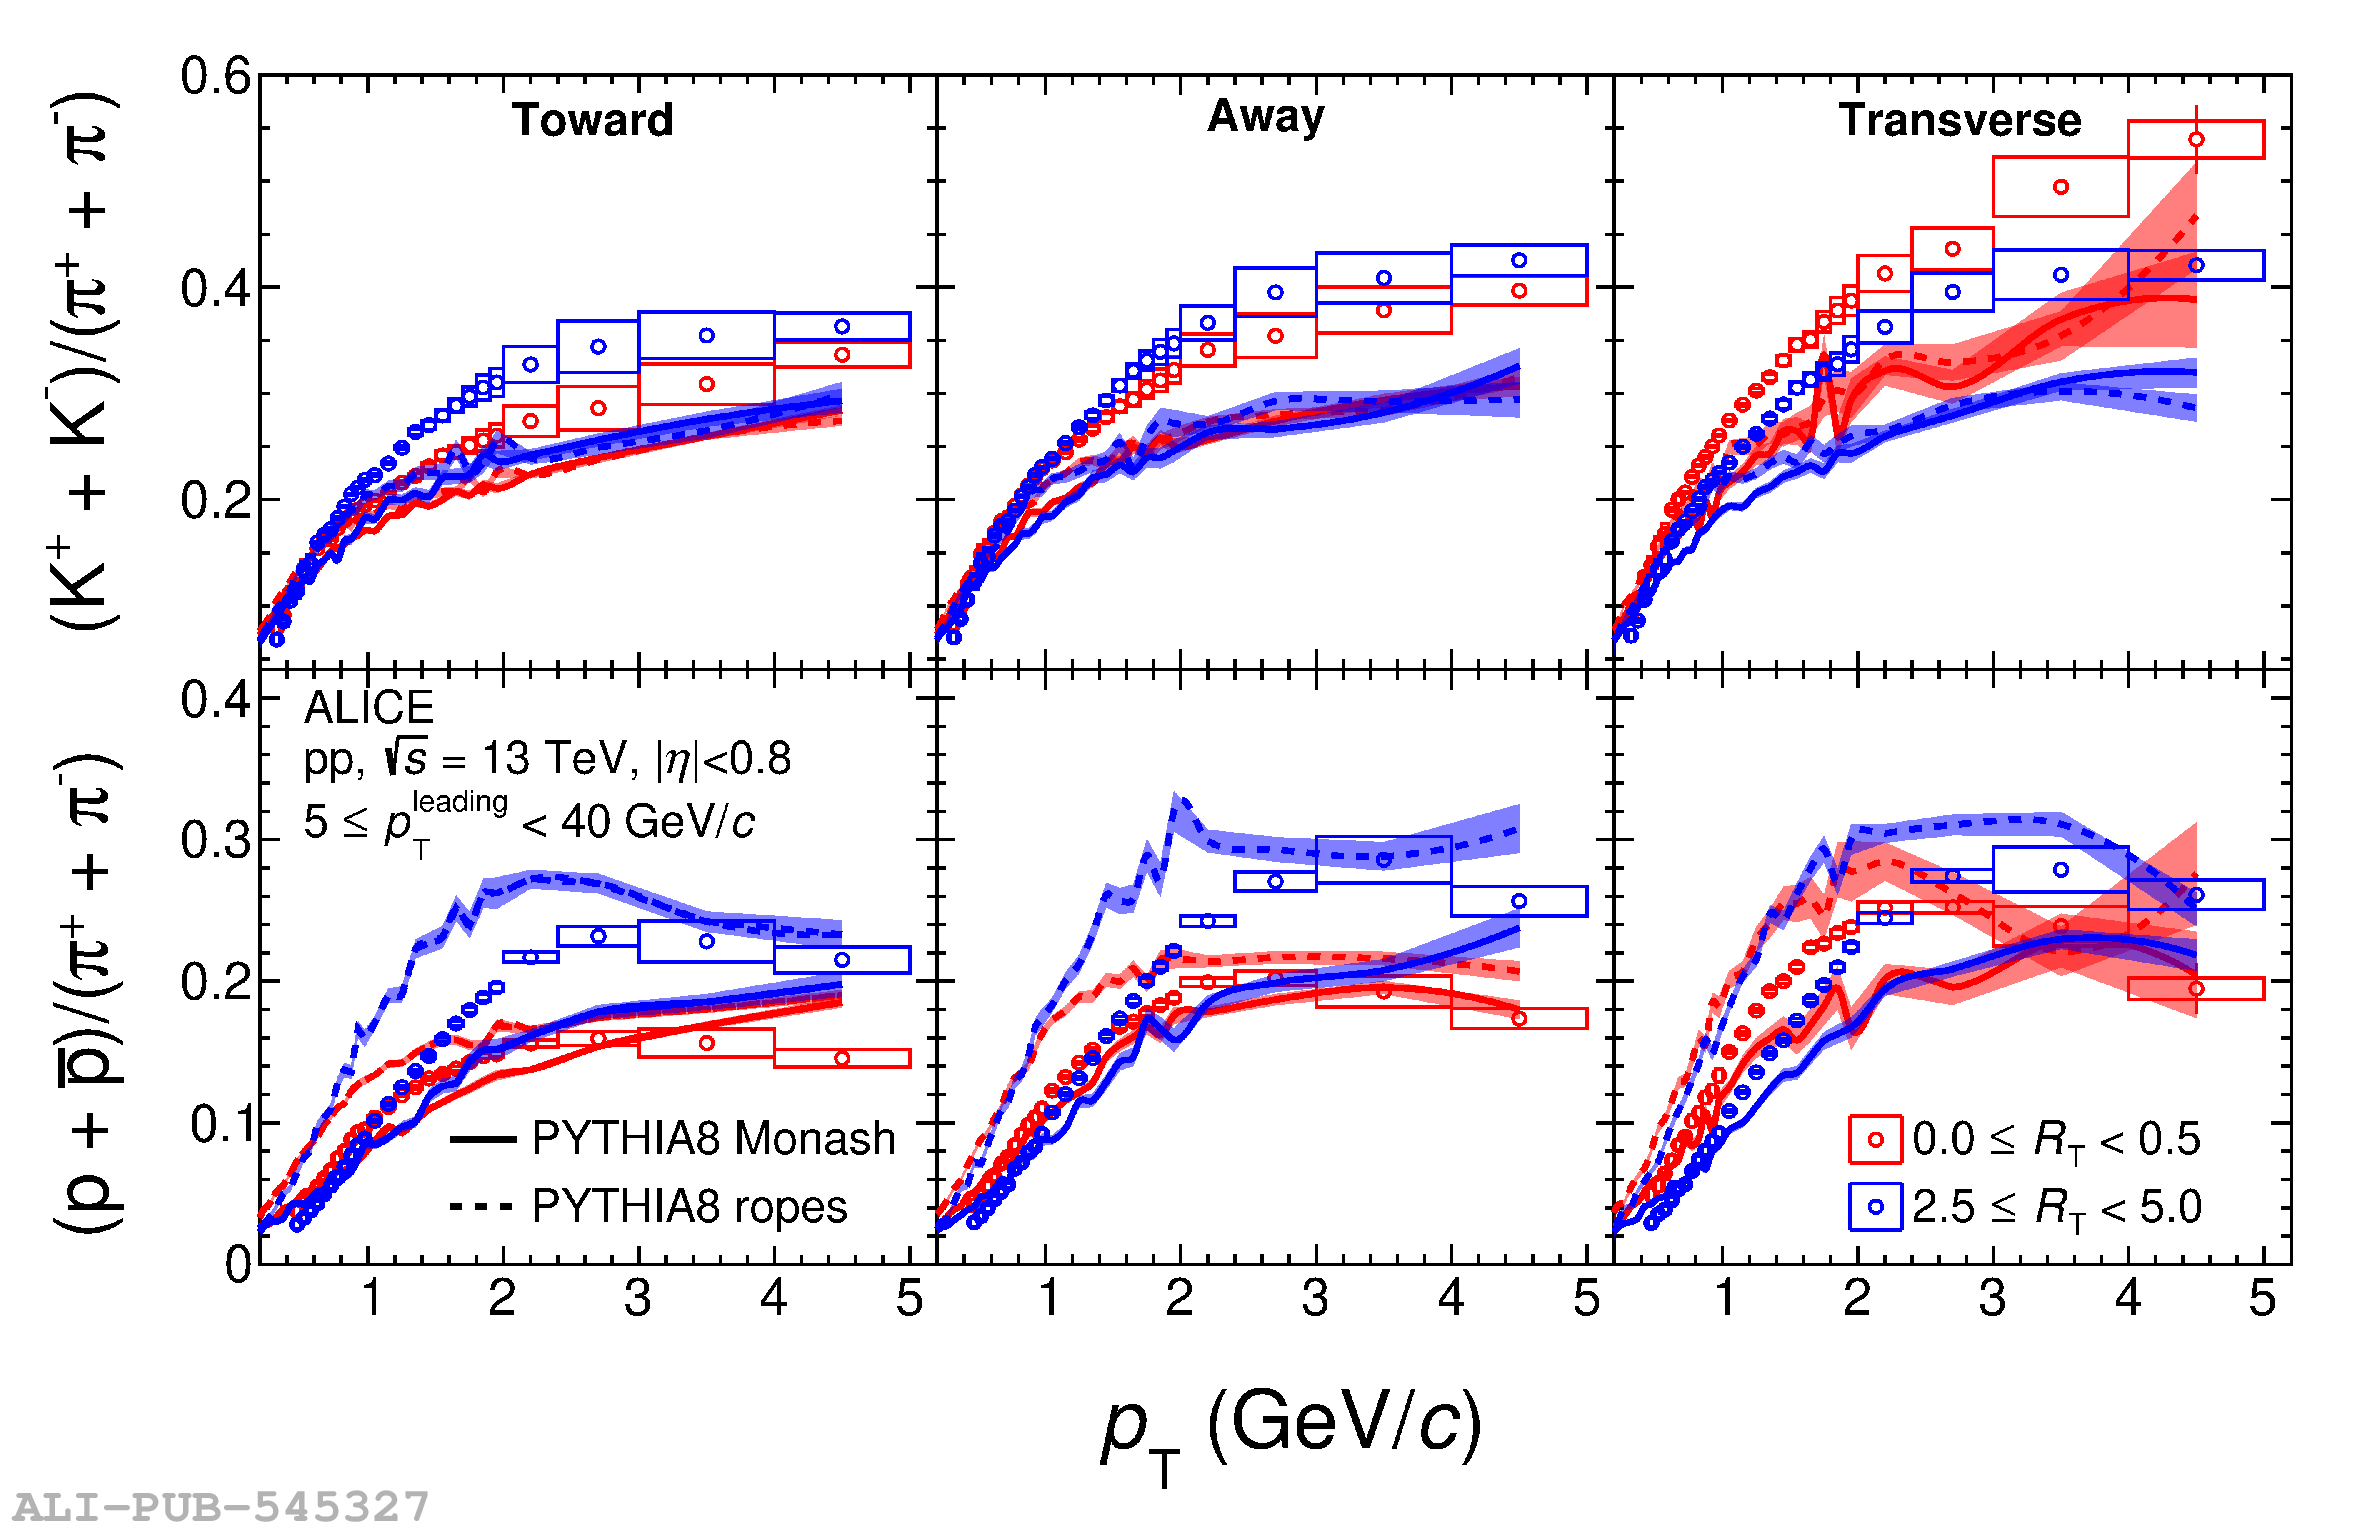 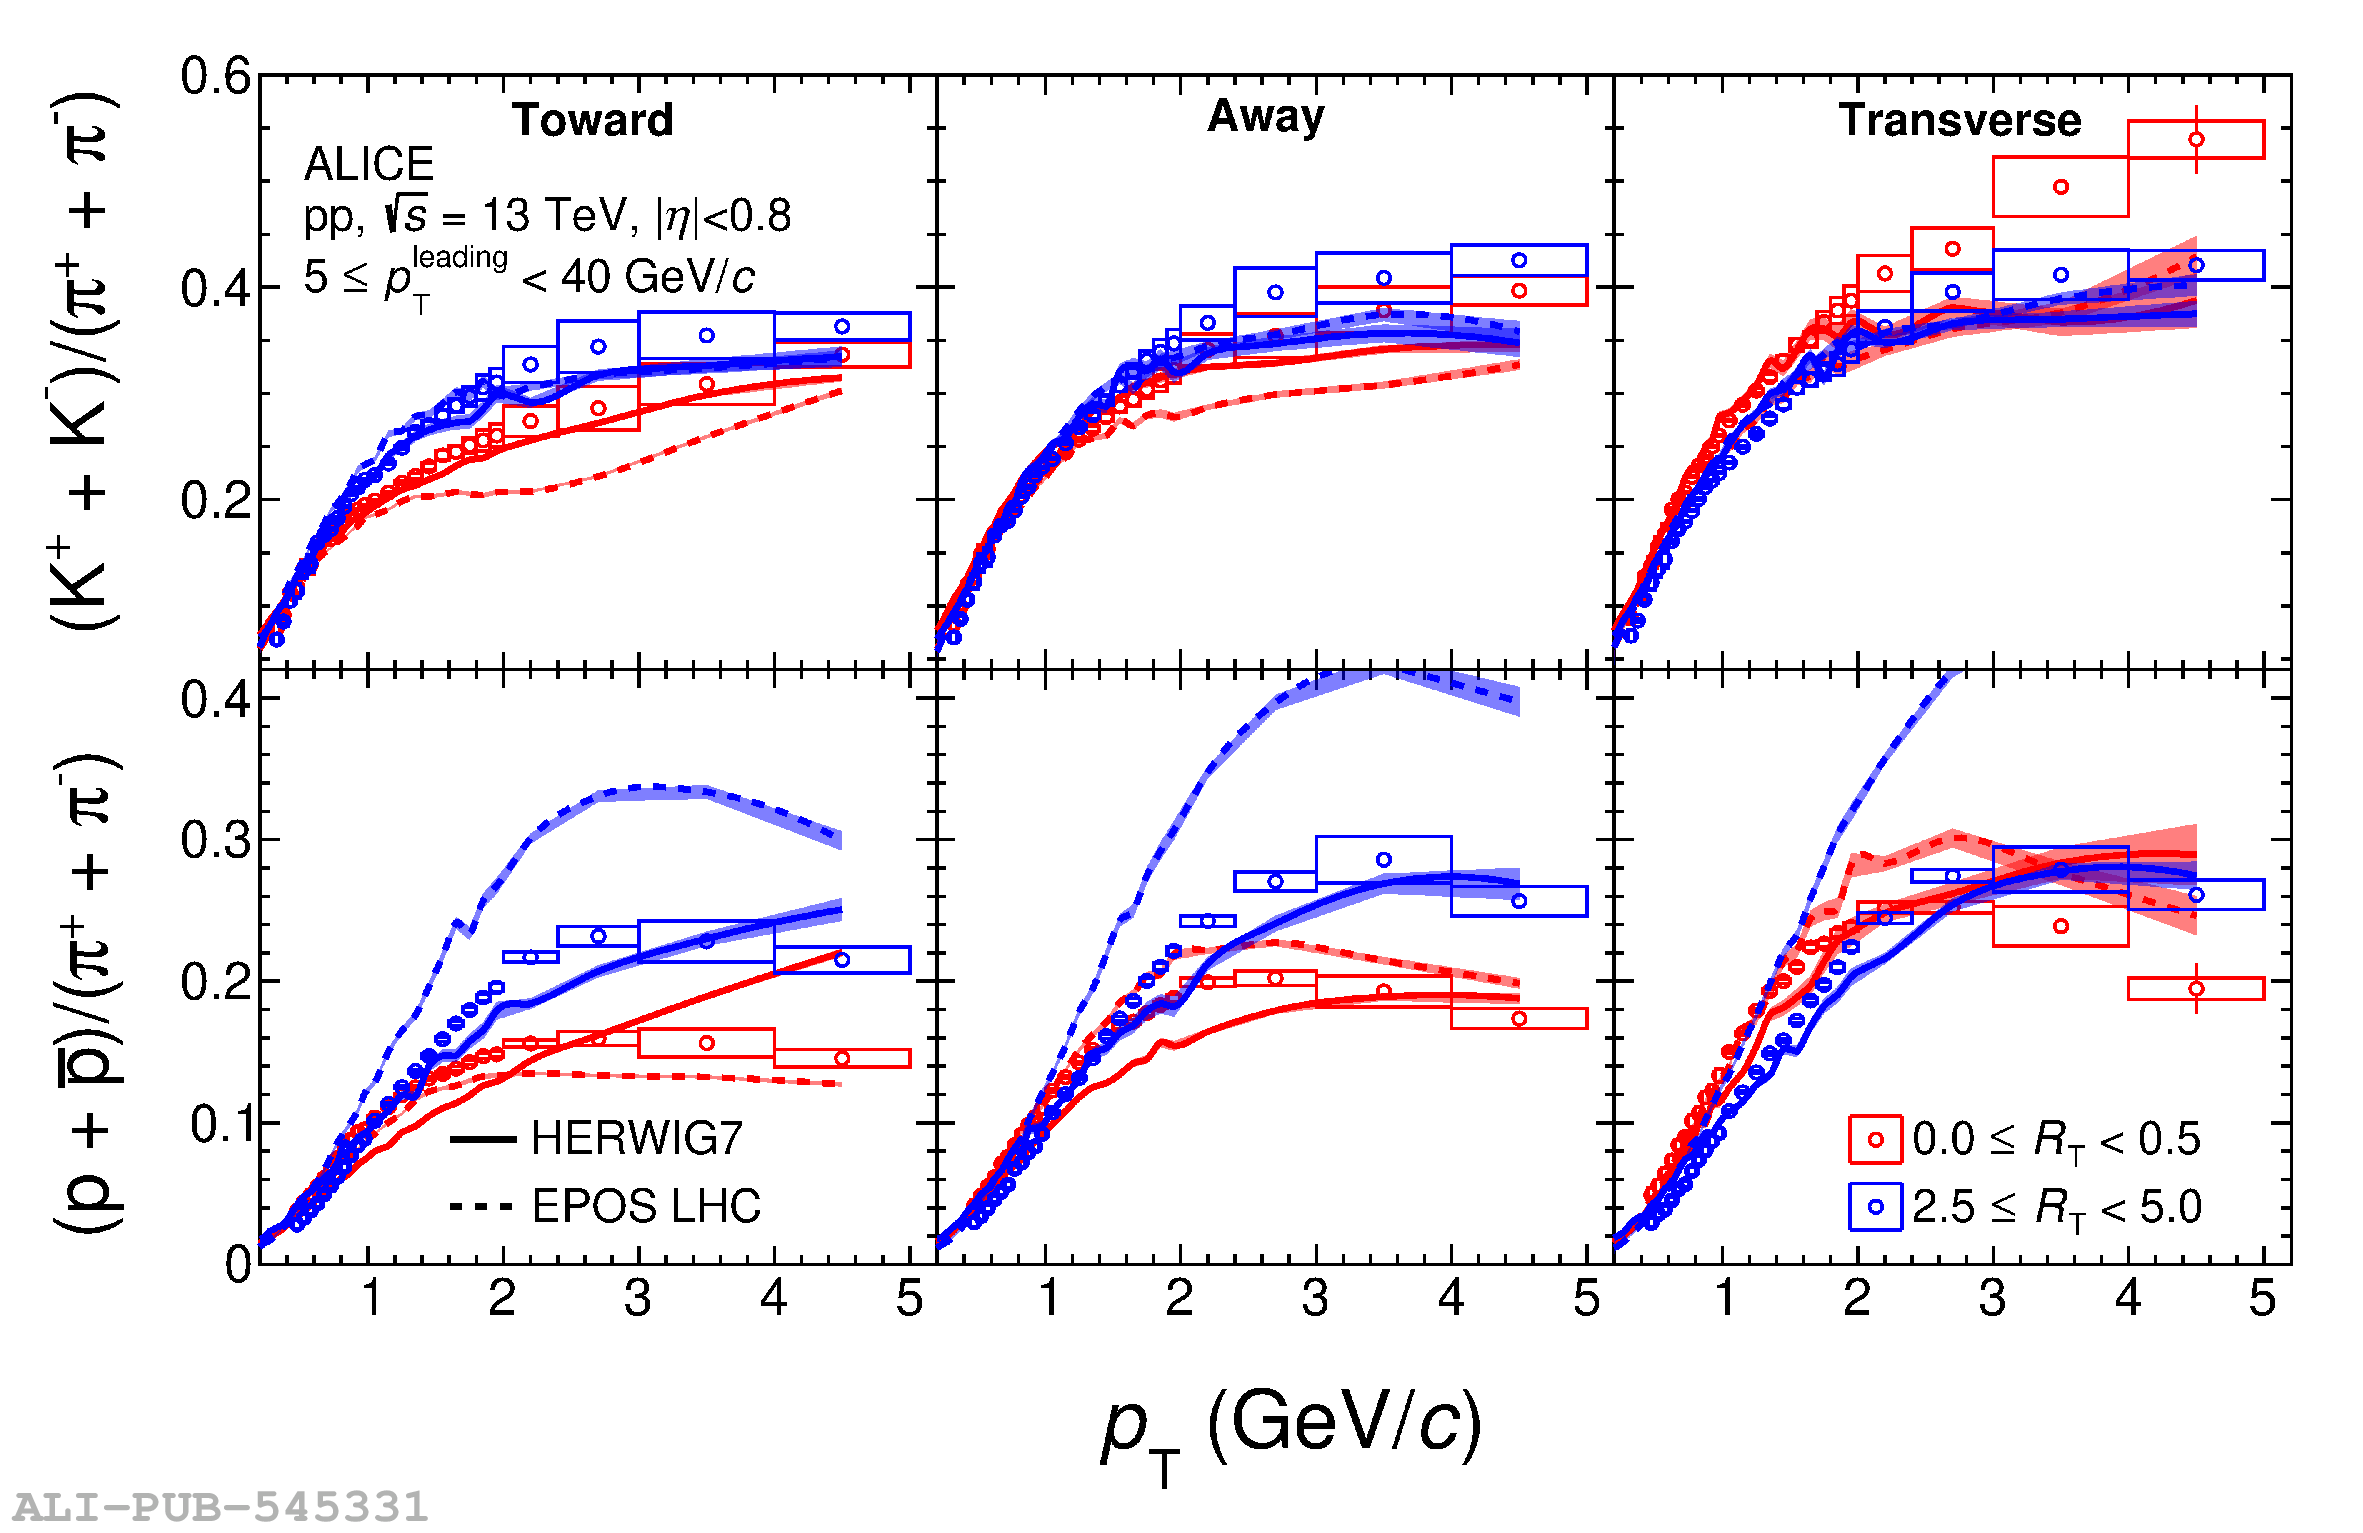 |