Measurements of charged-particle production in pp, p$-$Pb, and Pb$-$Pb collisions in the toward, away, and transverse regions with the ALICE detector are discussed. These regions are defined event-by-event relative to the azimuthal direction of the charged trigger particle, which is the reconstructed particle with the largest transverse momentum ($p_{\mathrm{T}}^{\rm trig}$) in the range $8<~p_{\mathrm{T}}^{\rm trig}<~15$ GeV$/c$. The toward and away regions contain the primary and recoil jets, respectively; both regions are accompanied by the underlying event (UE). In contrast, the transverse region perpendicular to the direction of the trigger particle is dominated by the so-called UE dynamics, and includes also contributions from initial- and final-state radiation. The relative transverse activity classifier, $R_{\mathrm{T}}=N_{\mathrm{ch}}^{\mathrm{T}}/\langle N_{\mathrm{ch}}^{\mathrm{T}}\rangle$, is used to group events according to their UE activity, where $N_{\mathrm{ch}}^{\mathrm{T}}$ is the charged-particle multiplicity per event in the transverse region and $\langle N_{\mathrm{ch}}^{\mathrm{T}}\rangle$ is the mean value over the whole analysed sample. The energy dependence of the $R_{\mathrm{T}}$ distributions in pp collisions at $\sqrt{s}=2.76$, 5.02, 7, and 13 TeV is reported, exploring the Koba-Nielsen-Olesen (KNO) scaling properties of the multiplicity distributions. The first measurements of charged-particle $p_{\rm T}$ spectra as a function of $R_{\mathrm{T}}$ in the three azimuthal regions in pp, p$-$Pb, and Pb$-$Pb collisions at $\sqrt{s_{\rm NN}}=5.02$ TeV are also reported. Data are compared with predictions obtained from the event generators PYTHIA 8 and EPOS LHC. This set of measurements is expected to contribute to the understanding of the origin of collective-like effects in small collision systems (pp and p$-$Pb).
JHEP 01 (2024) 056
HEP Data
e-Print: arXiv:2310.07490 | PDF | inSPIRE
CERN-EP-2023-212
Figure group
Figure 1
Schematic representation of the toward, transverse, and away regions in the azimuthal plane with respect to the leading particle, i.e.,the particle with the highest $p_{\rm T}$ in the event. Figure taken from Ref. . | 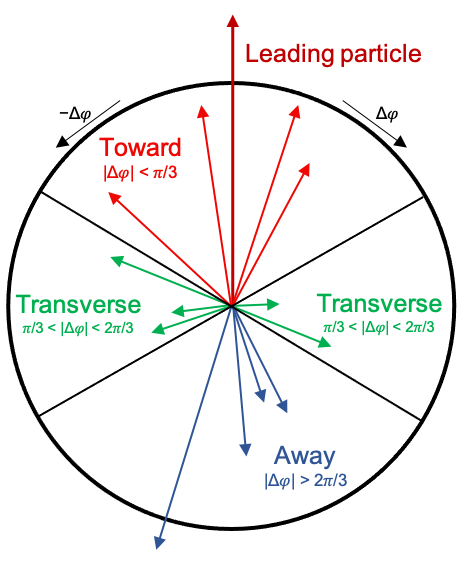 |
Figure 3
Top: $R_{\rm T}$ distributions in pp collisions for different centre-of-mass energies $\sqrt{s} = 2.76$, 5.02, 7, and 13 TeV. Bottom: $R_{\rm T}$ distributions normalised to that for pp collisions at $\sqrt{s} = 7$ TeV. The ratio is calculated using a linear interpolation between adjacent points. The boxes and bars represent the systematic and statistical uncertainties, respectively. The pp sample at $\sqrt{s} = 13$ TeV is smaller than that used for pp collisions at $\sqrt{s} = 7$TeV. | 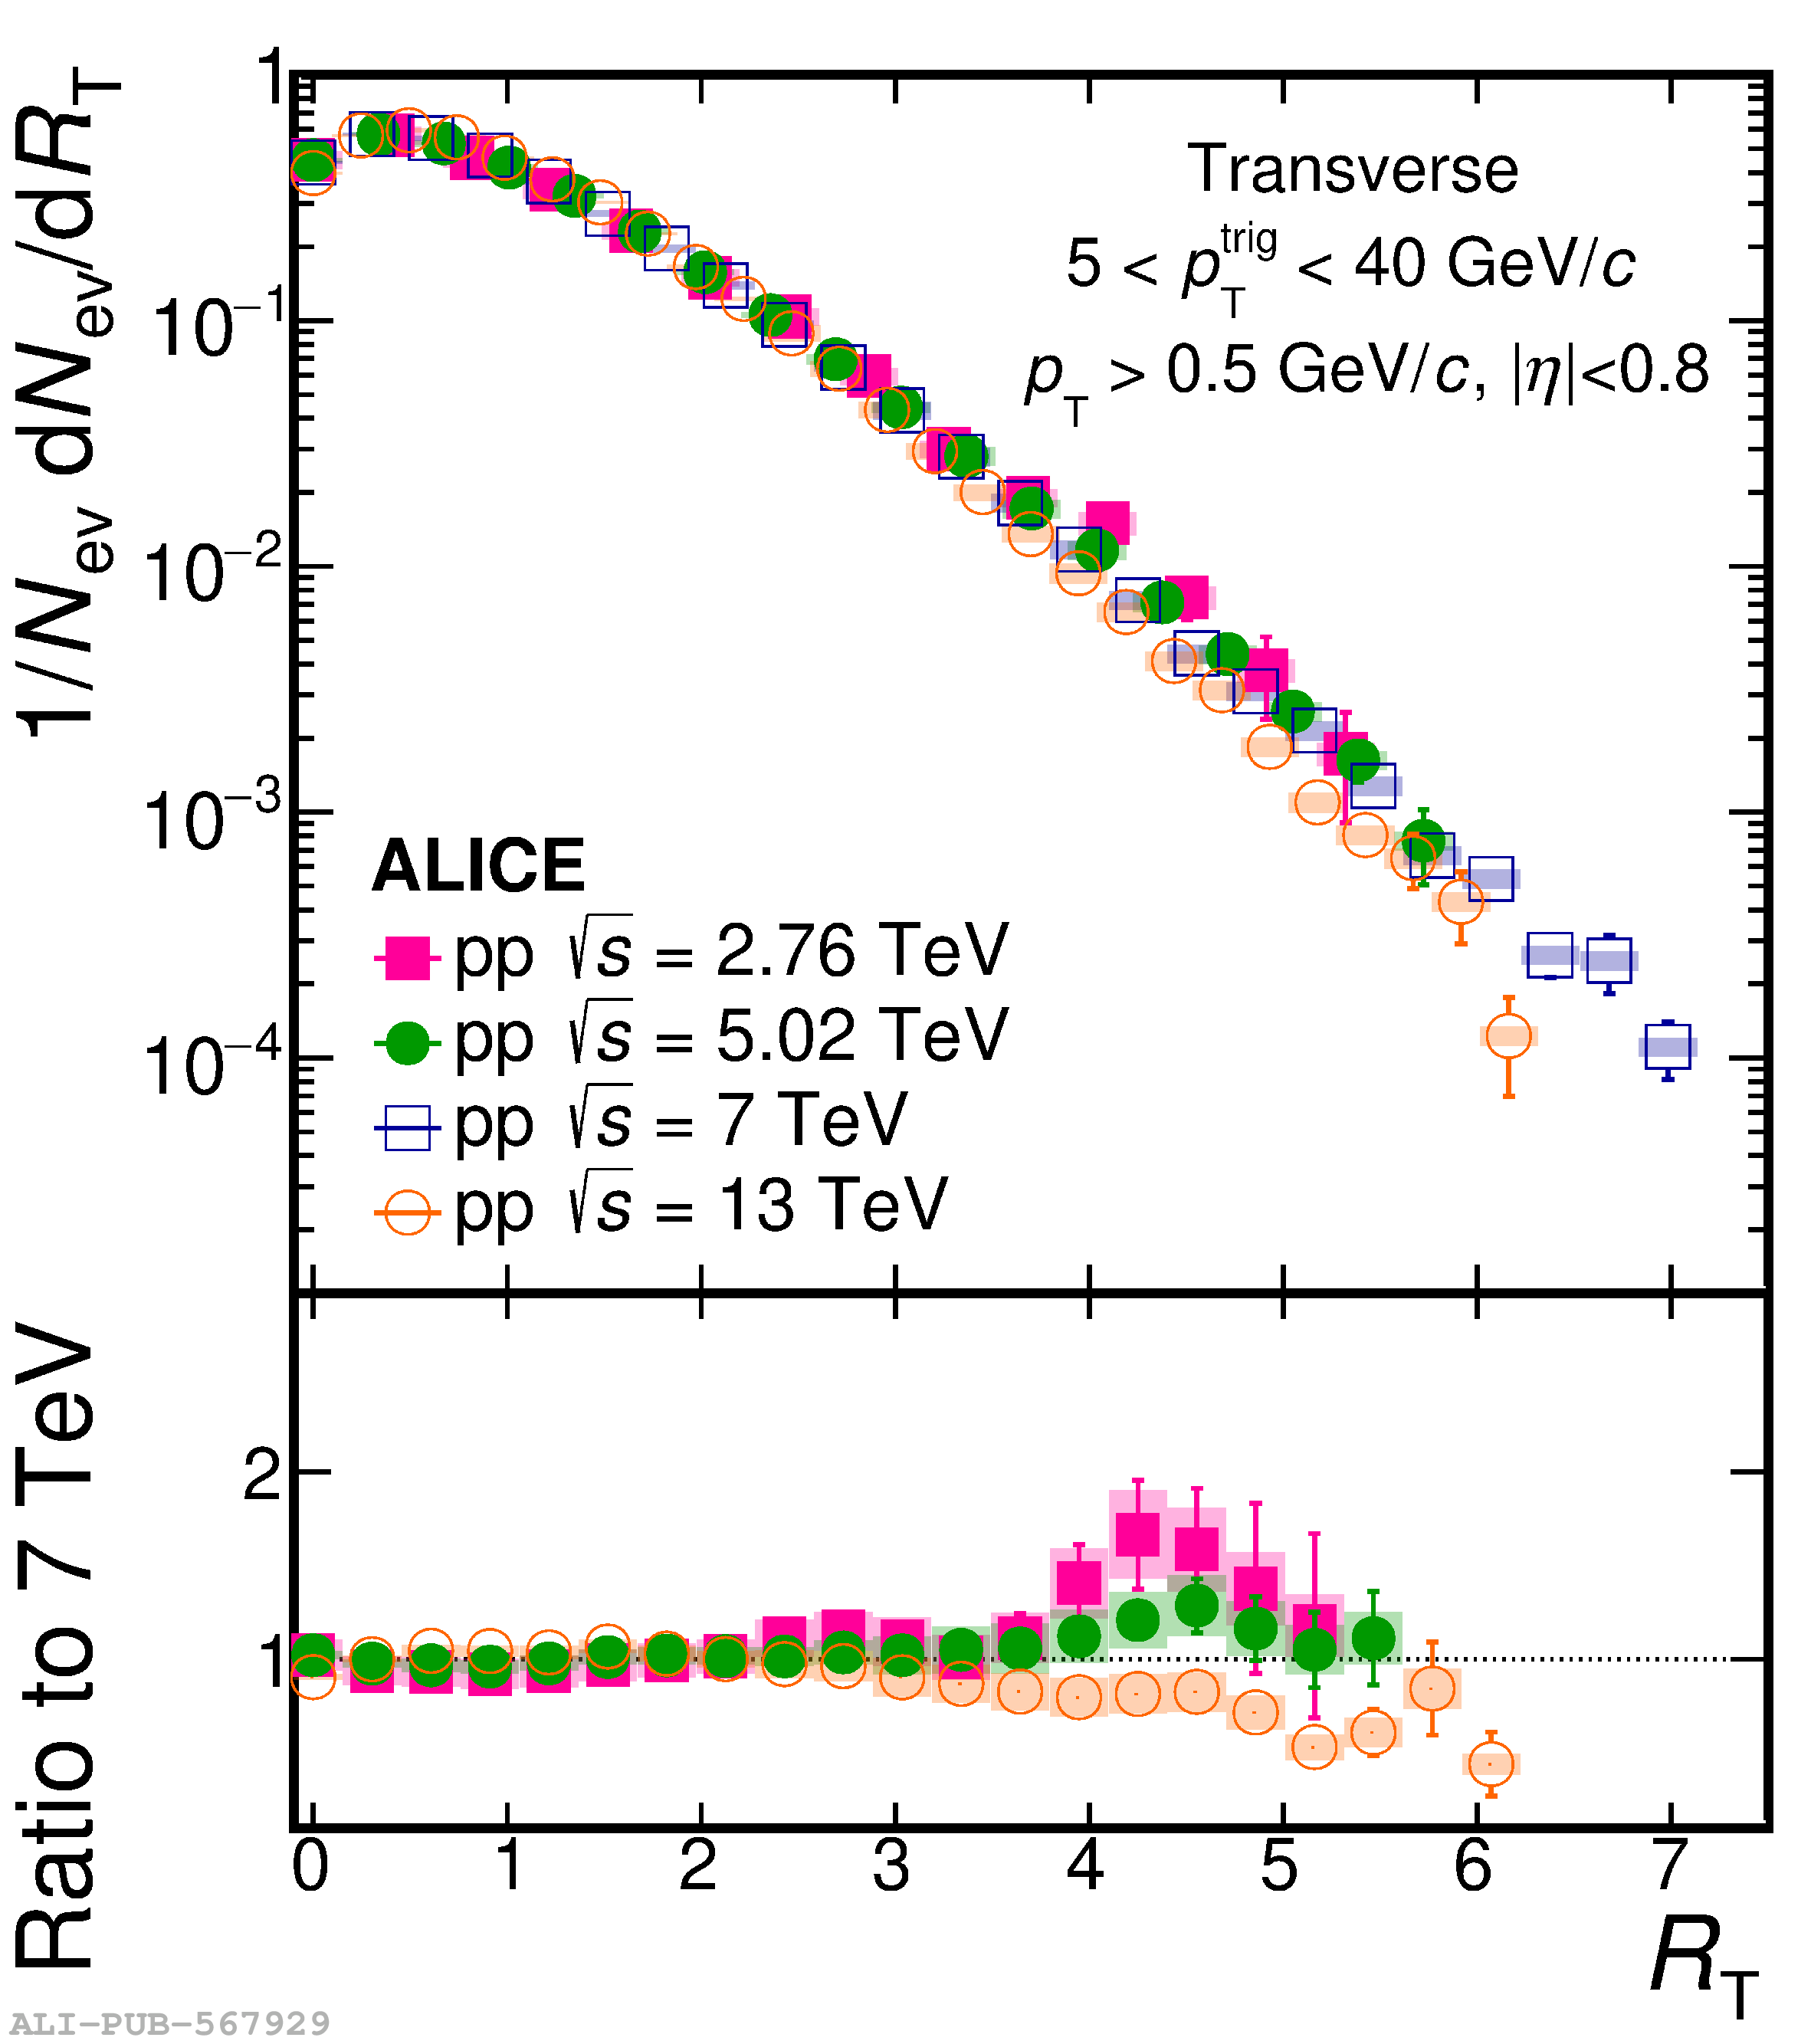 |
Figure 4
Top panel: charged-particle transverse momentum spectra as a function of $R_{\rm T}$ for different topological regions in pp collisions at $\sqrt{s} = 5.02$ TeV. Data are compared with predictions. Middle panel: the ratio of the $p_{\rm T}$ spectra in different $R_{\rm T}$ intervals to the $R_{\rm T}$-integrated ones. The boxes and bars represent the systematic and statistical uncertainties, respectively. Bottom panel: the ratio of the $p_{\rm T}$ spectra for each $R_{\rm T}$ interval to the corresponding PYTHIA8 and EPOS-LHC predictions. The shaded area represents the sum in quadrature of the systematic and statistical uncertainties. | 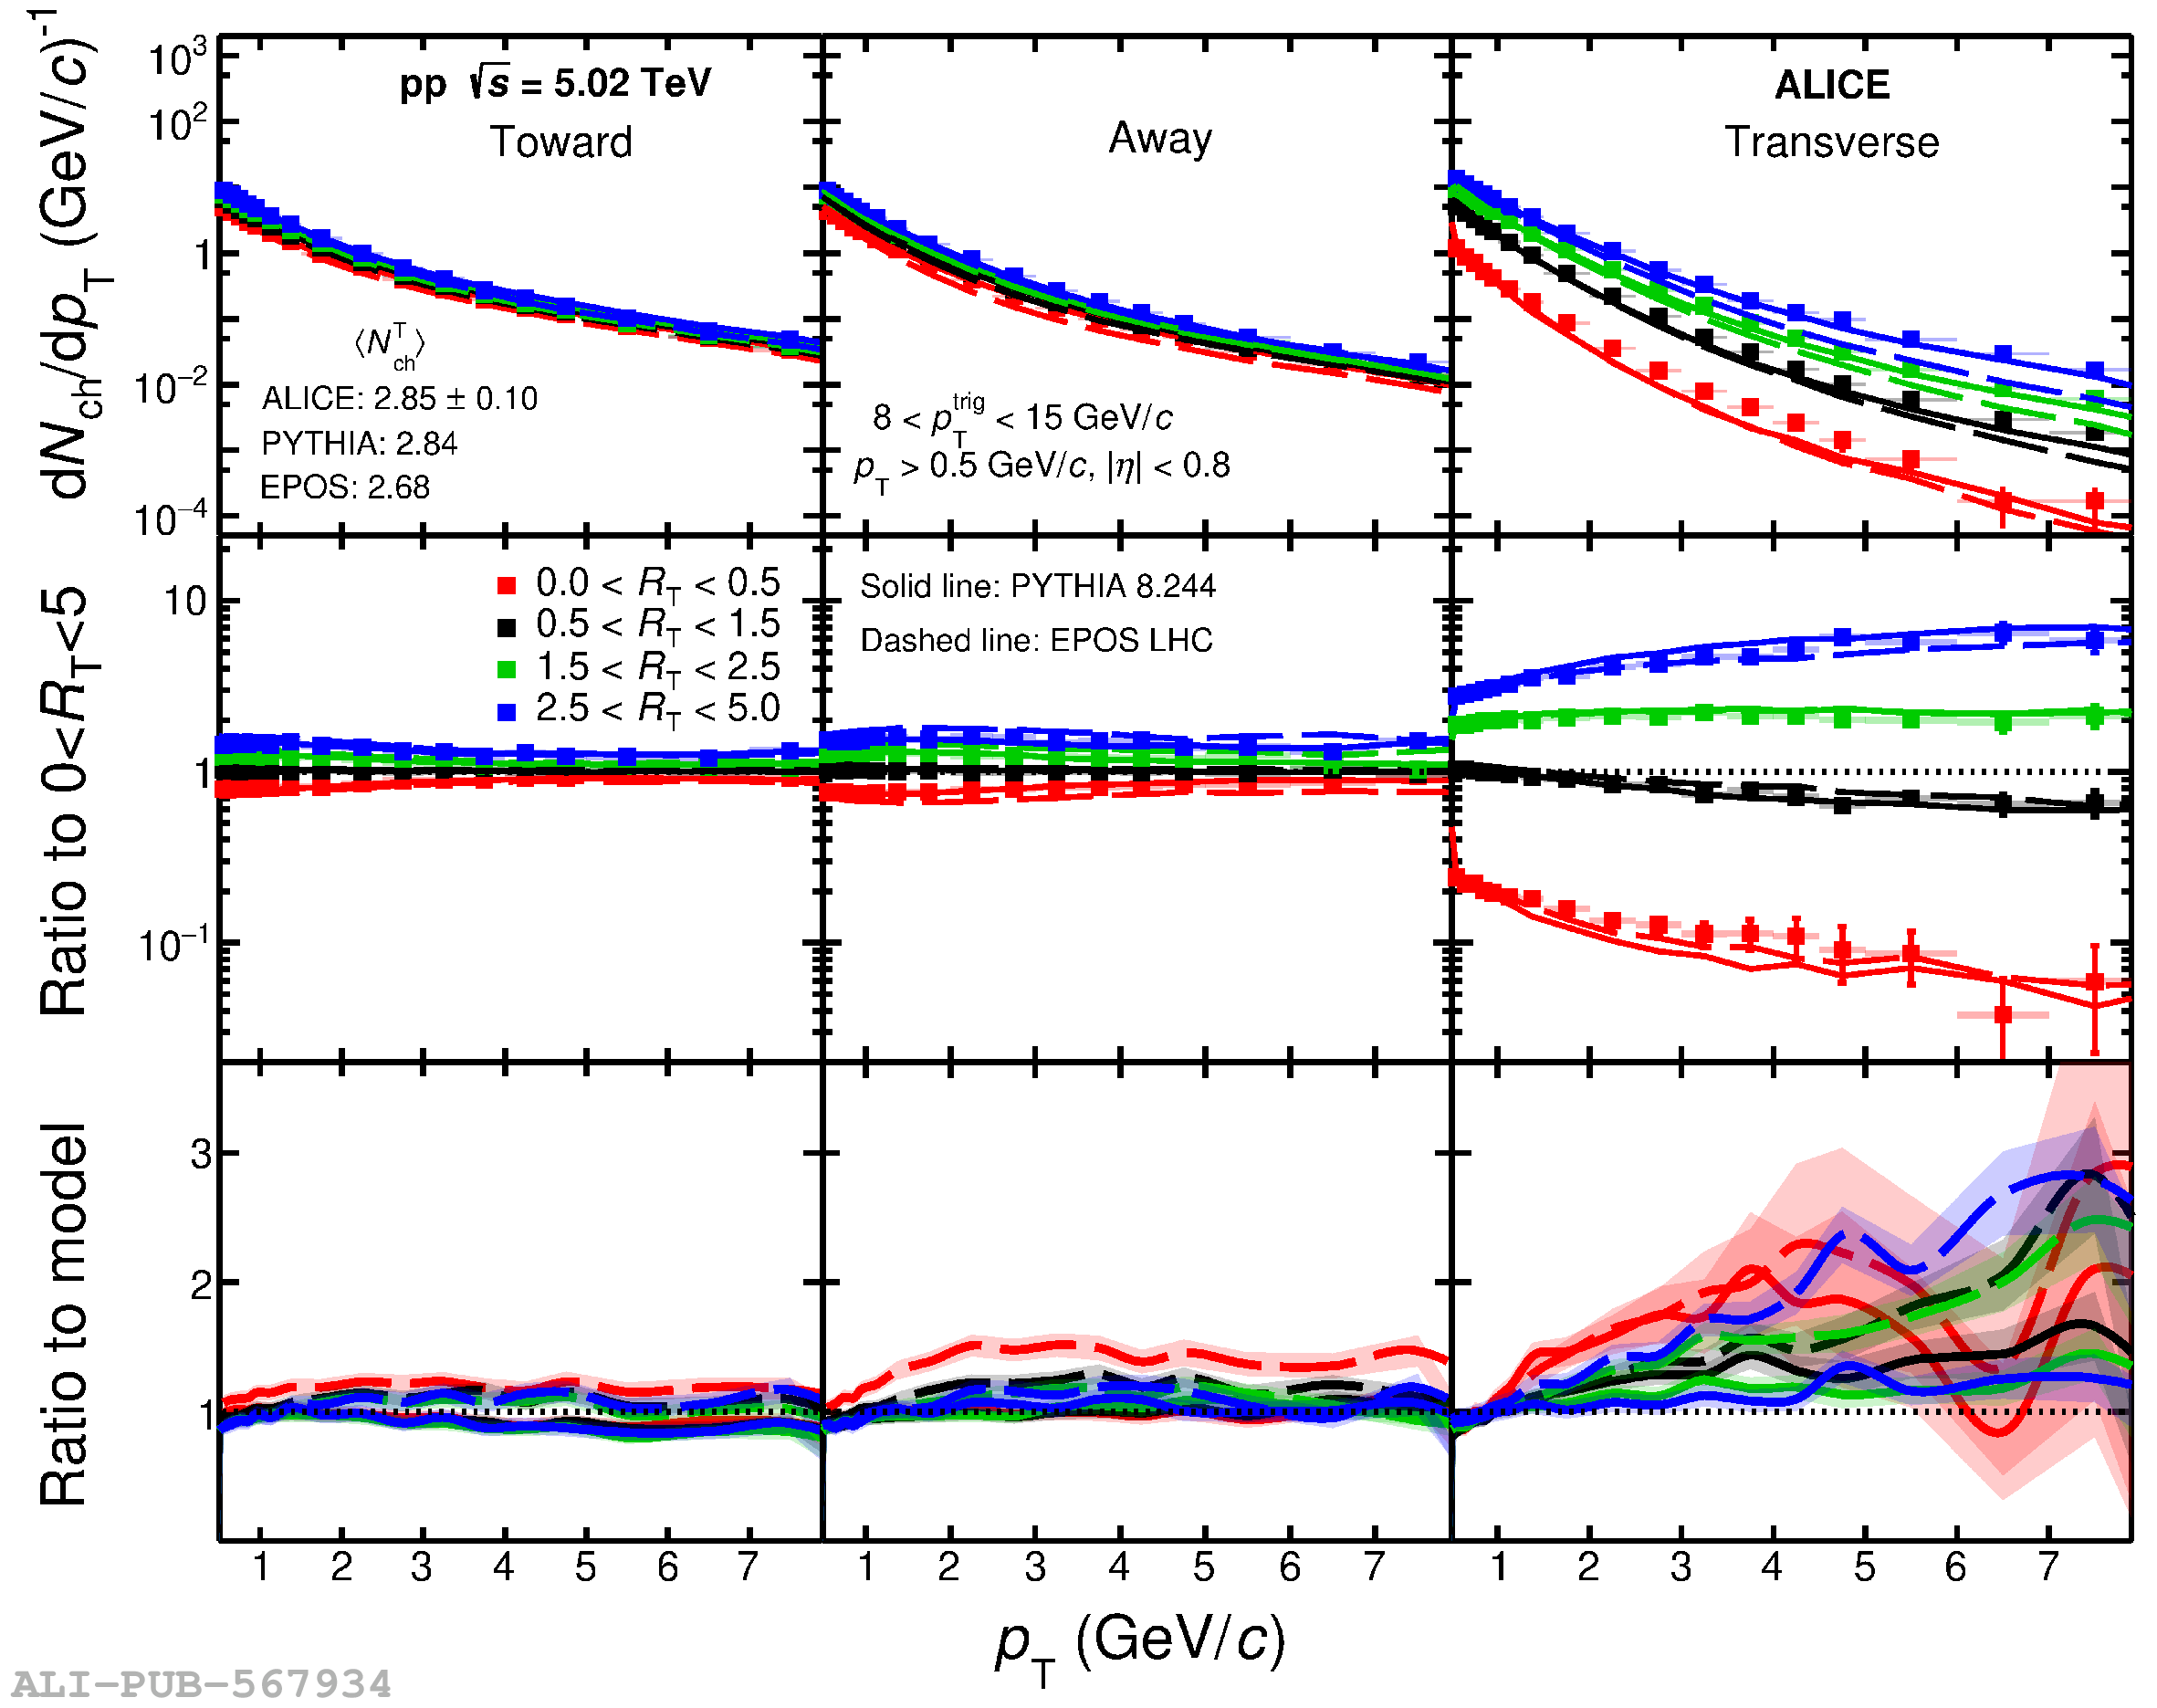 |
Figure 5
Top panel: charged-particle transverse momentum spectra as a function of $R_{\rm T}$ for different topological regions in p-Pb collisions at $\sqrt{s_{\rm NN}} = 5.02$ TeV. Data are compared with predictions. Middle panel: the ratio of the \pt spectra in different $R_{\rm T}$ intervals to the $R_{\rm T}$-integrated ones. The boxes and bars represent the systematic and statistical uncertainties, respectively. Bottom panel: the ratio of the $p_{\rm T}$ spectra for each $R_{\rm T}$ interval to the corresponding PYTHIA8 Angantyr and EPOS-LHC predictions. The shaded area represents the sum in quadrature of the systematic and statistical uncertainties. | 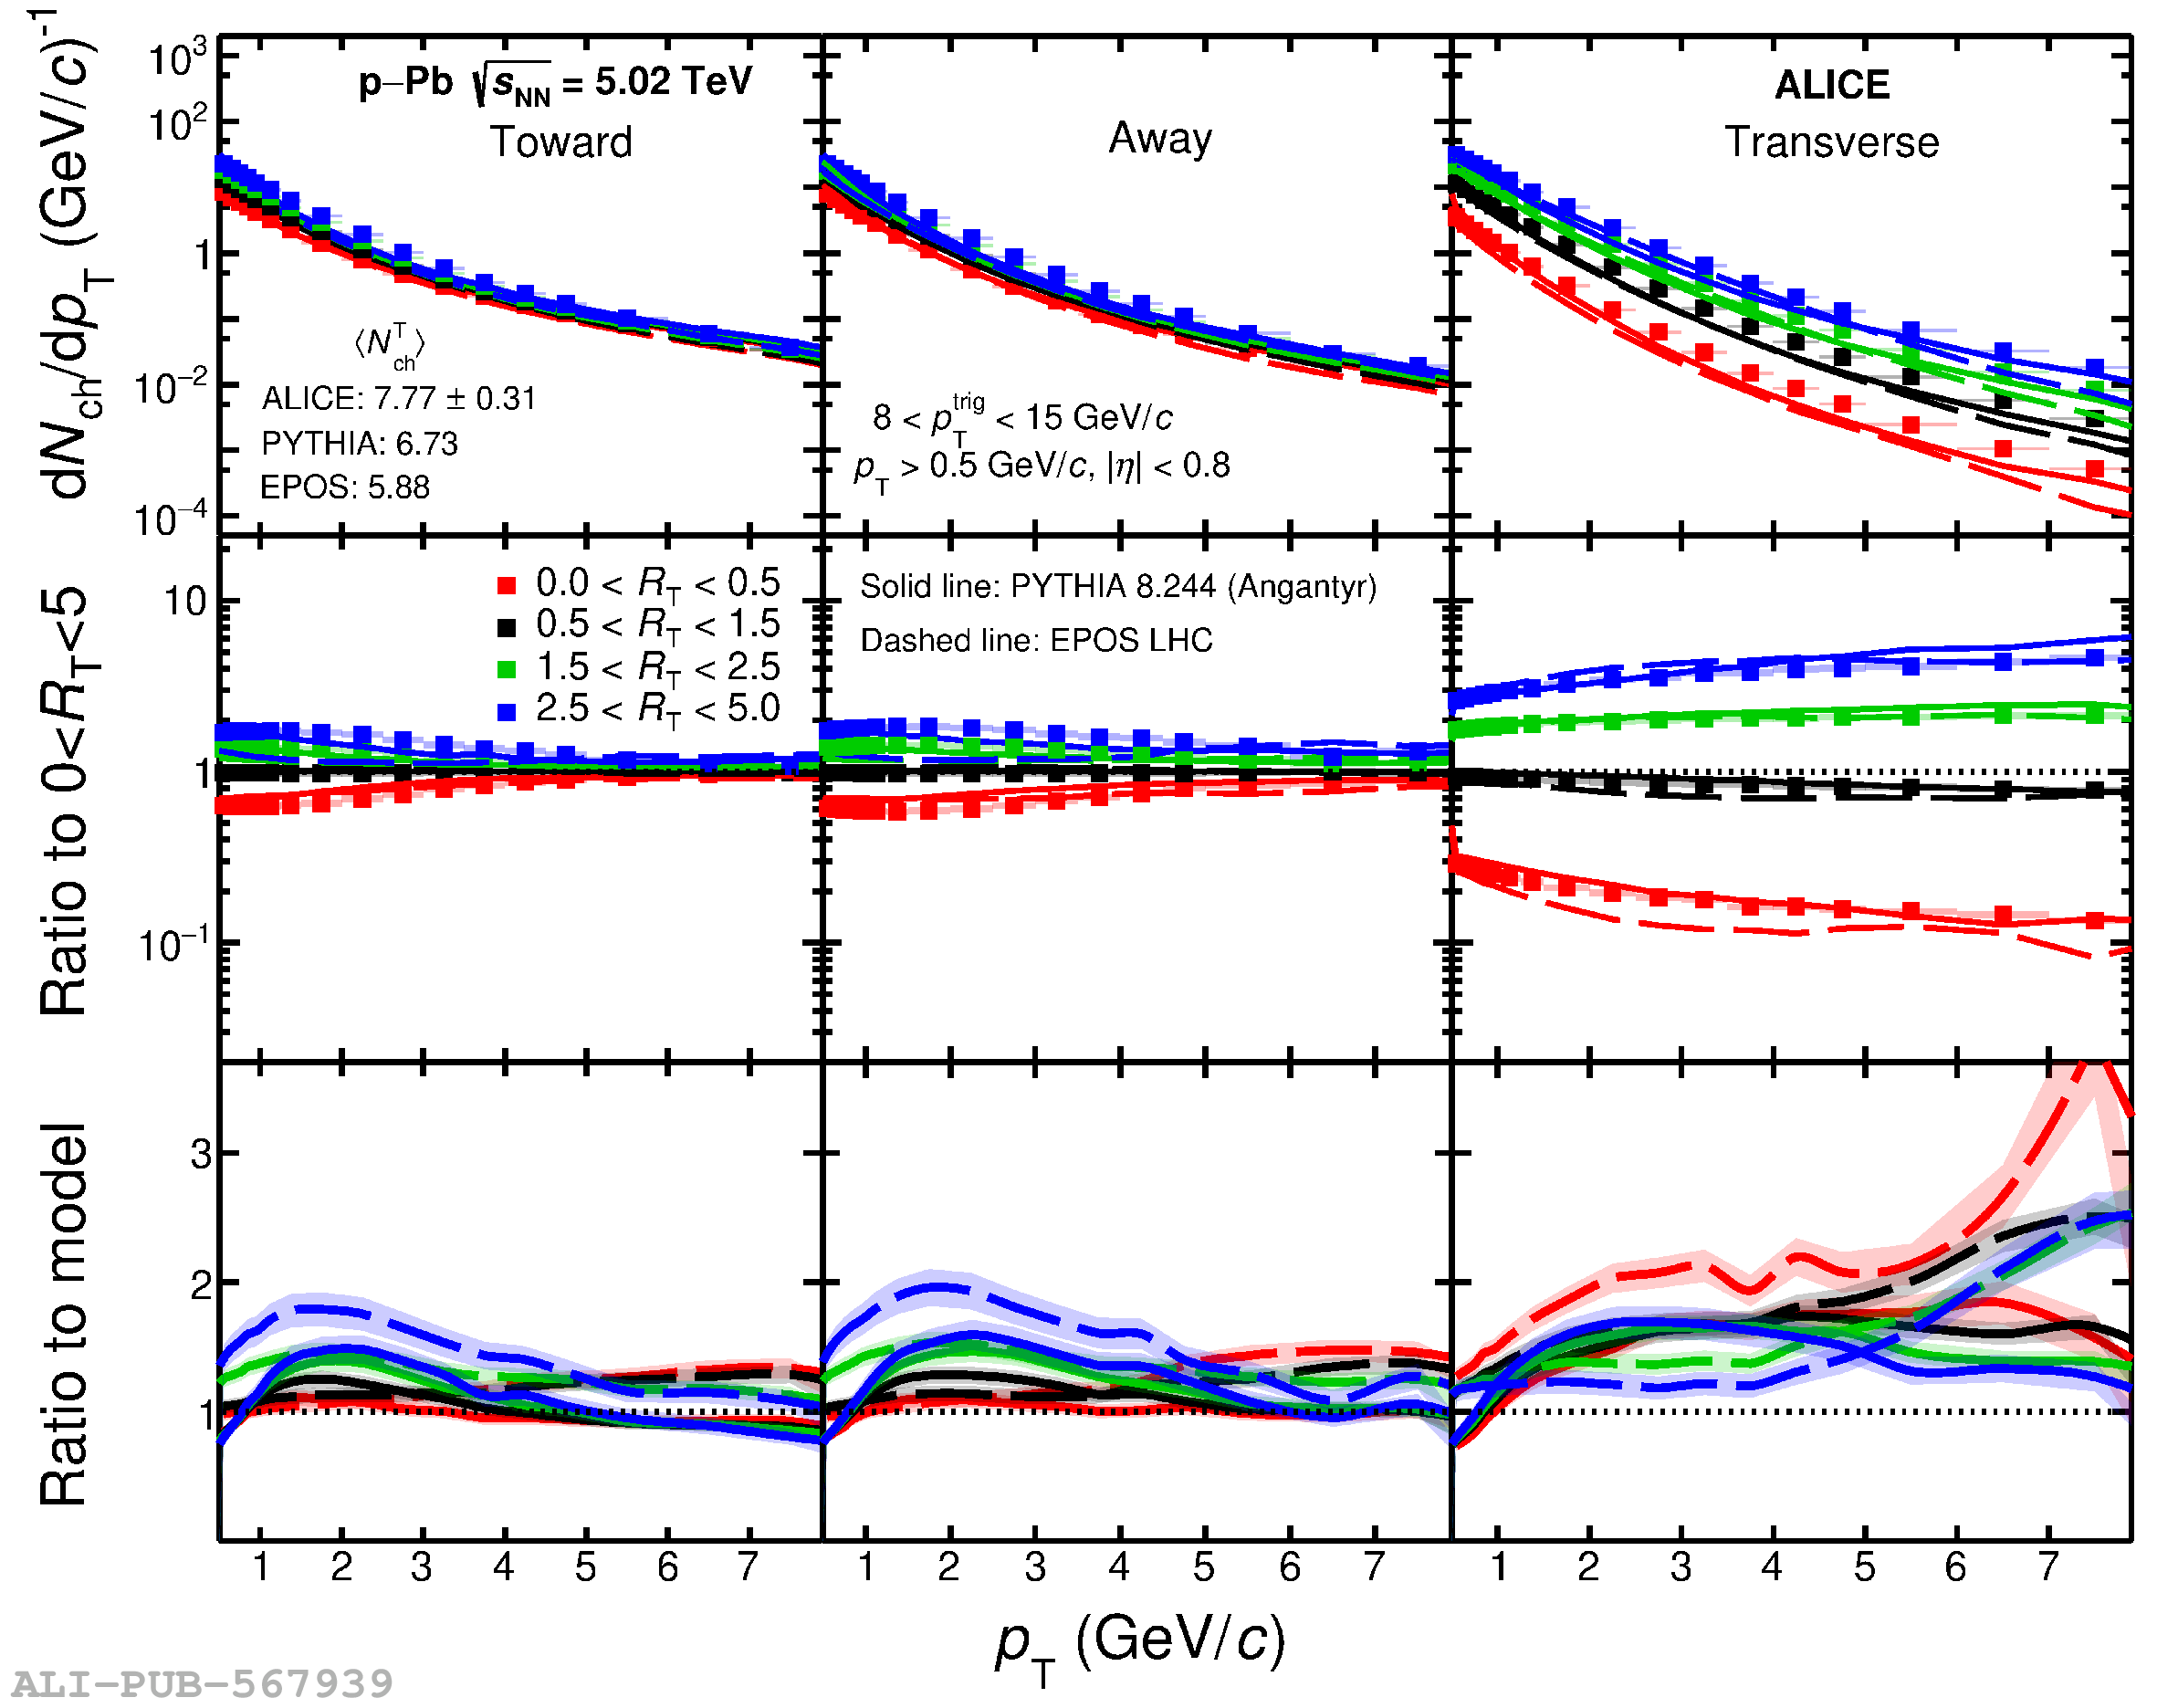 |
Figure 6
Top panel: charged-particle transverse momentum spectra as a function of $R_{\rm T}$ for different topological regions in p-Pb collisions at $\sqrt{s_{\rm NN}} = 5.02$ TeV. Data are compared with PYTHIA Angantyr and EPOS predictions. Middle panel: the ratio of the $p_{\rm T}$ spectra in different $R_{\rm T}$ intervals to the $R_{\rm T}$-integrated ones. The boxes and bars represent the systematic and statistical uncertainties, respectively. Bottom panel: the ratio of the $p_{\rm T}$ spectra for each $R_{\rm T}$ interval to the corresponding PYTHIA8 Angantyr and EPOS-LHC predictions. The shaded area represents the sum in quadrature of the systematic and statistical uncertainties. | 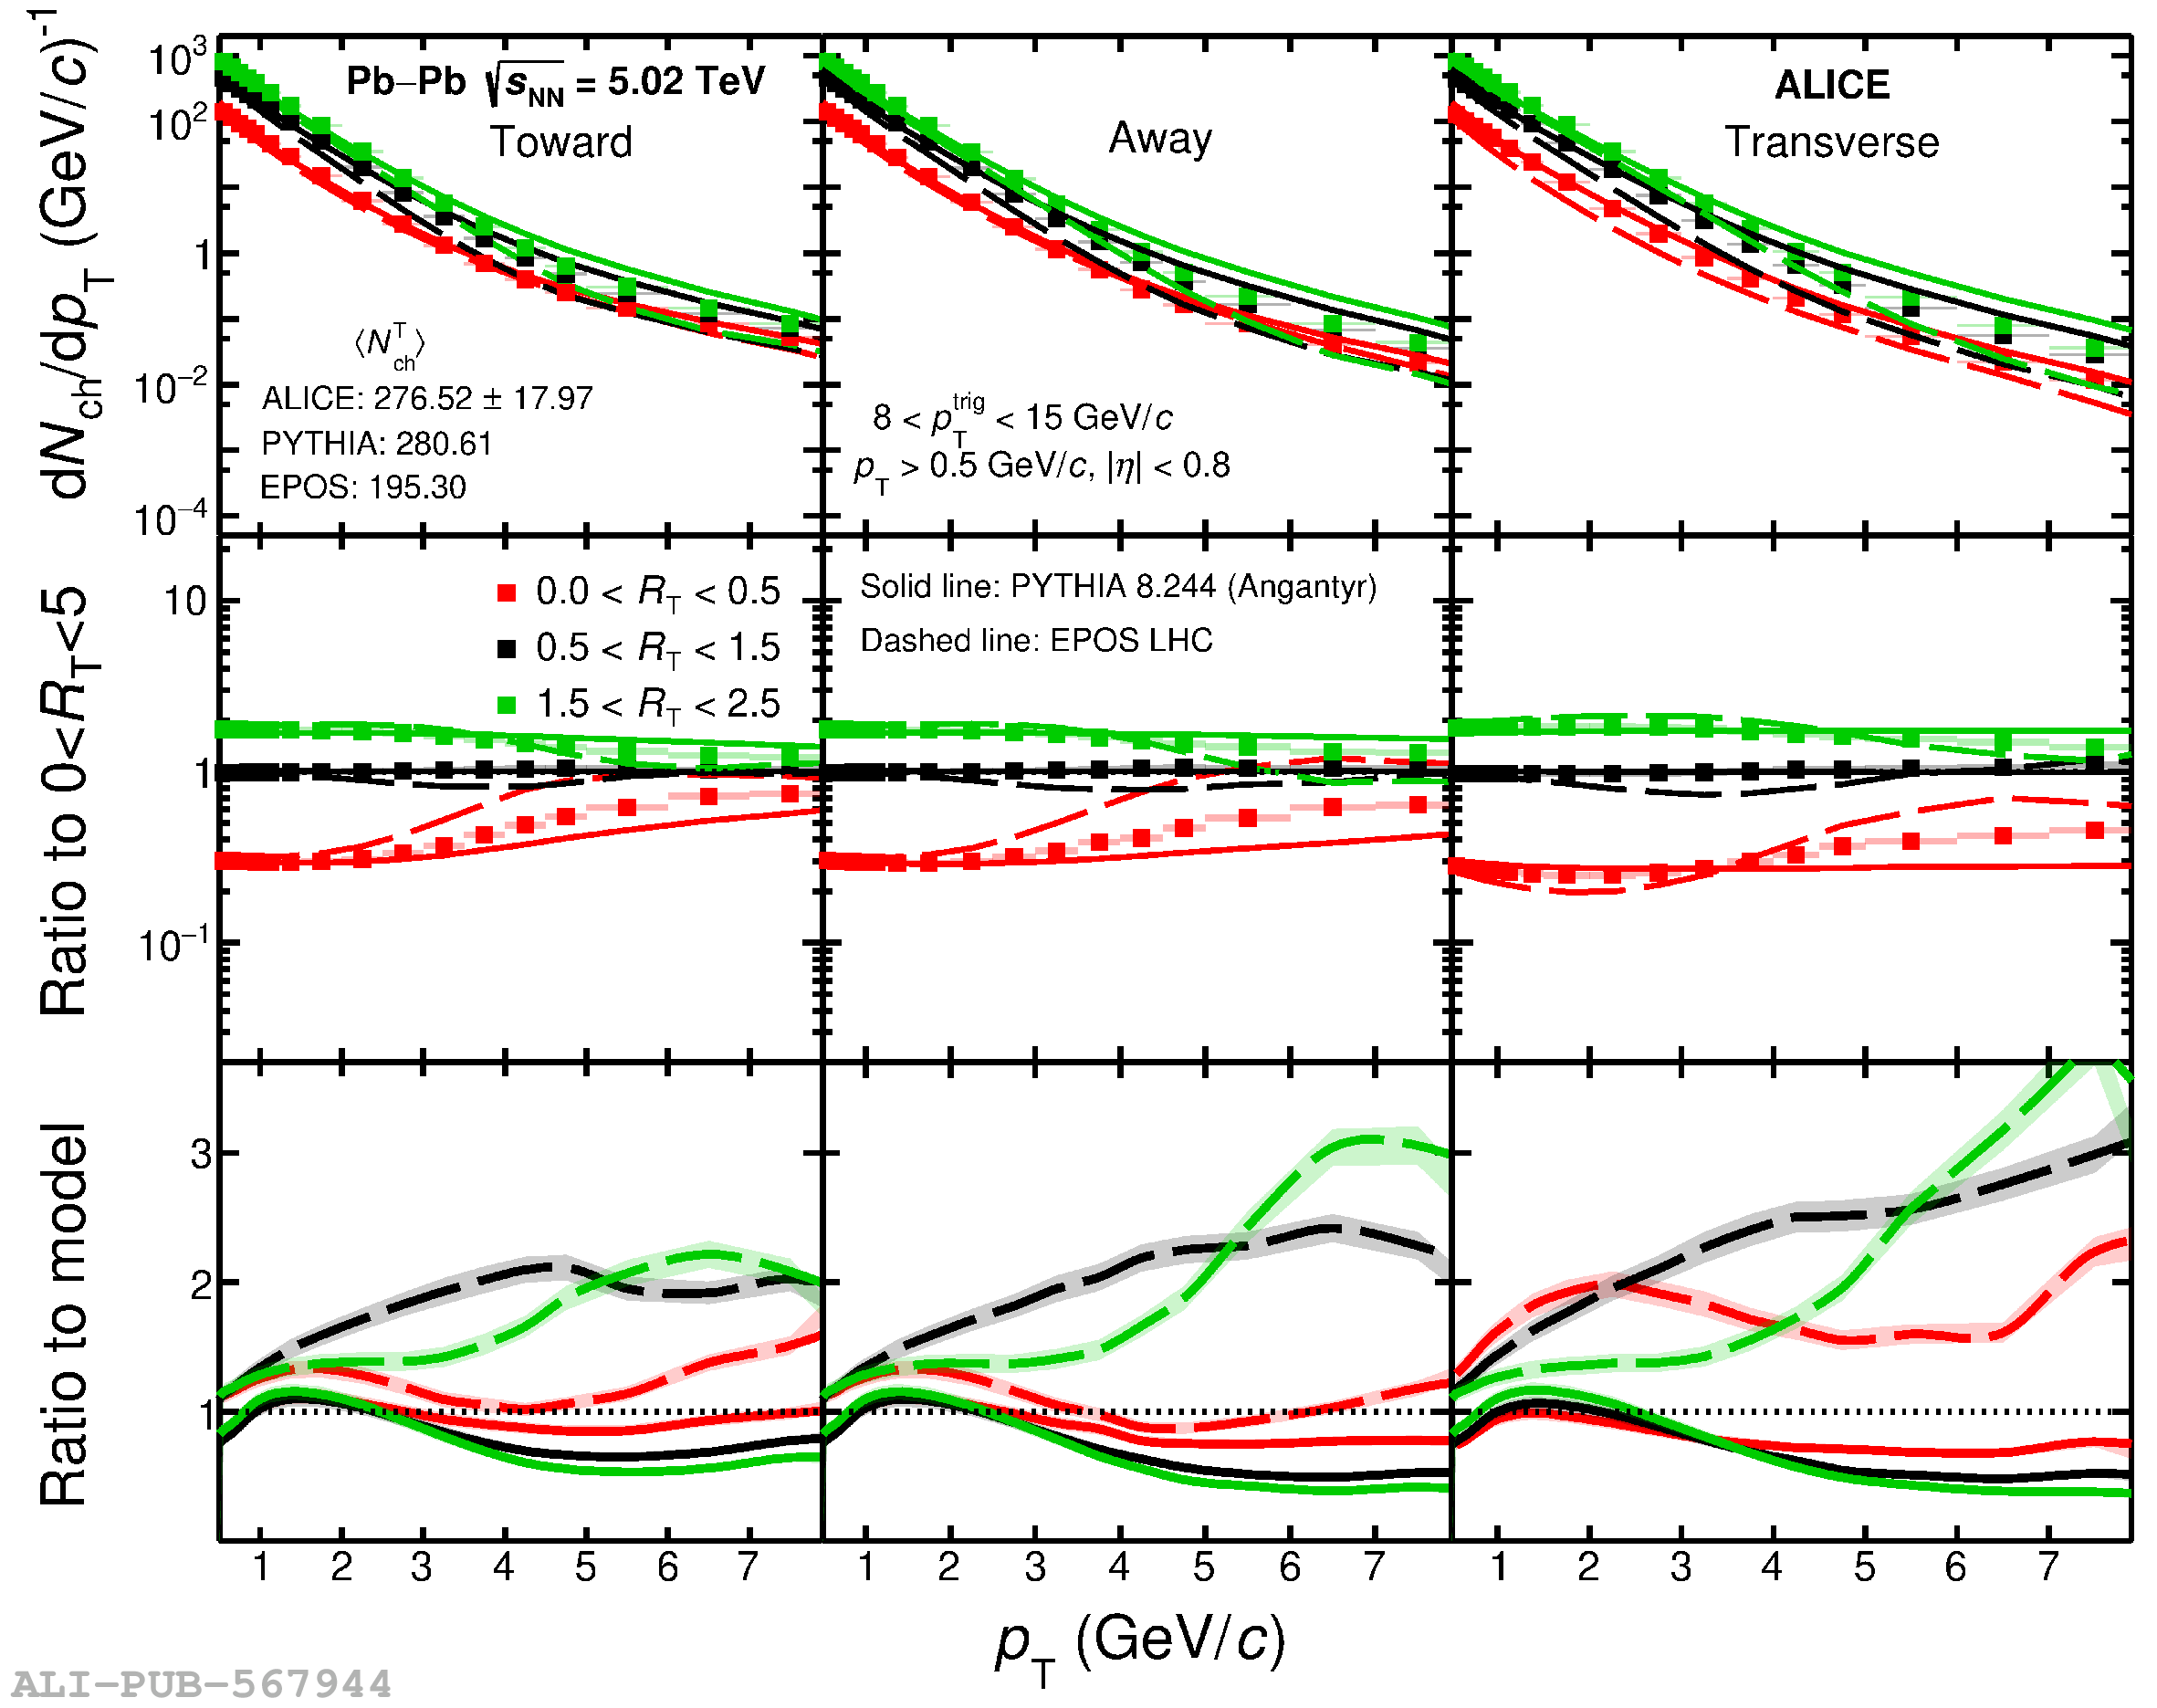 |
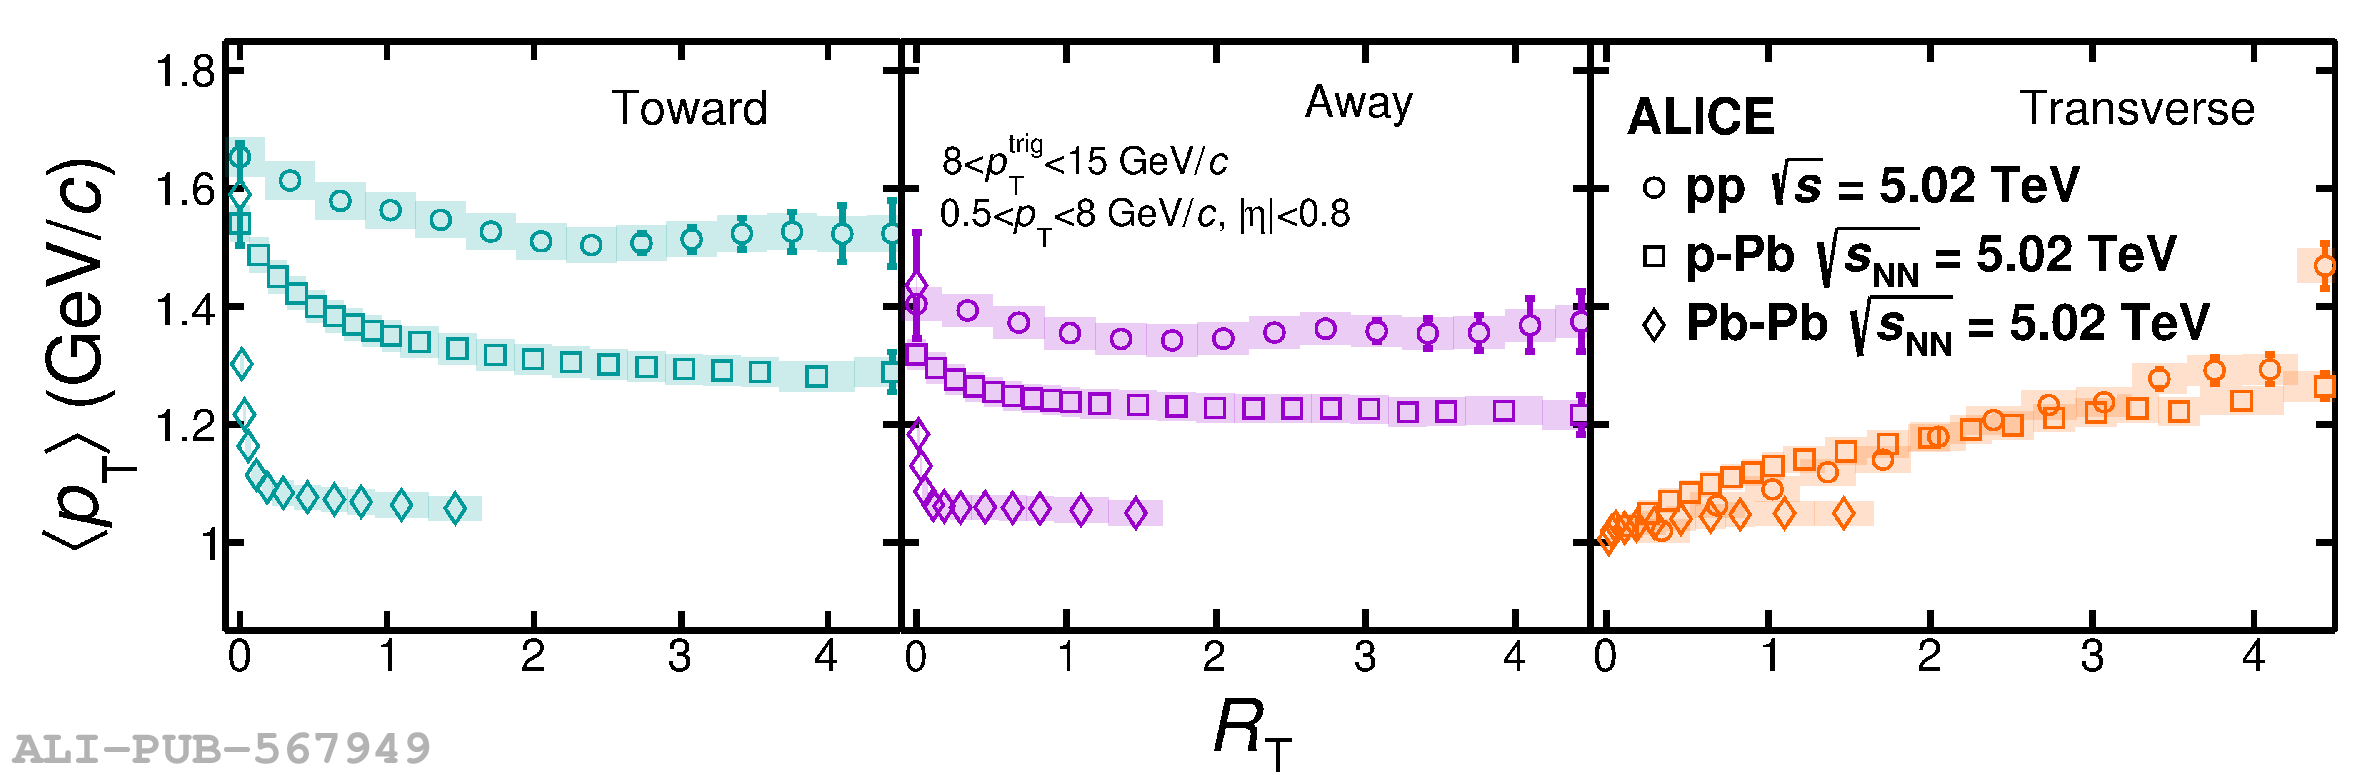
Figure 8
Top: $\langle p_{\rm T} \rangle$ of charged particles in pp (left), p-Pb (middle), and Pb-Pb (right) collisions at $\sqrt{s_{\rm NN}} = 5.02$ TeV as a function of $R_{\rm T}$ for different topological regions compared with predictions. Bottom: ratio of MC to data. The band around unity in the ratio depicts the experimental uncertainties. | 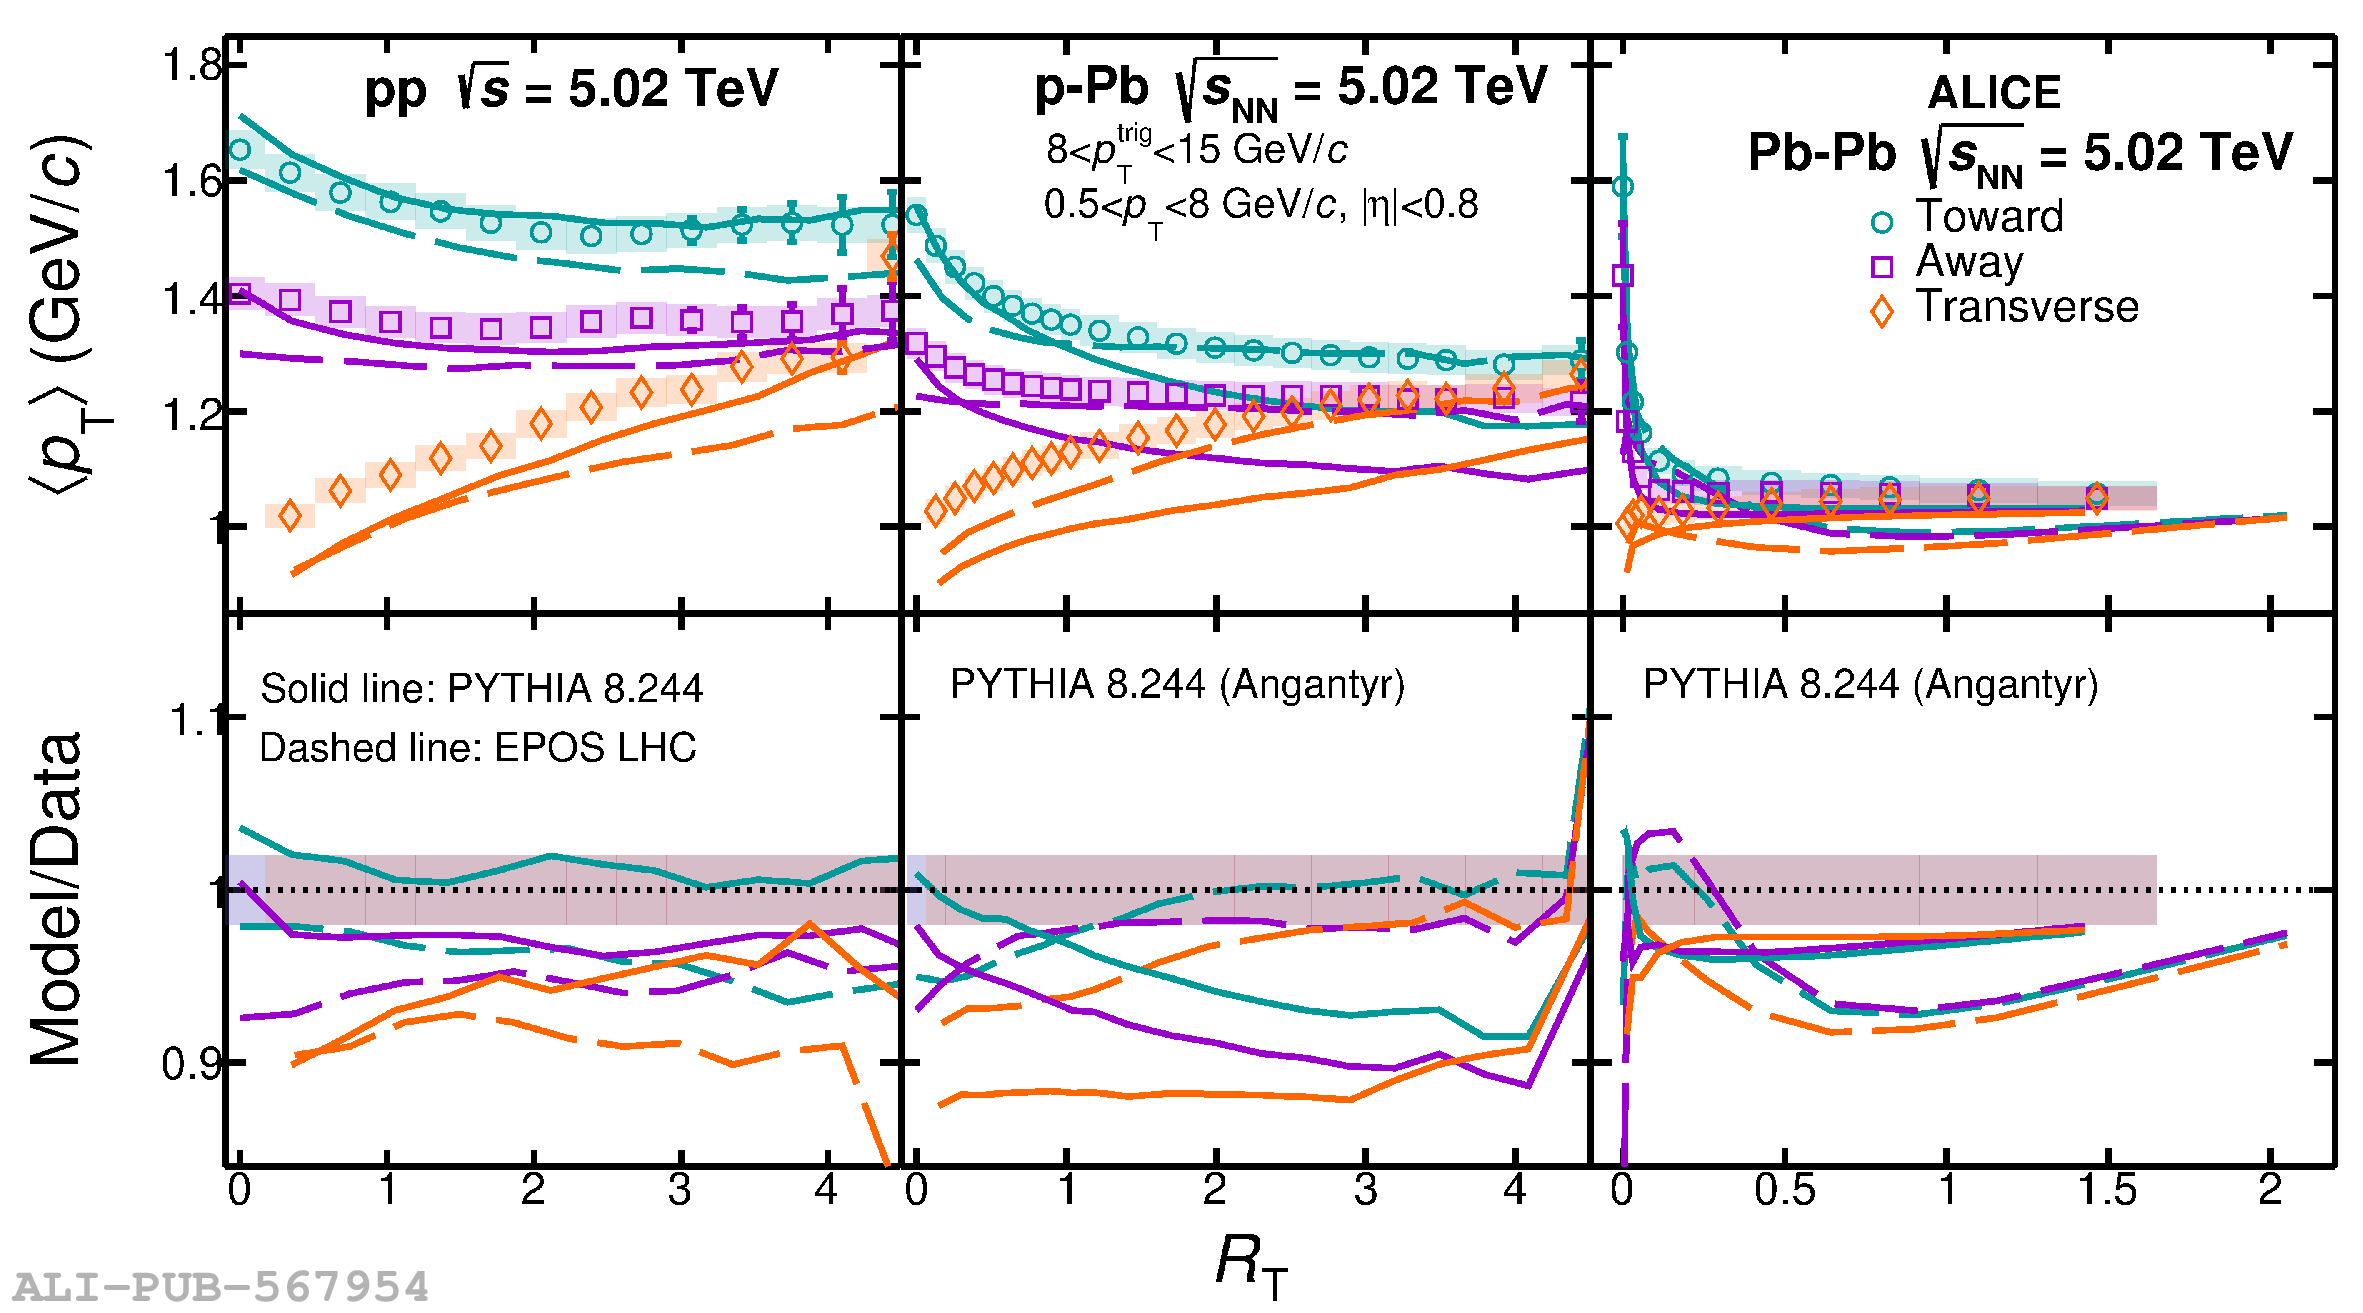 |
Figure 9
Top: integrated yield of charged particles in pp (left), p-Pb (middle), and Pb-Pb (right) collisions at $\sqrt{s_{\rm NN}} = 5.02$ TeV as a function of $R_{\rm T}$ for toward and away regions compared with predictions. Bottom: ratio of model predictions to data. The band around unity in the ratio depicts the experimental uncertainties. | 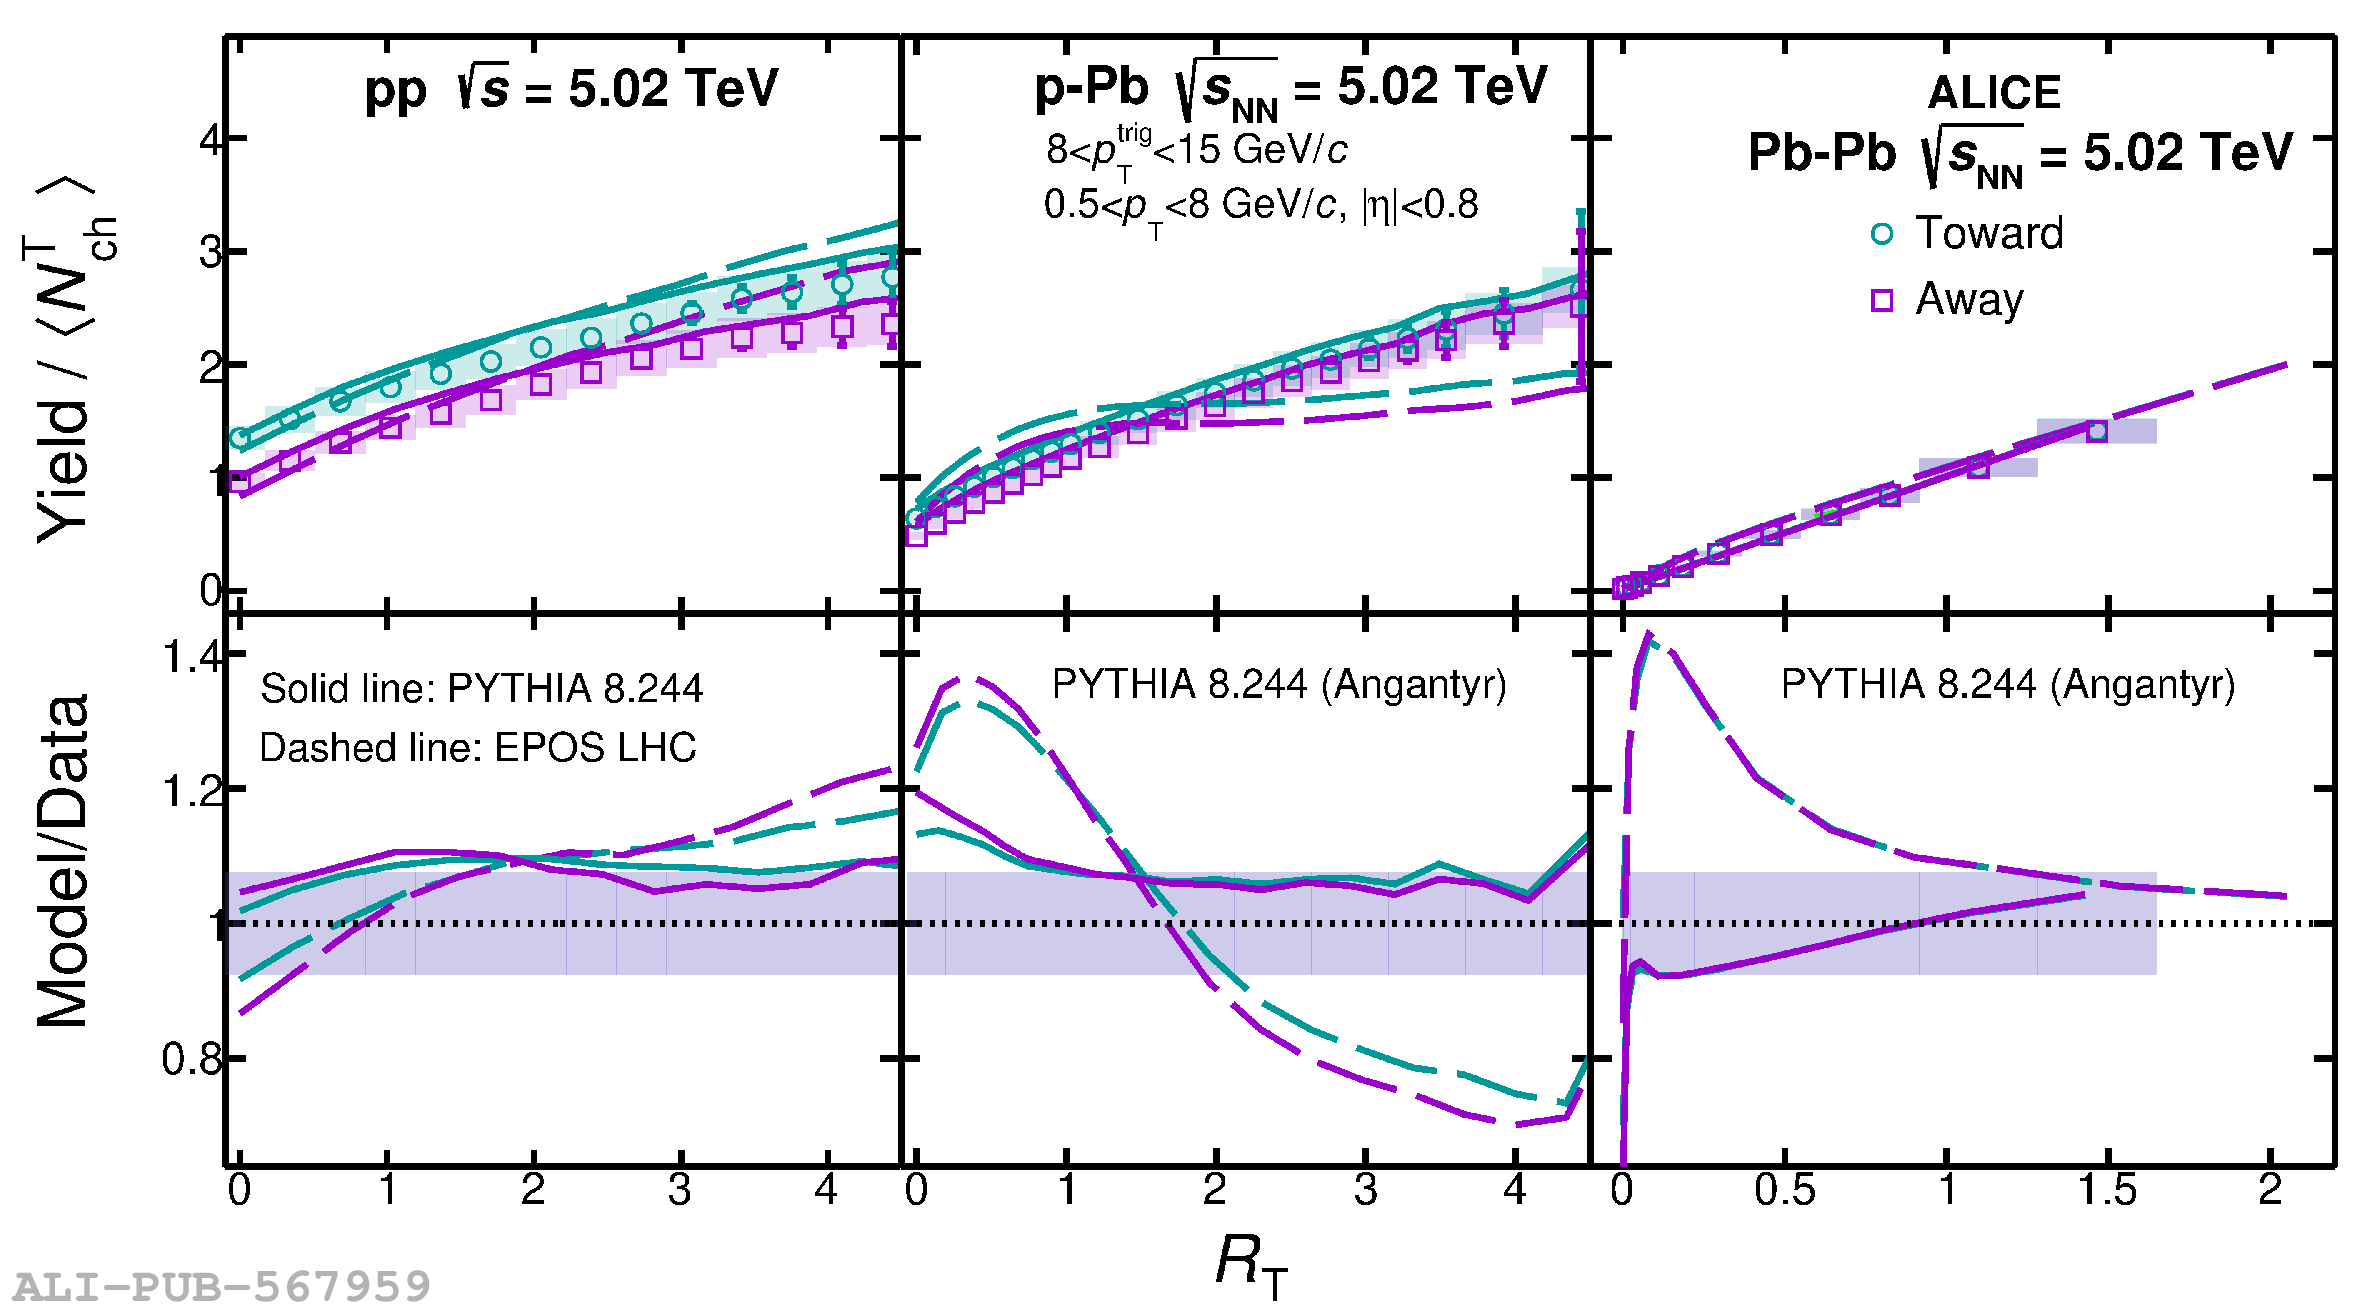 |