Top: $\langle p_{\rm T} \rangle$ of charged particles in pp (left), p-Pb (middle), and Pb-Pb (right) collisions at $\sqrt{s_{\rm NN}} = 5.02$ TeV as a function of $R_{\rm T}$ for different topological regions compared with predictions. Bottom: ratio of MC to data. The band around unity in the ratio depicts the experimental uncertainties. | 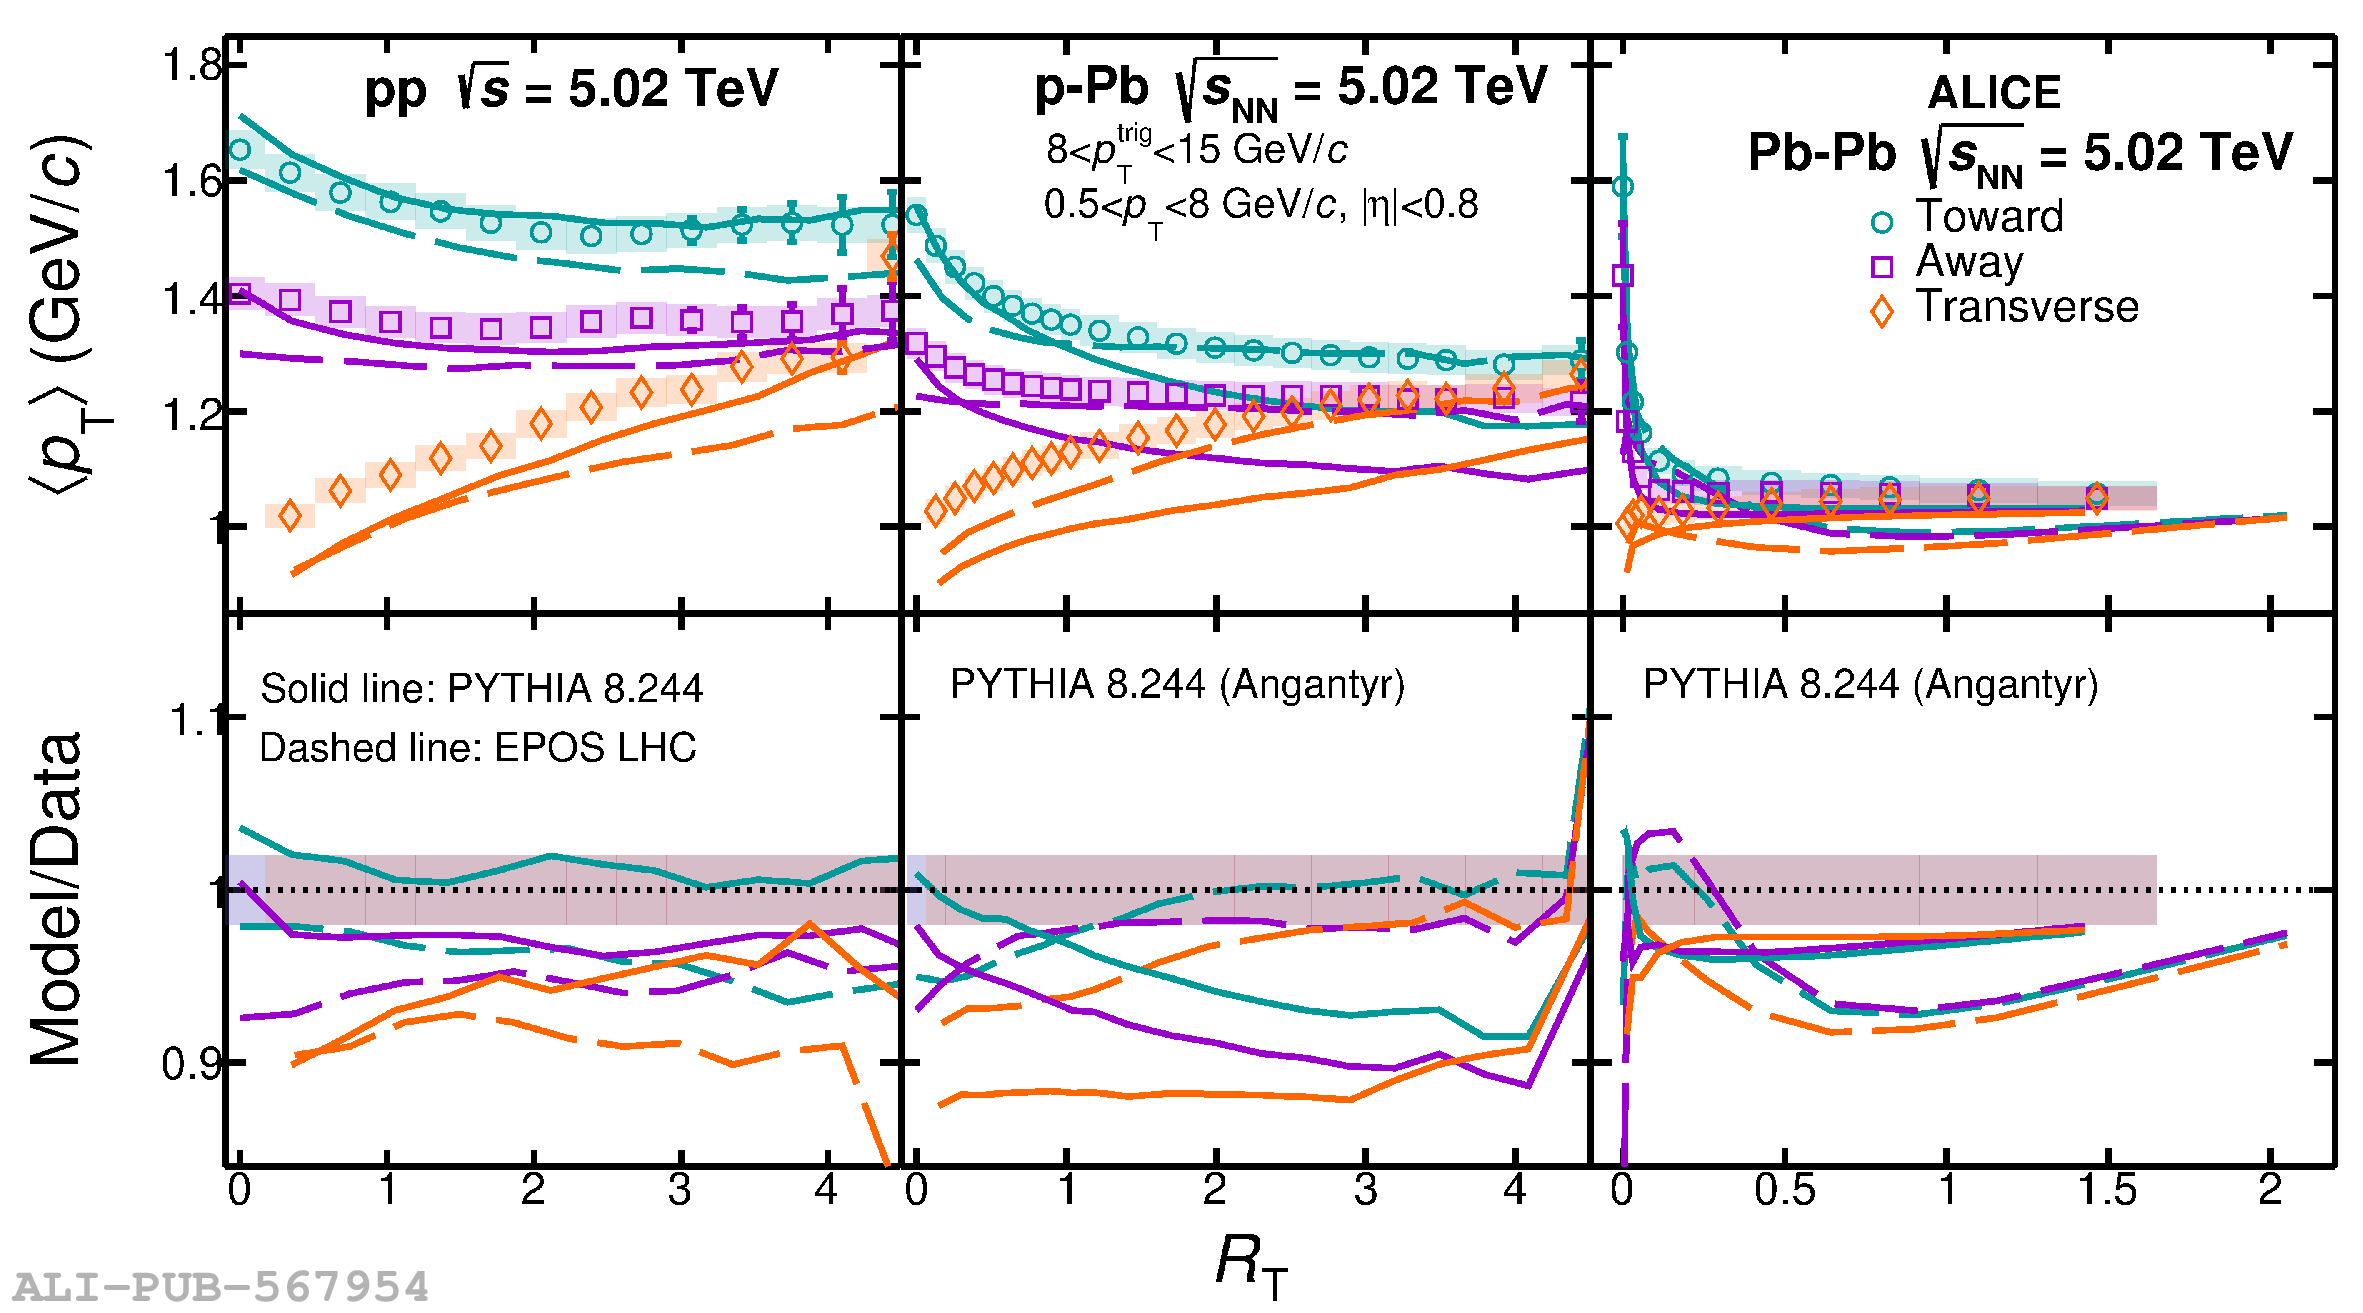 |