Top panel: charged-particle transverse momentum spectra as a function of $R_{\rm T}$ for different topological regions in p-Pb collisions at $\sqrt{s_{\rm NN}} = 5.02$ TeV. Data are compared with predictions. Middle panel: the ratio of the \pt spectra in different $R_{\rm T}$ intervals to the $R_{\rm T}$-integrated ones. The boxes and bars represent the systematic and statistical uncertainties, respectively. Bottom panel: the ratio of the $p_{\rm T}$ spectra for each $R_{\rm T}$ interval to the corresponding PYTHIA8 Angantyr and EPOS-LHC predictions. The shaded area represents the sum in quadrature of the systematic and statistical uncertainties. | 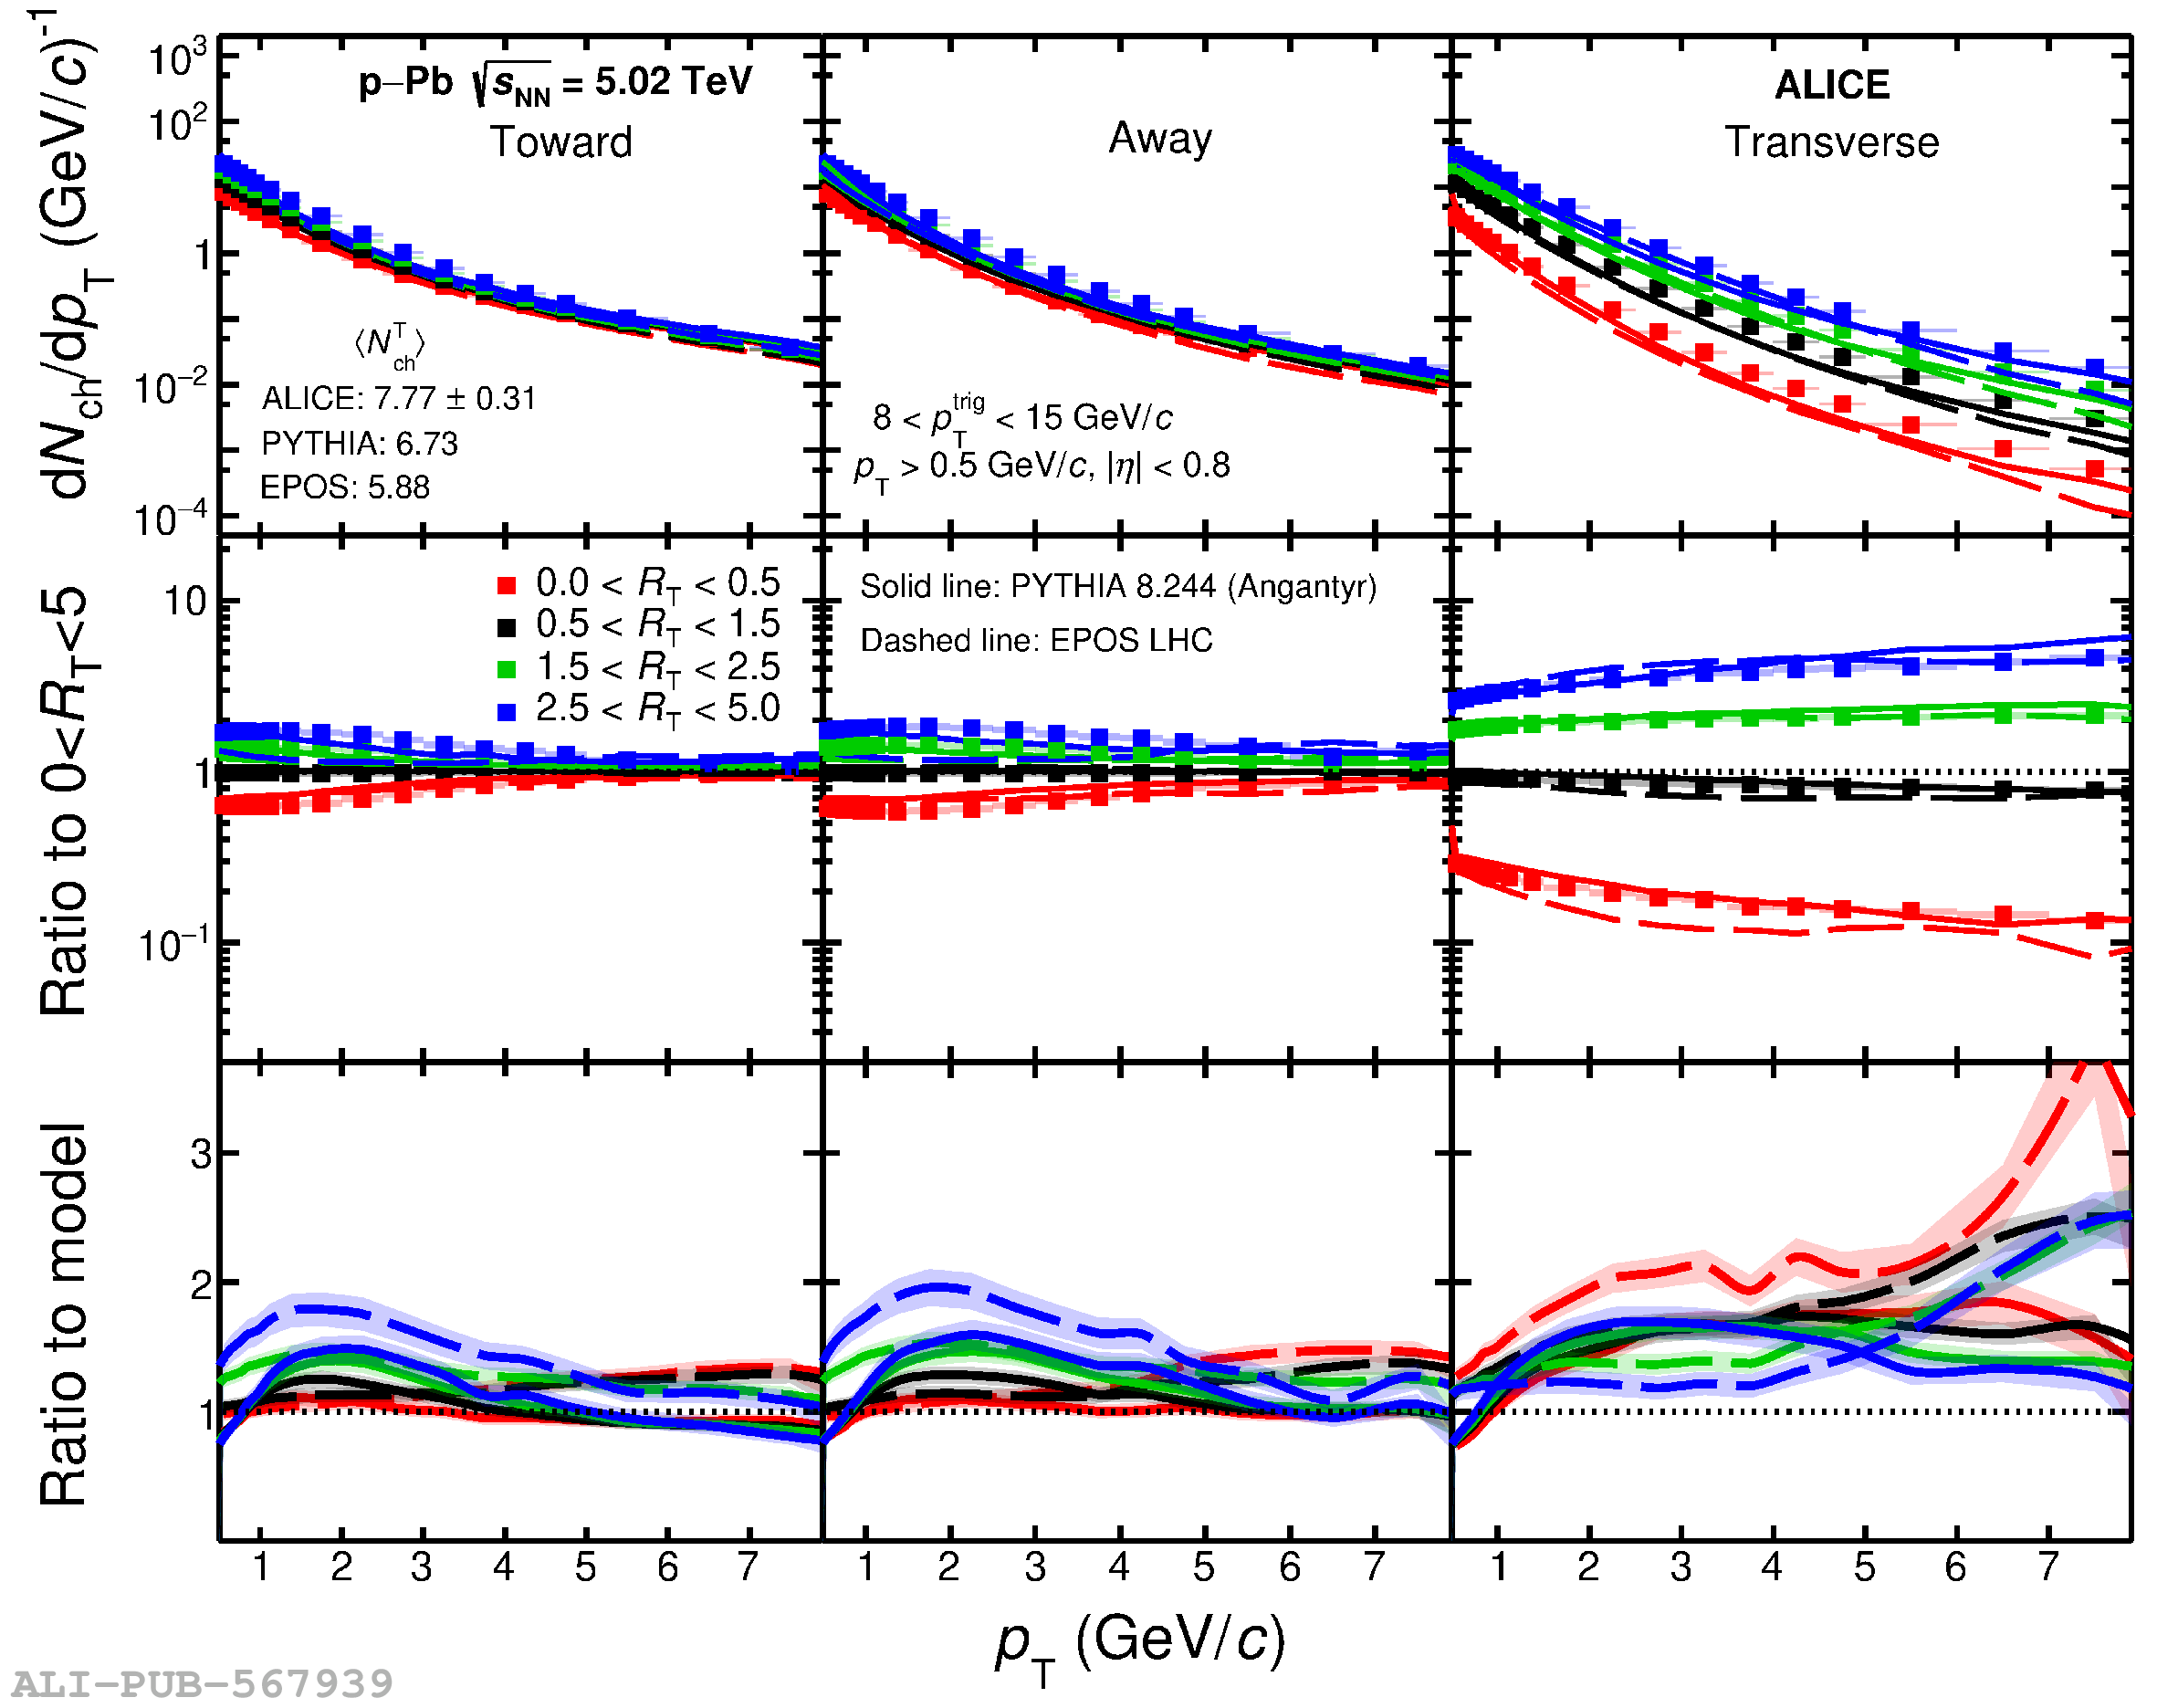 |