Top: $R_{\rm T}$ distributions in pp collisions for different centre-of-mass energies $\sqrt{s} = 2.76$, 5.02, 7, and 13 TeV. Bottom: $R_{\rm T}$ distributions normalised to that for pp collisions at $\sqrt{s} = 7$ TeV. The ratio is calculated using a linear interpolation between adjacent points. The boxes and bars represent the systematic and statistical uncertainties, respectively. The pp sample at $\sqrt{s} = 13$ TeV is smaller than that used for pp collisions at $\sqrt{s} = 7$TeV. | 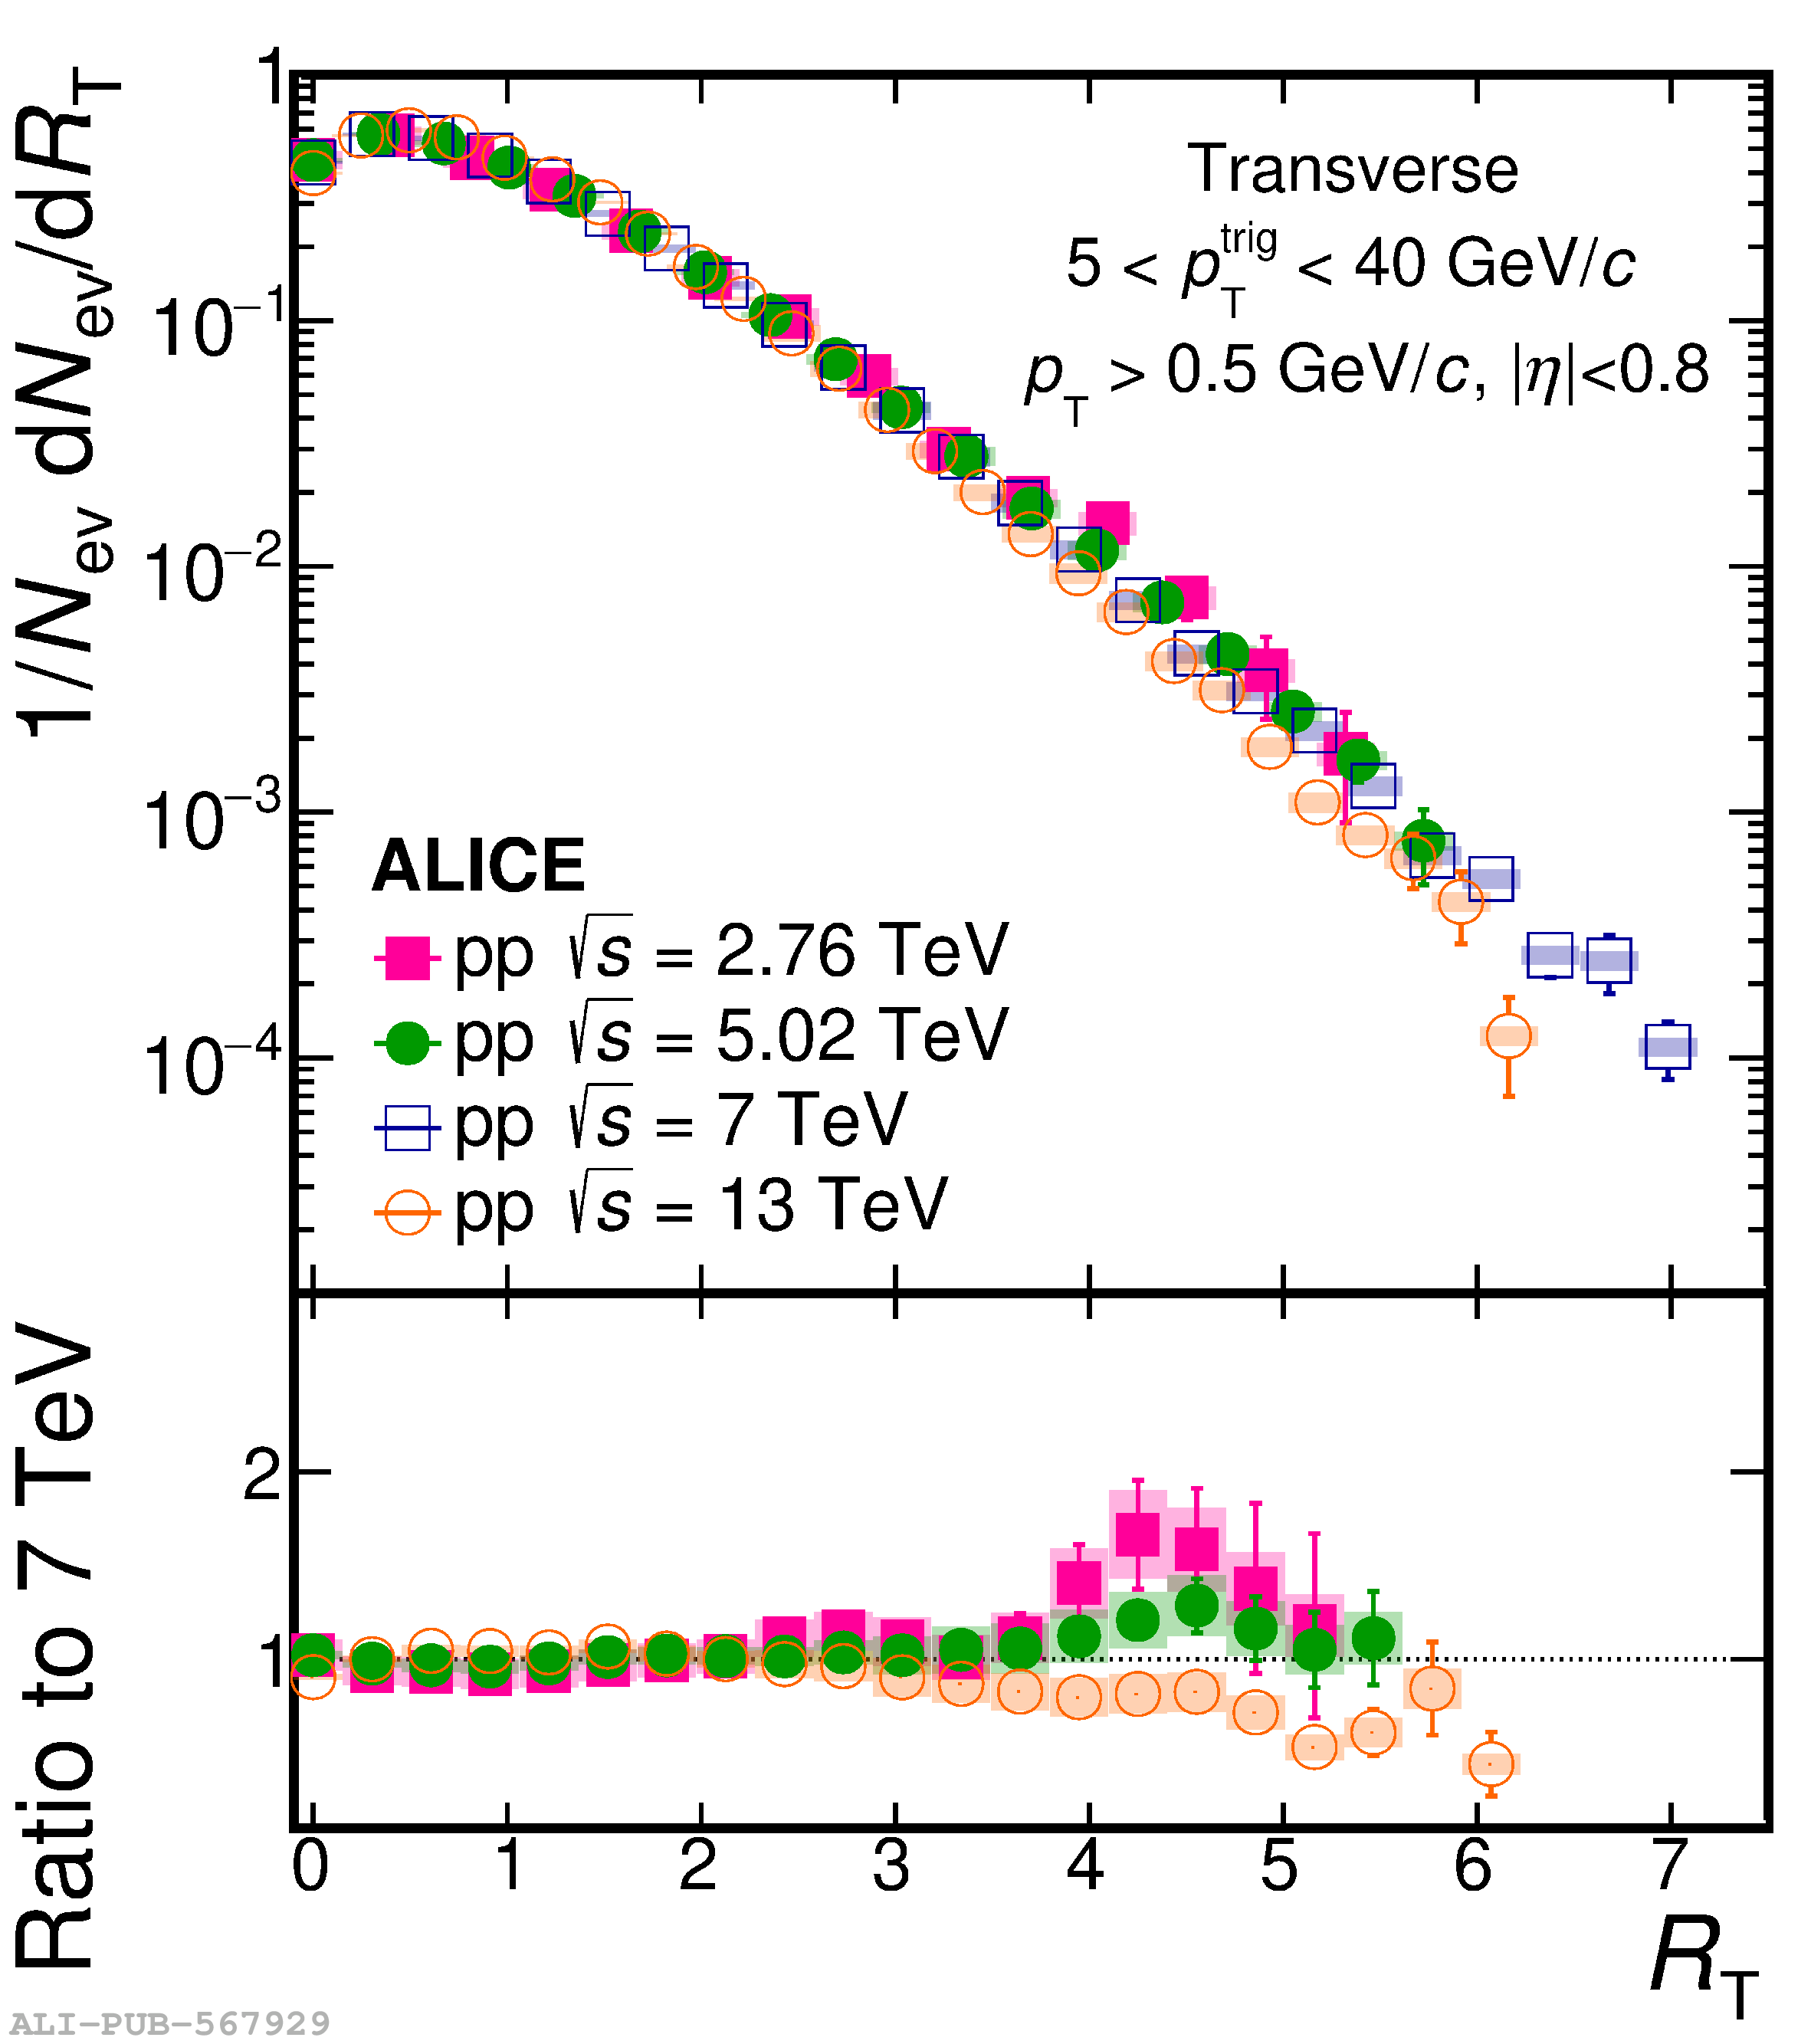 |