The ALICE Collaboration reports measurements of the semi-inclusive distribution of charged-particle jets recoiling from a high transverse momentum (high $p_{\rm T}$) charged hadron, in pp and central Pb$-$Pb collisions at center-of-mass energy per nucleon$-$nucleon collision $\sqrt{s_{\rm NN}}=5.02$ TeV. The large uncorrelated background in central Pb$-$Pb collisions is corrected using a data-driven statistical approach, which enables precise measurement of recoil jet distributions over a broad range in $p_{\rm T,ch\,jet}$ and jet resolution parameter $R$. Recoil jet yields are reported for $R=0.2$, 0.4, and 0.5 in the range $7 <~ p_{\rm T,ch\, jet} <~ 140$ GeV$/c$ and $\pi/2<~\Delta\varphi<~\pi$, where $\Delta\varphi$ is the azimuthal angular separation between hadron trigger and recoil jet. The low $p_{\rm T,ch\,jet}$ reach of the measurement explores unique phase space for studying jet quenching, the interaction of jets with the quark-gluonnplasma generated in high-energy nuclear collisions. Comparison of $p_{\rm T,ch\,jet}$ distributions from pp and central Pb$-$Pb collisions probes medium-induced jet energy loss and intra-jet broadening, while comparison of their acoplanarity distributions explores in-medium jet scattering and medium response. The measurements are compared to theoretical calculations incorporating jet quenching.
Physical Review C 110 (2024) 014906
HEP Data
e-Print: arXiv:2308.16128 | PDF | inSPIRE
CERN-EP-2023-188
Figure group
Figure 1
Trigger-normalized recoil jet distributions ($R=0.4$) as a function of $\Delta\varphi$ and $p_{\rm T,\text{ch jet}}^{\rm reco}$, in pp collisions (left) and in Pb$-$Pb collisions (right) at $\snn=5.02$ TeV, for TT{20,50} Gev/$c$. The azimuthal region of the analysis is indicated by the vertical dashed lines. | 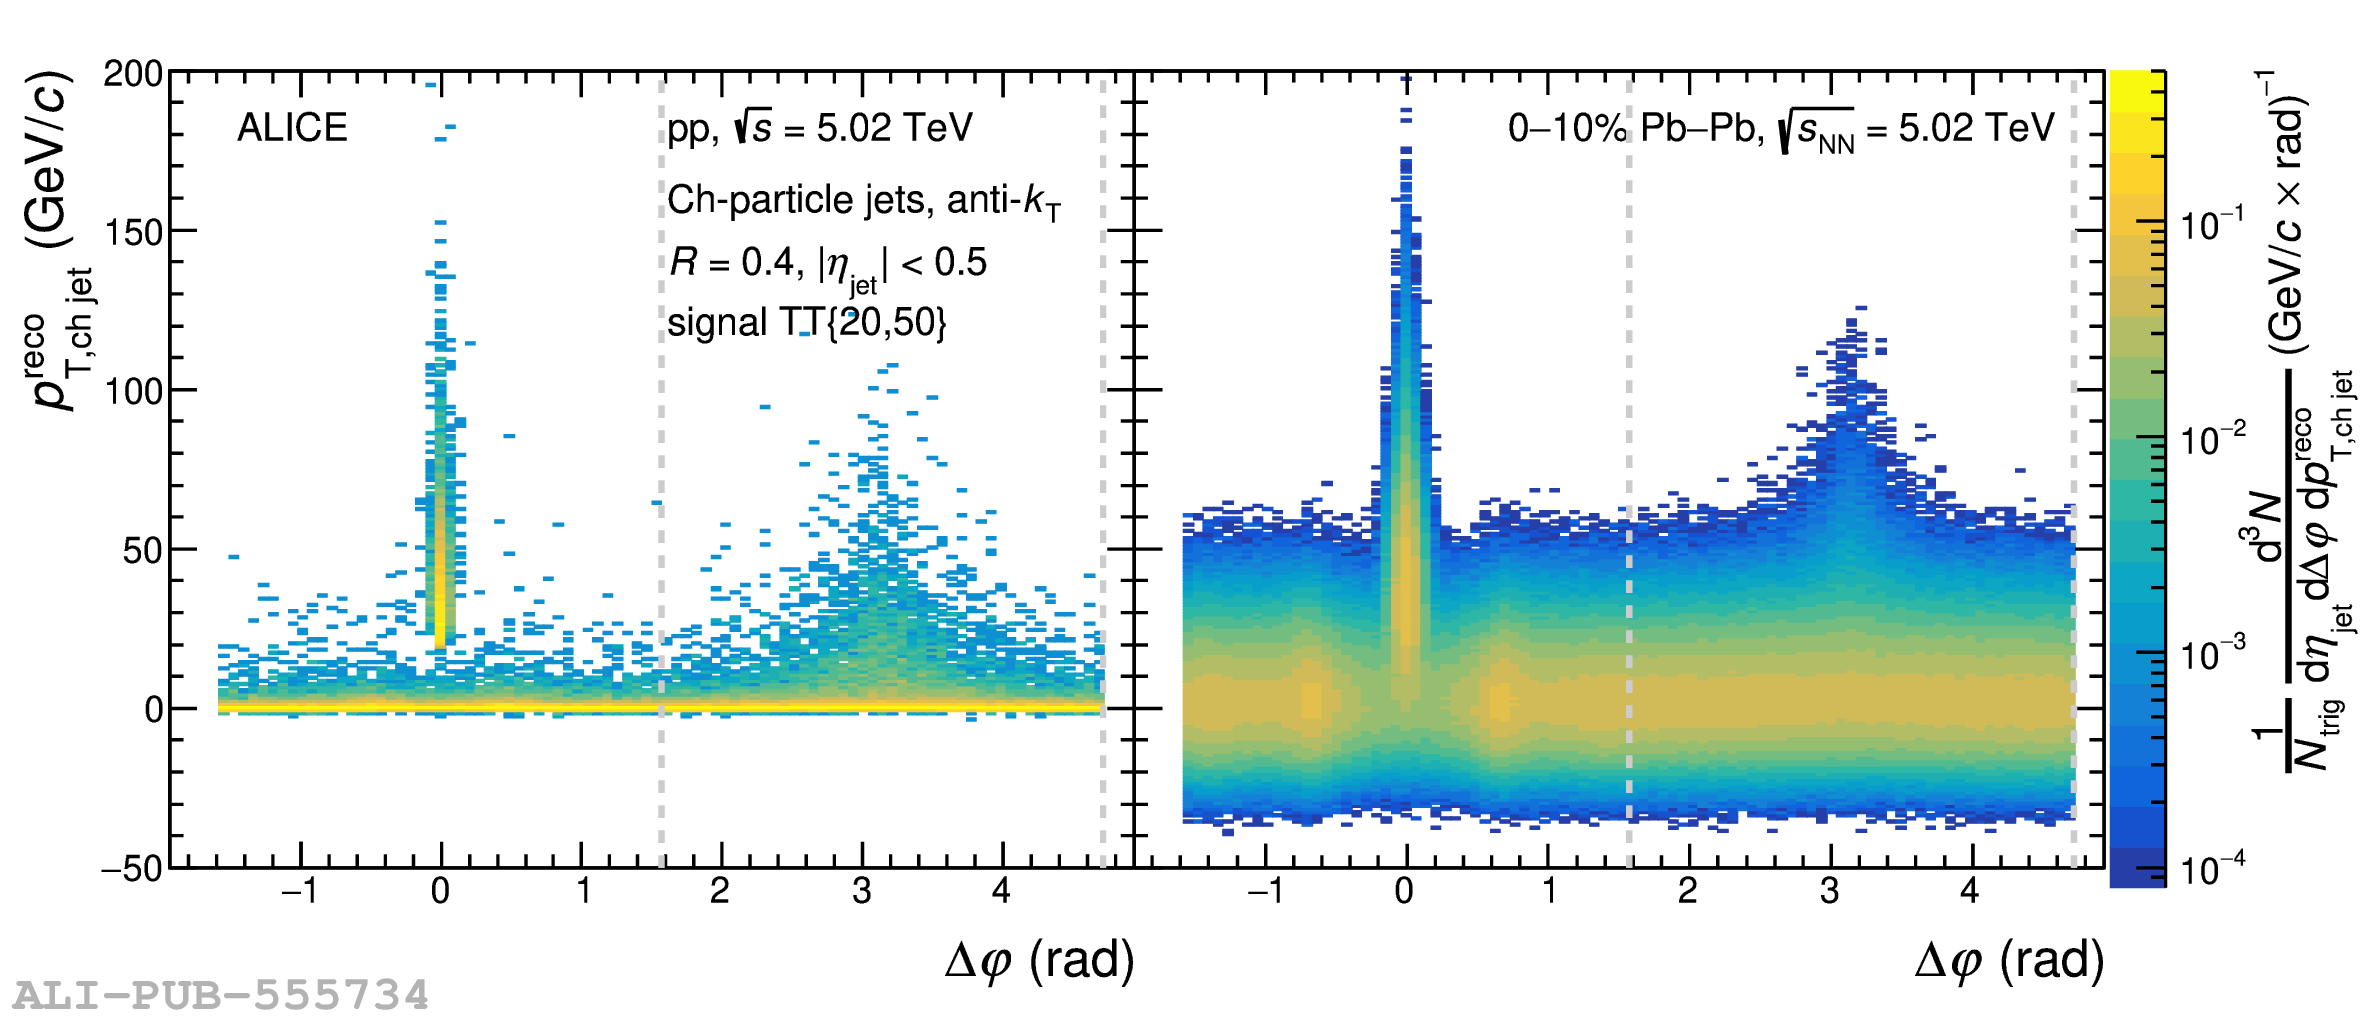 |
Figure 2
$\rho$ distributions for central Pb$-$Pb collisions at $\sqrtsNN=5.02$ TeV. Upper panel: ${\rm TT_{sig}}$ and ${\rm TT_{ref}}$ distributions, and the ${\rm TT_{ref}}$ distribution shifted by $\Delta\rho=1.7$ GeV/$c$ (Sec. 4.1). Lower panel: ratio of ${\rm TT_{ref}}$ and shifted ${\rm TT_{ref}}$ to ${\rm TT_{sig}}$ distribution. The mean ($\mu$) and RMS of the distributions are given in the legend. The vertical lines on the data points are the statistical uncertainties, and the shaded band on the ratio of the ${\rm TT_{sig}}$ over the shifted ${\rm TT_{ref}}$ distributions represents the systematic uncertainty of the procedure. | 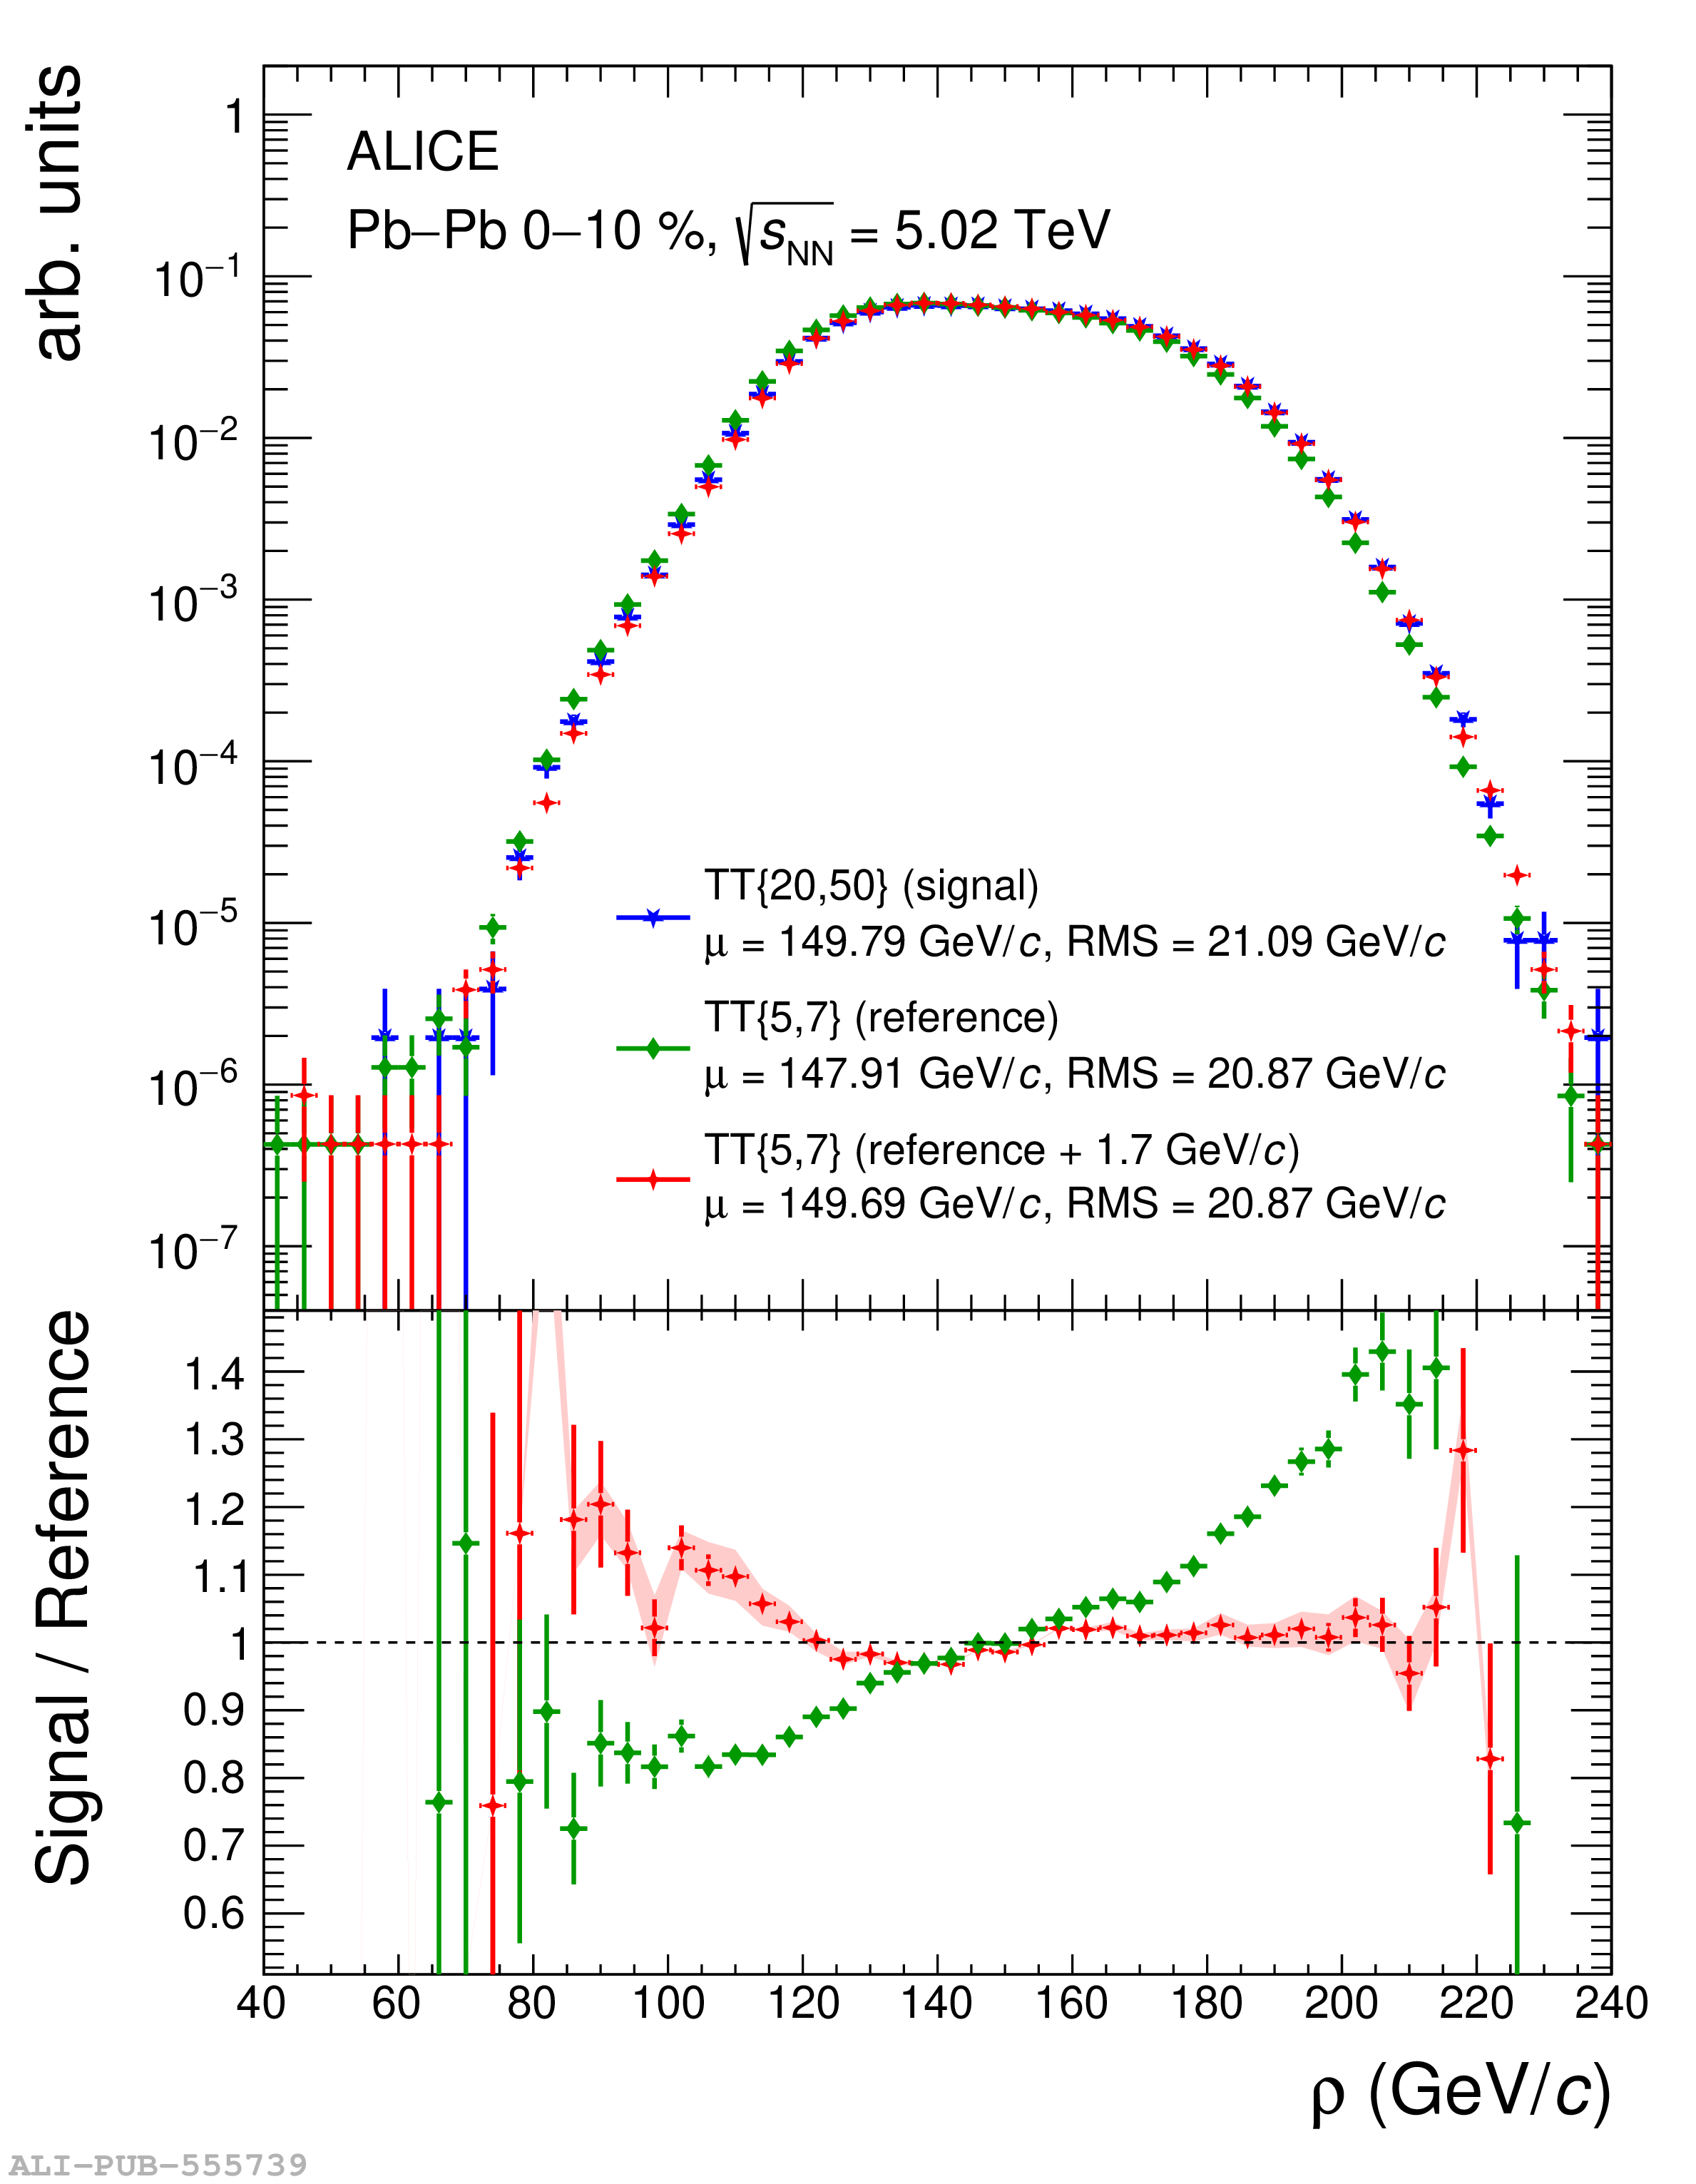 |
Figure 3
Trigger-normalized semi-inclusive recoil jet distributions for ${\rm TT_{sig}}$ and ${\rm TT_{ref}}$-selected populations in central Pb$-$Pb collisions at $\sqrtsNN=5.02$ TeV, for $R=0.2$ (upper panels), 0.4 (middle panels), and 0.5 (lower panels). The $\Delta\rho$ correction (Sec. 4.1) has been applied to the ${\rm TT_{ref}}$ distributions. The left column shows distributions in the $\Delta\varphi$ acceptance of the $\Delta_{\rm recoil}(p_{\rm T,jet})$ analysis. The remaining columns show distributions in selected $\Delta\varphi$ bins for the $\Delta_{\rm recoil}(\Delta\varphi)$ analysis, with the second column having the largest deviation from $\Delta\varphi=\pi$ and the rightmost column at $\Delta\varphi\approx\pi$. | 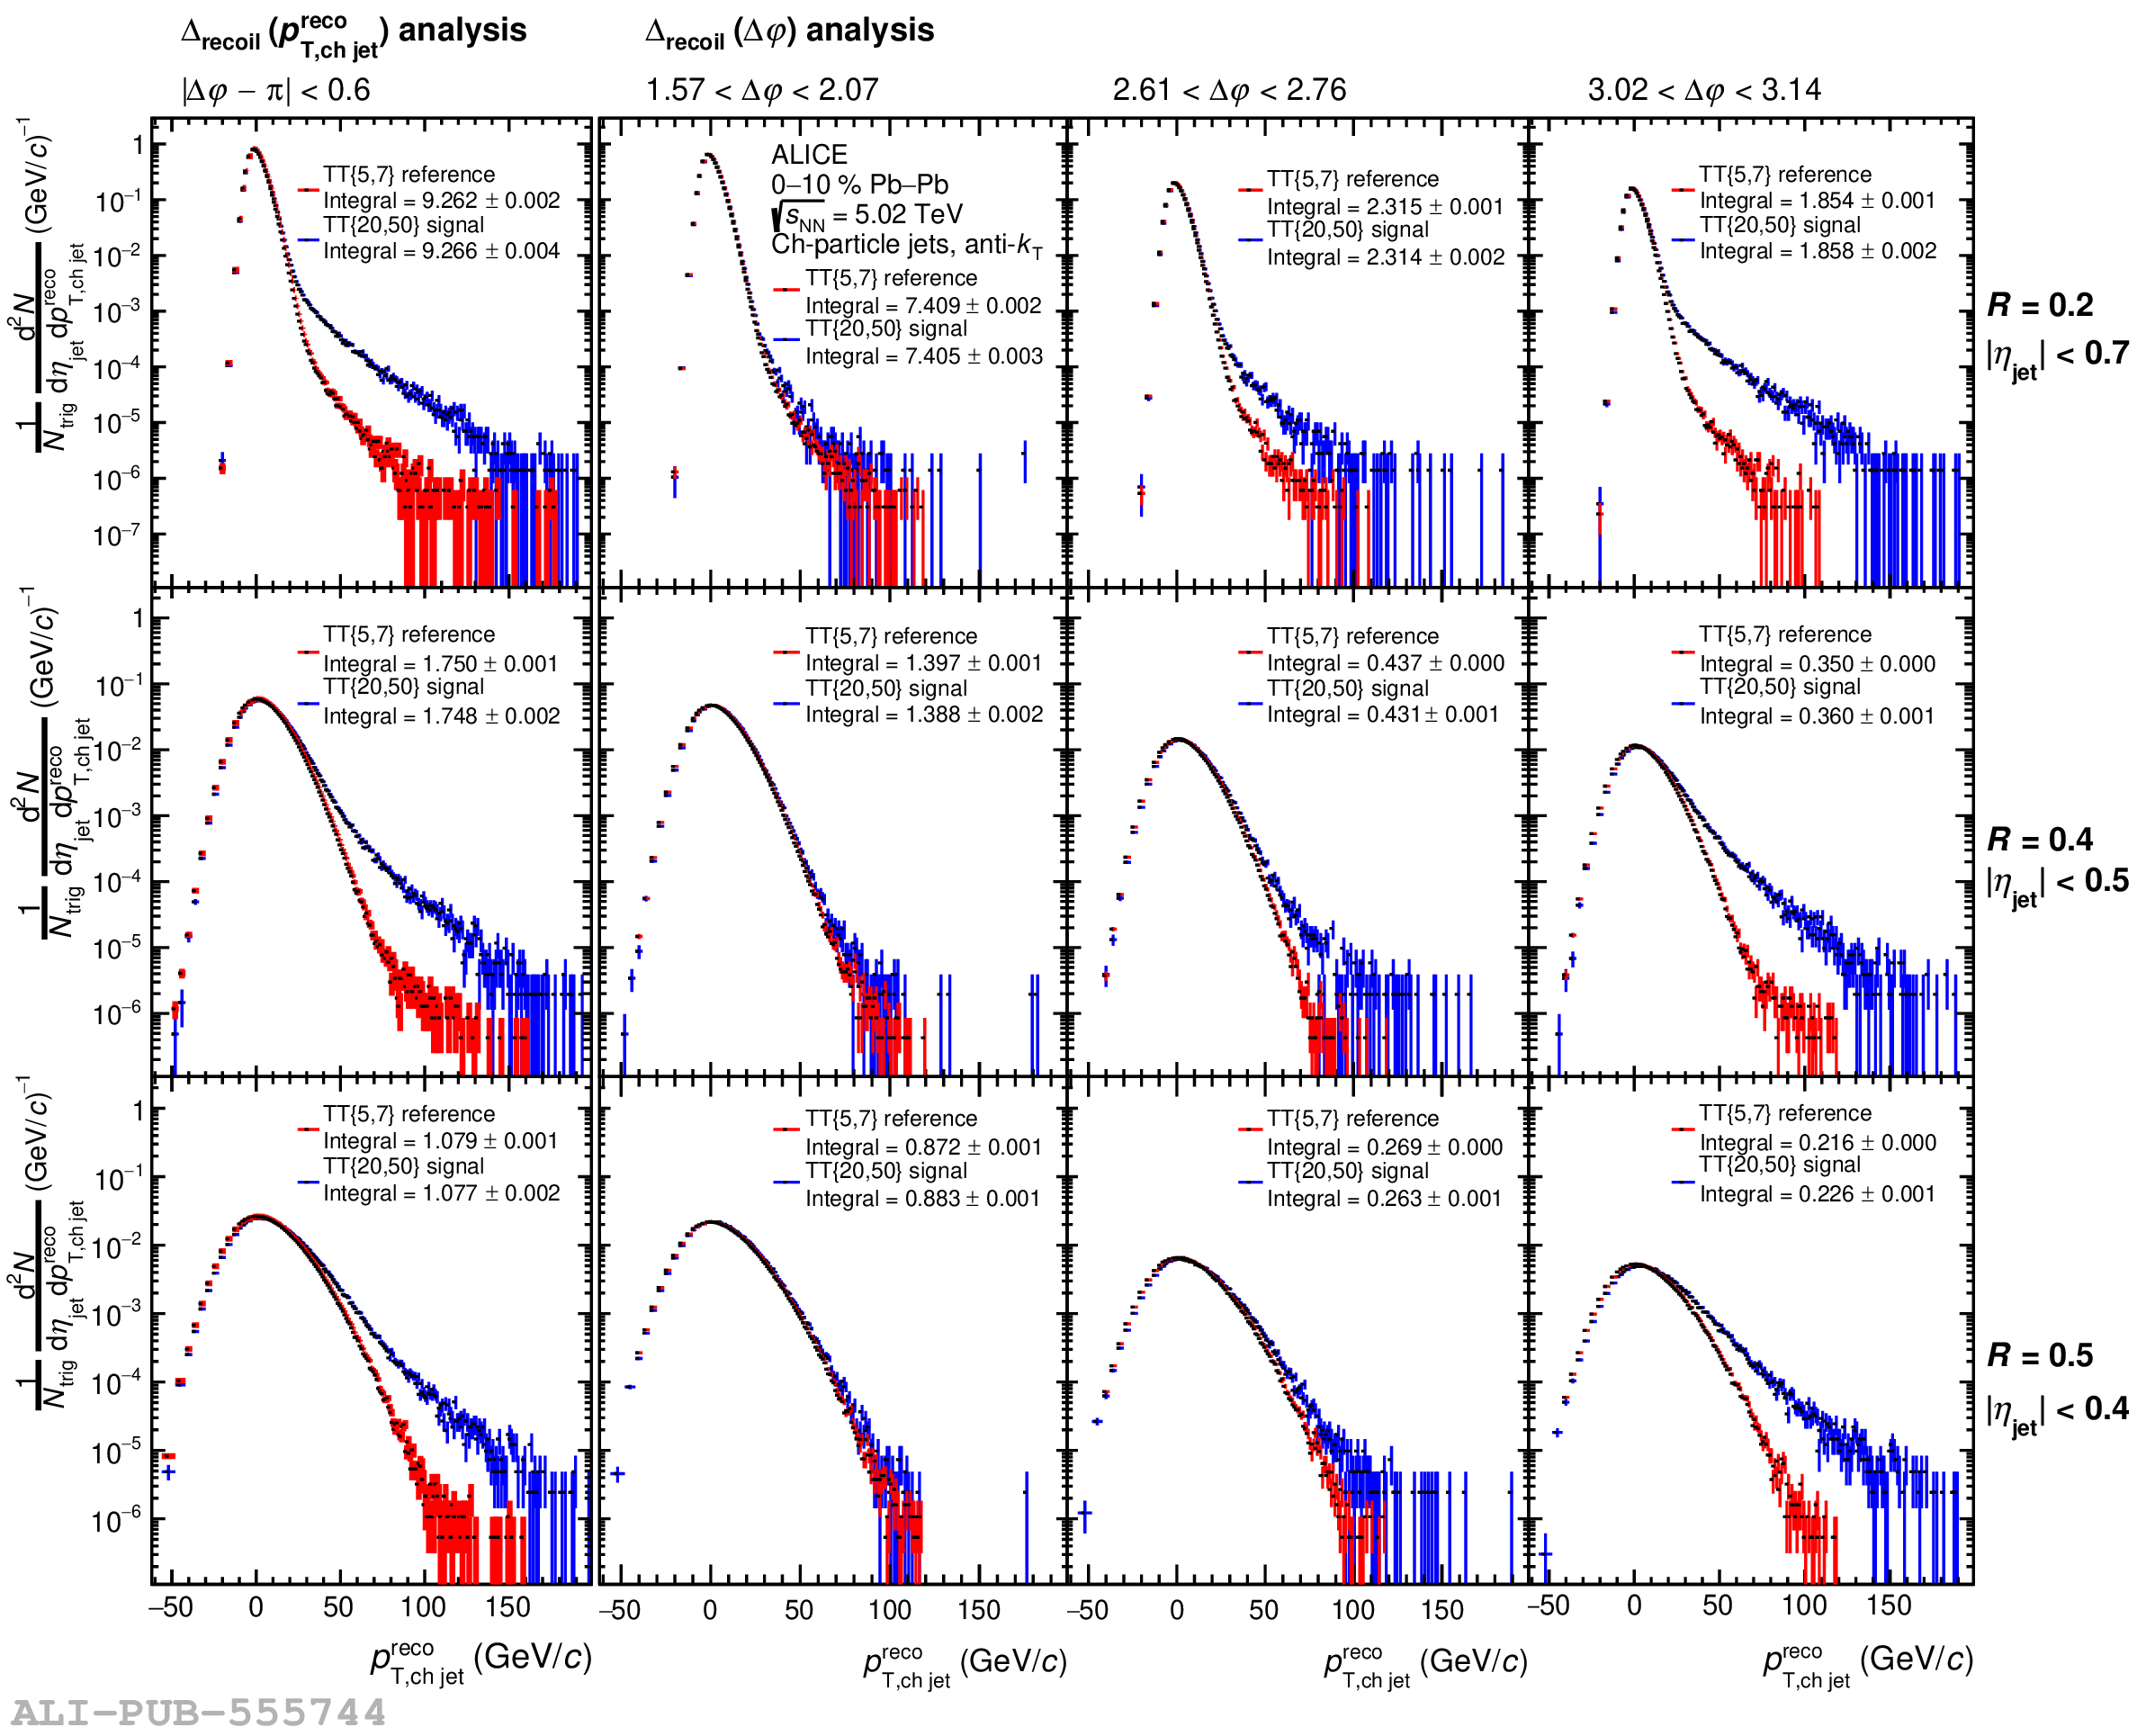 |
Figure 4
Ratio of ${\rm TT_{sig}}$ and ${\rm TT_{ref}}$-selected distributions from Fig. 3, with the same panel layout. The horizontal dashed line and band show the value of $c_{\rm Ref}$ and its uncertainty. The vertical solid grey line is at $p_{\rm T,\text{ch jet}}^{\rm reco}=0$, and horizontal solid grey line is at unity. See text for details. | 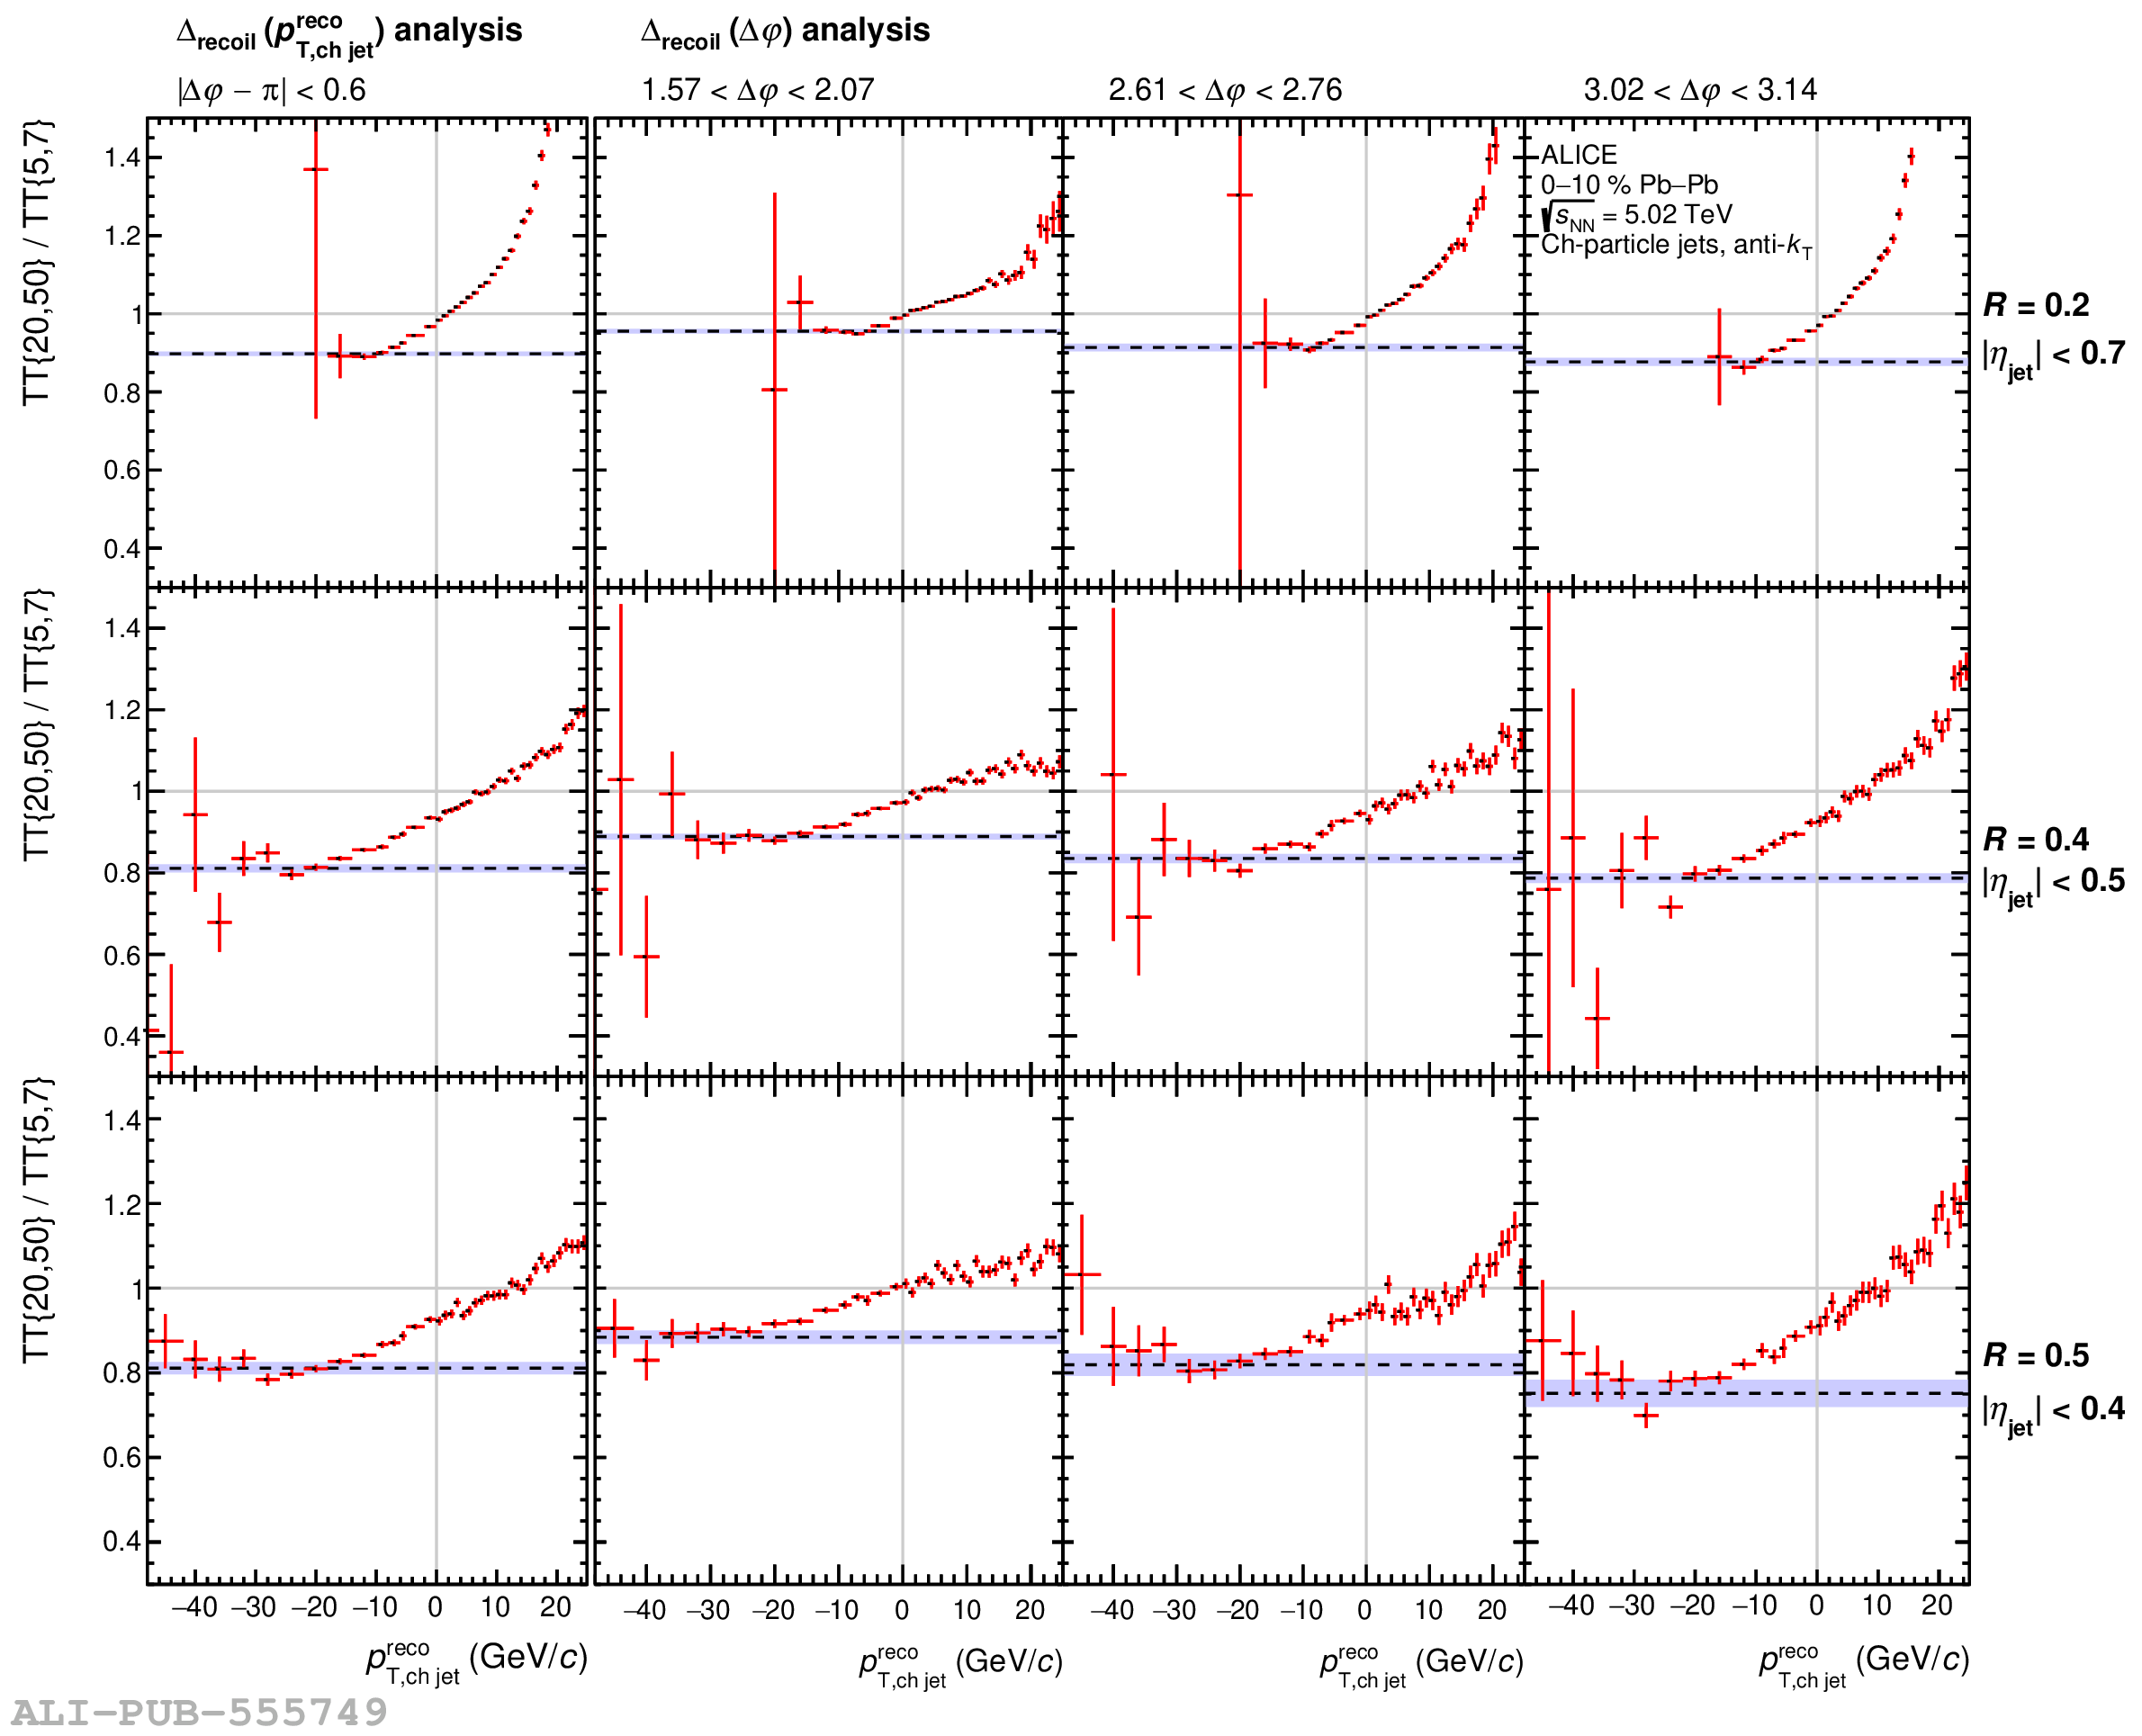 |
Figure 5
Scaling factor $c_{\rm Ref}$ of $\Delta_{\rm recoil}(\Delta\varphi)$ for $R=0.2$, 0.4, and 0.5. The vertical bars indicate the statistical uncertainties. The value of $c_{\rm Ref}$ for the $\Delta_{\rm recoil}(p_{\rm T,jet})$ analysis, which integrates over the region $|\Delta\varphi - \pi| < 0.6$, is displayed as a horizontal bar for each value of $R$, with shaded bands indicating statistical uncertainty. | 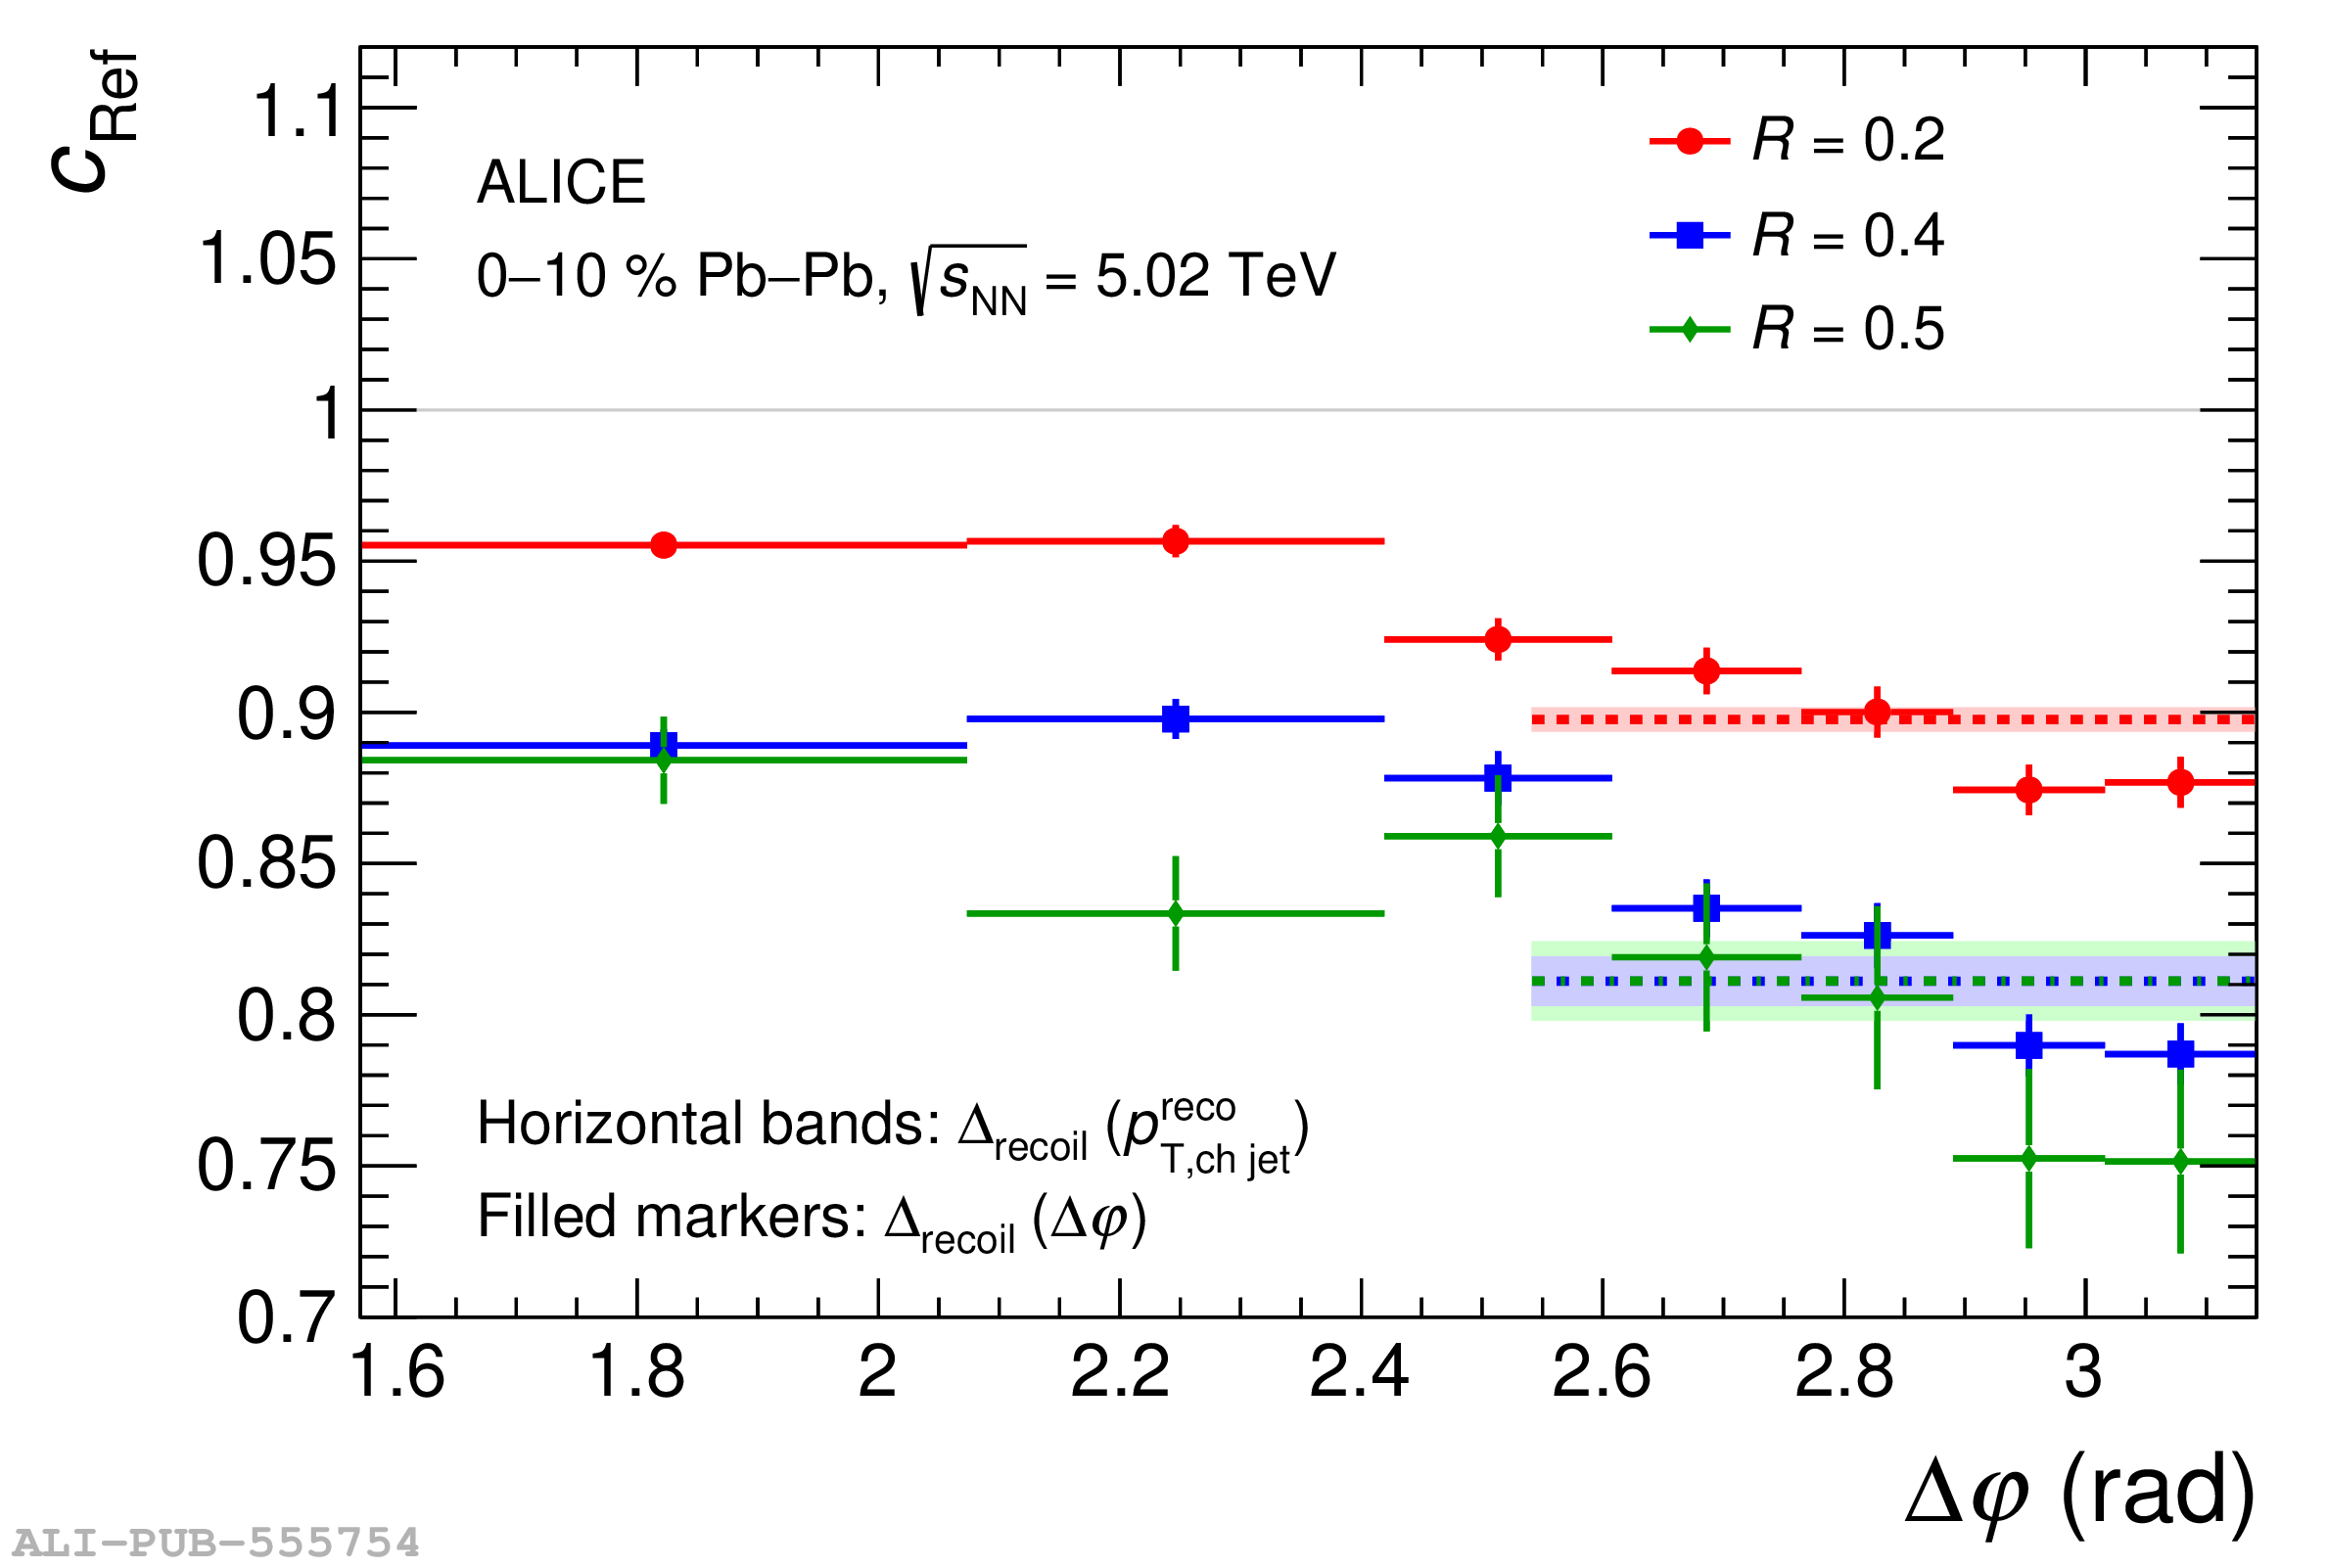 |
Figure 6
Trigger-normalized semi-inclusive recoil jet distributions for ${\rm TT_{sig}}$ and ${\rm TT_{ref}}$-selected populations in central Pb$-$Pb collisions at $\sqrtsNN=5.02$ TeV, for $R=0.2$ (top), 0.4 (middle), and 0.5 (bottom). The ${\rm TT_{ref}}$ distribution has the $\Delta\rho$ calibration applied and is scaled by $c_{\rm Ref}$. The resulting $\Delta_{\rm recoil}$ distribution is also shown. Left panels: Distributions as a function of $p_{\rm T,\text{ch jet}}^{\rm reco}$ in the $\Delta\varphi$ acceptance of the $\Delta_{\rm recoil}(p_{\rm T,jet})$ analysis. Right panels: Distributions as a function of $\Delta\varphi$, for $p_{\rm T,\text{ch jet}}^{\rm reco}\in[20,30]$ GeV/$c$. Data points with a negative value for $\Delta_{\rm recoil}$ are not shown, but all such points are consistent with zero within statistical error. | 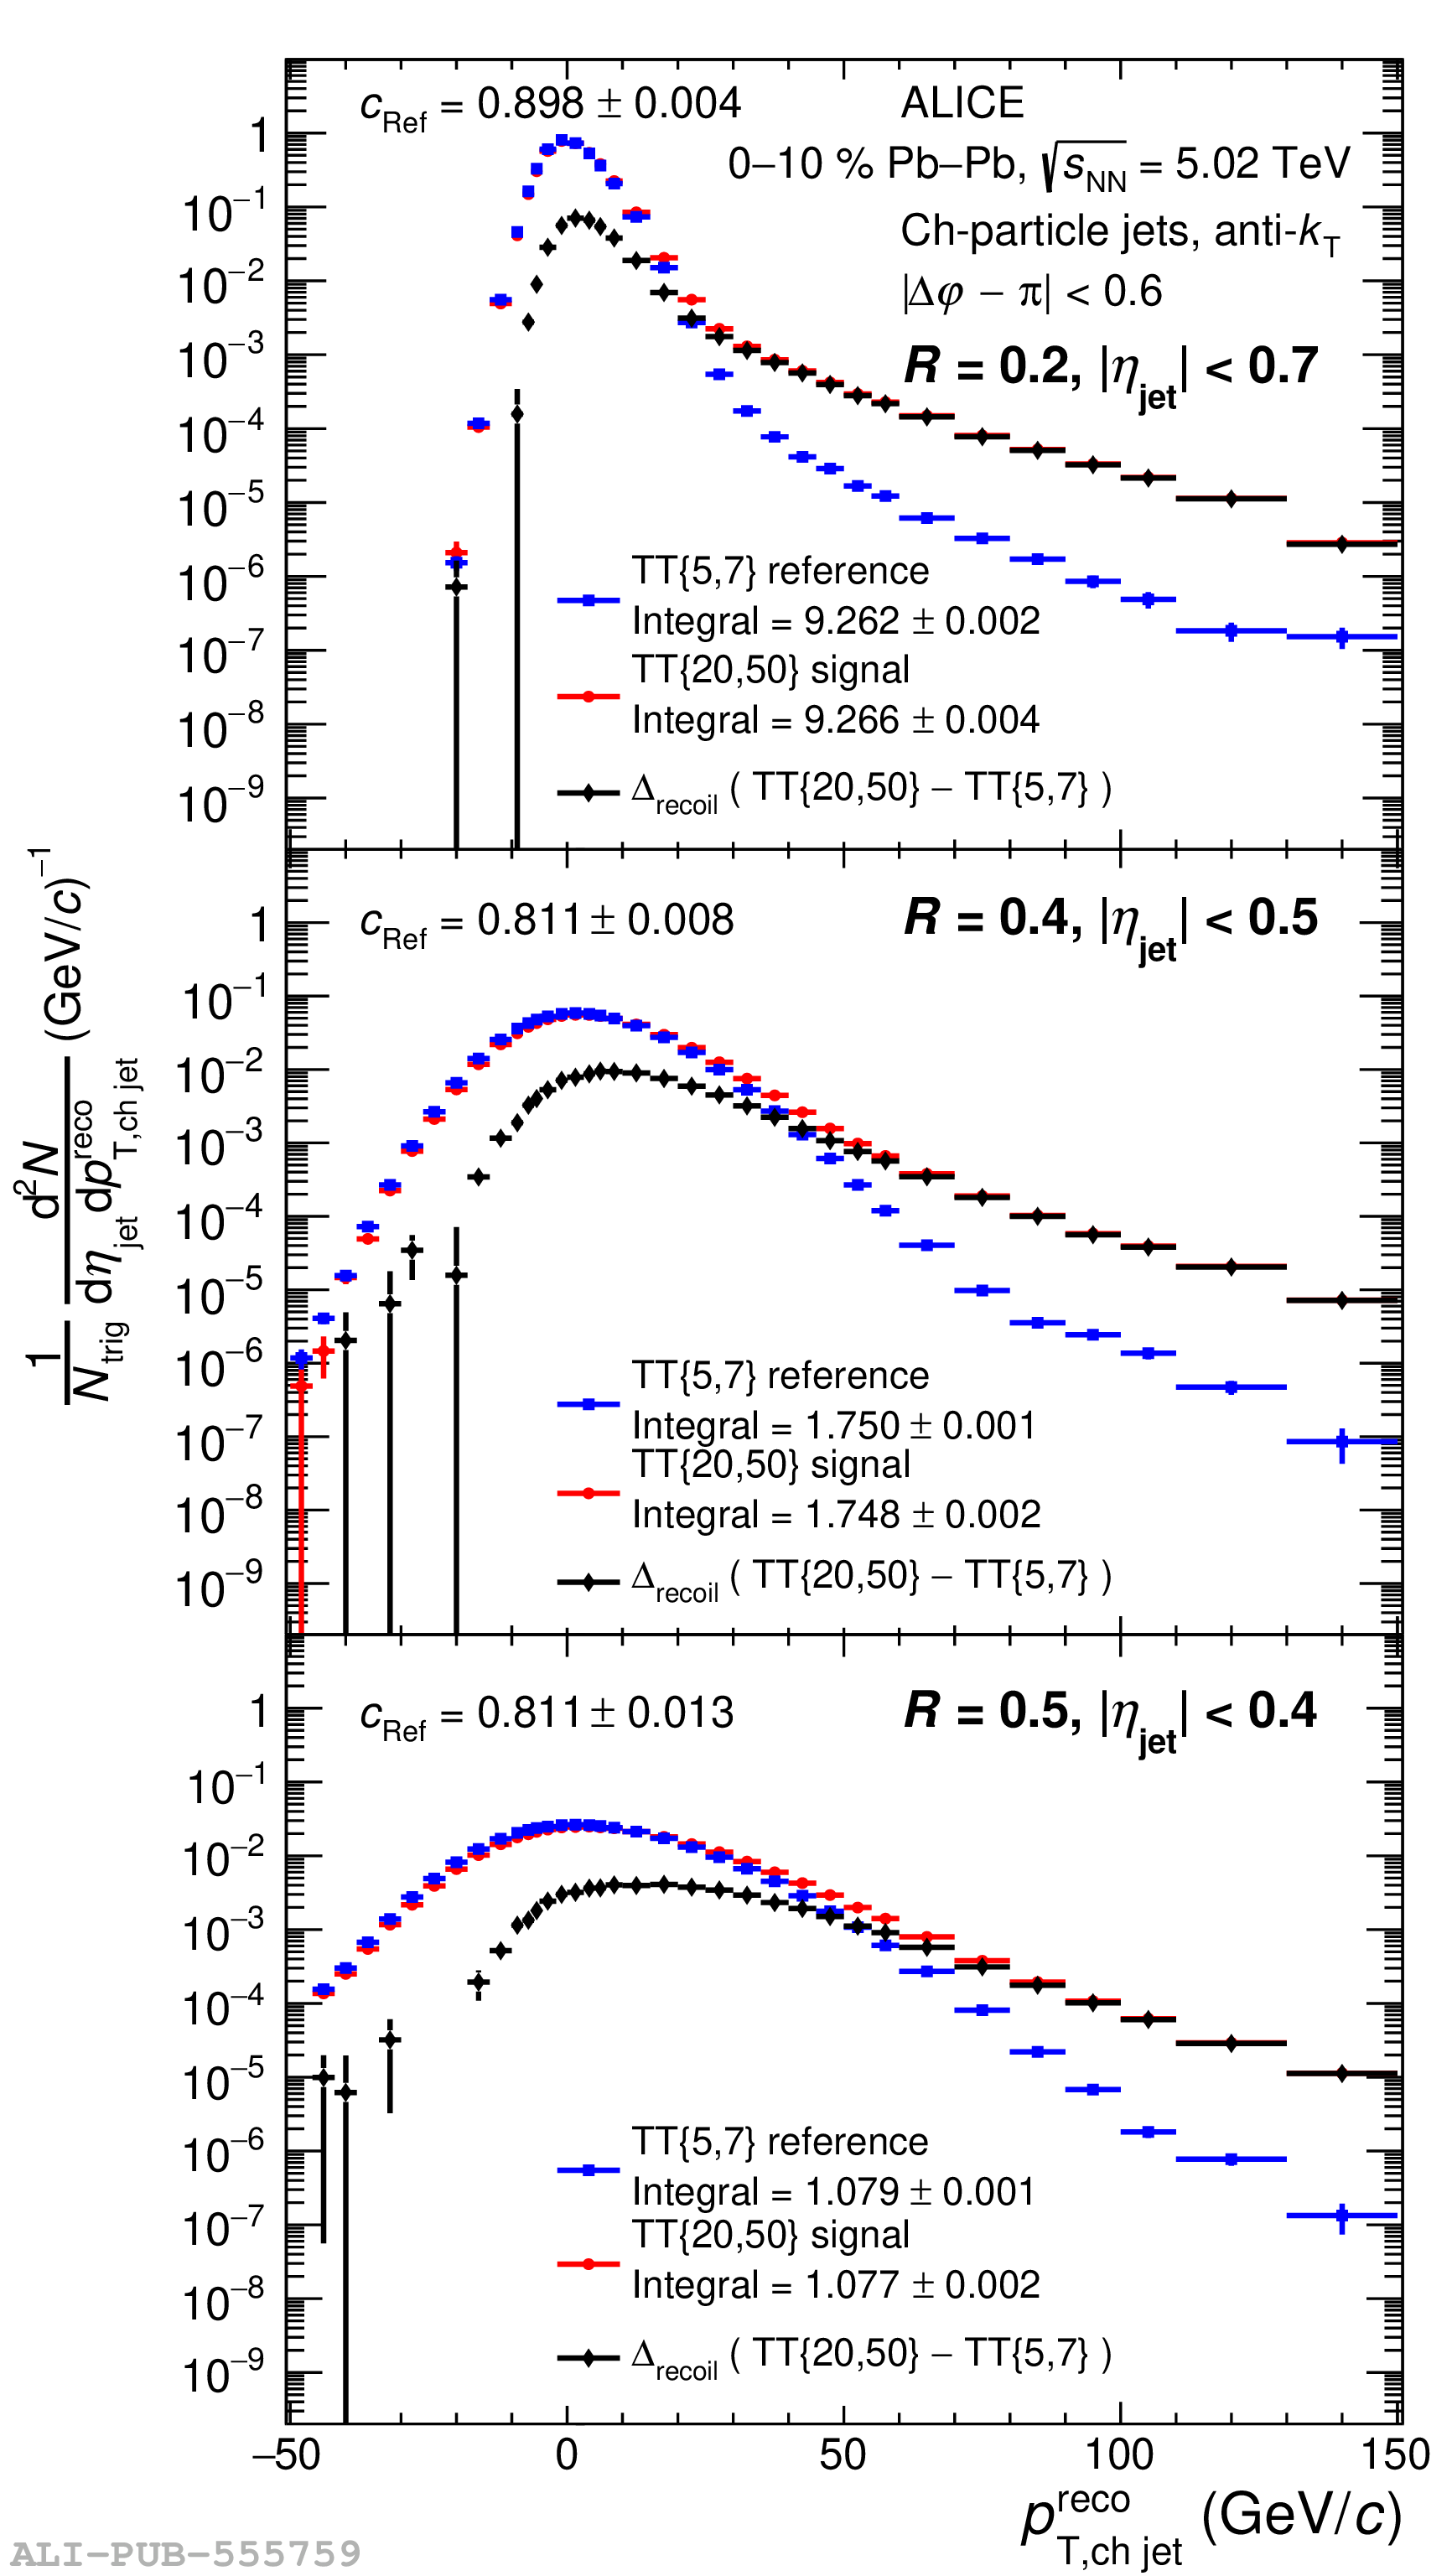 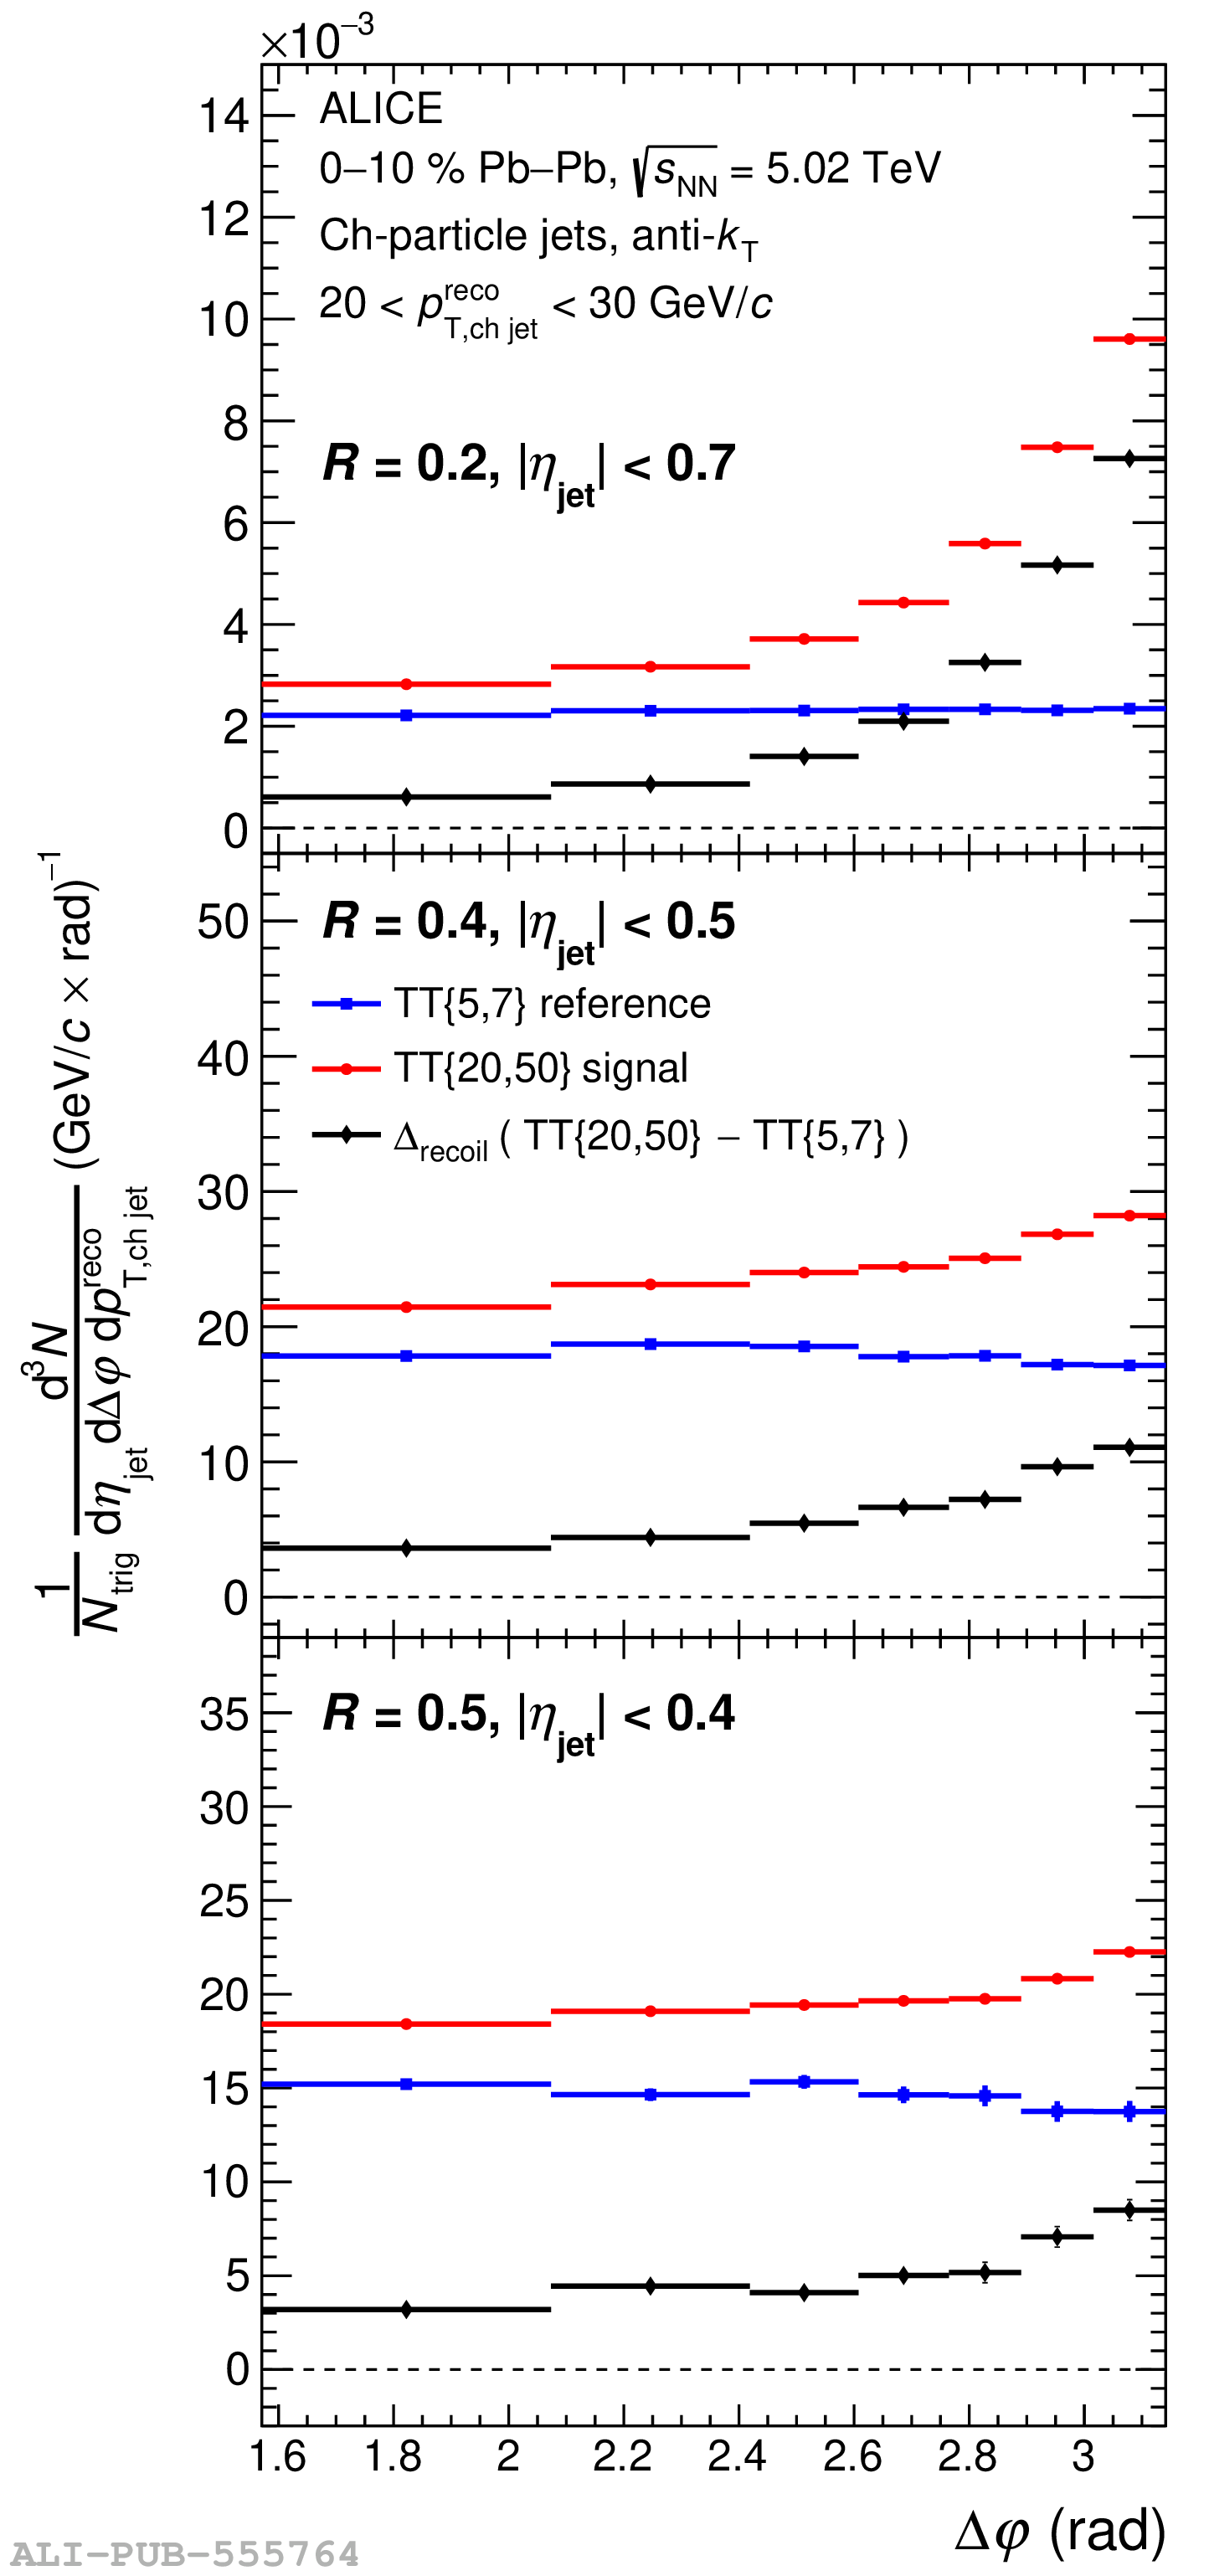 |
Figure 7
Left: trigger-normalized semi-inclusive recoil jet distributions with $R=0.4$ for ${\rm TT_{sig}}$ and ${\rm TT_{ref}}$-selected populations in pp collisions at $\s=5.02$ TeV; Right: ratio of the two distributions. The horizontal blue line indicates the fit to the ratio close to $p_{\rm T,\text{ch jet}}^{\rm reco}=0$ for the determination of $c_{\rm Ref}$, the value of which is also given in the figures. | 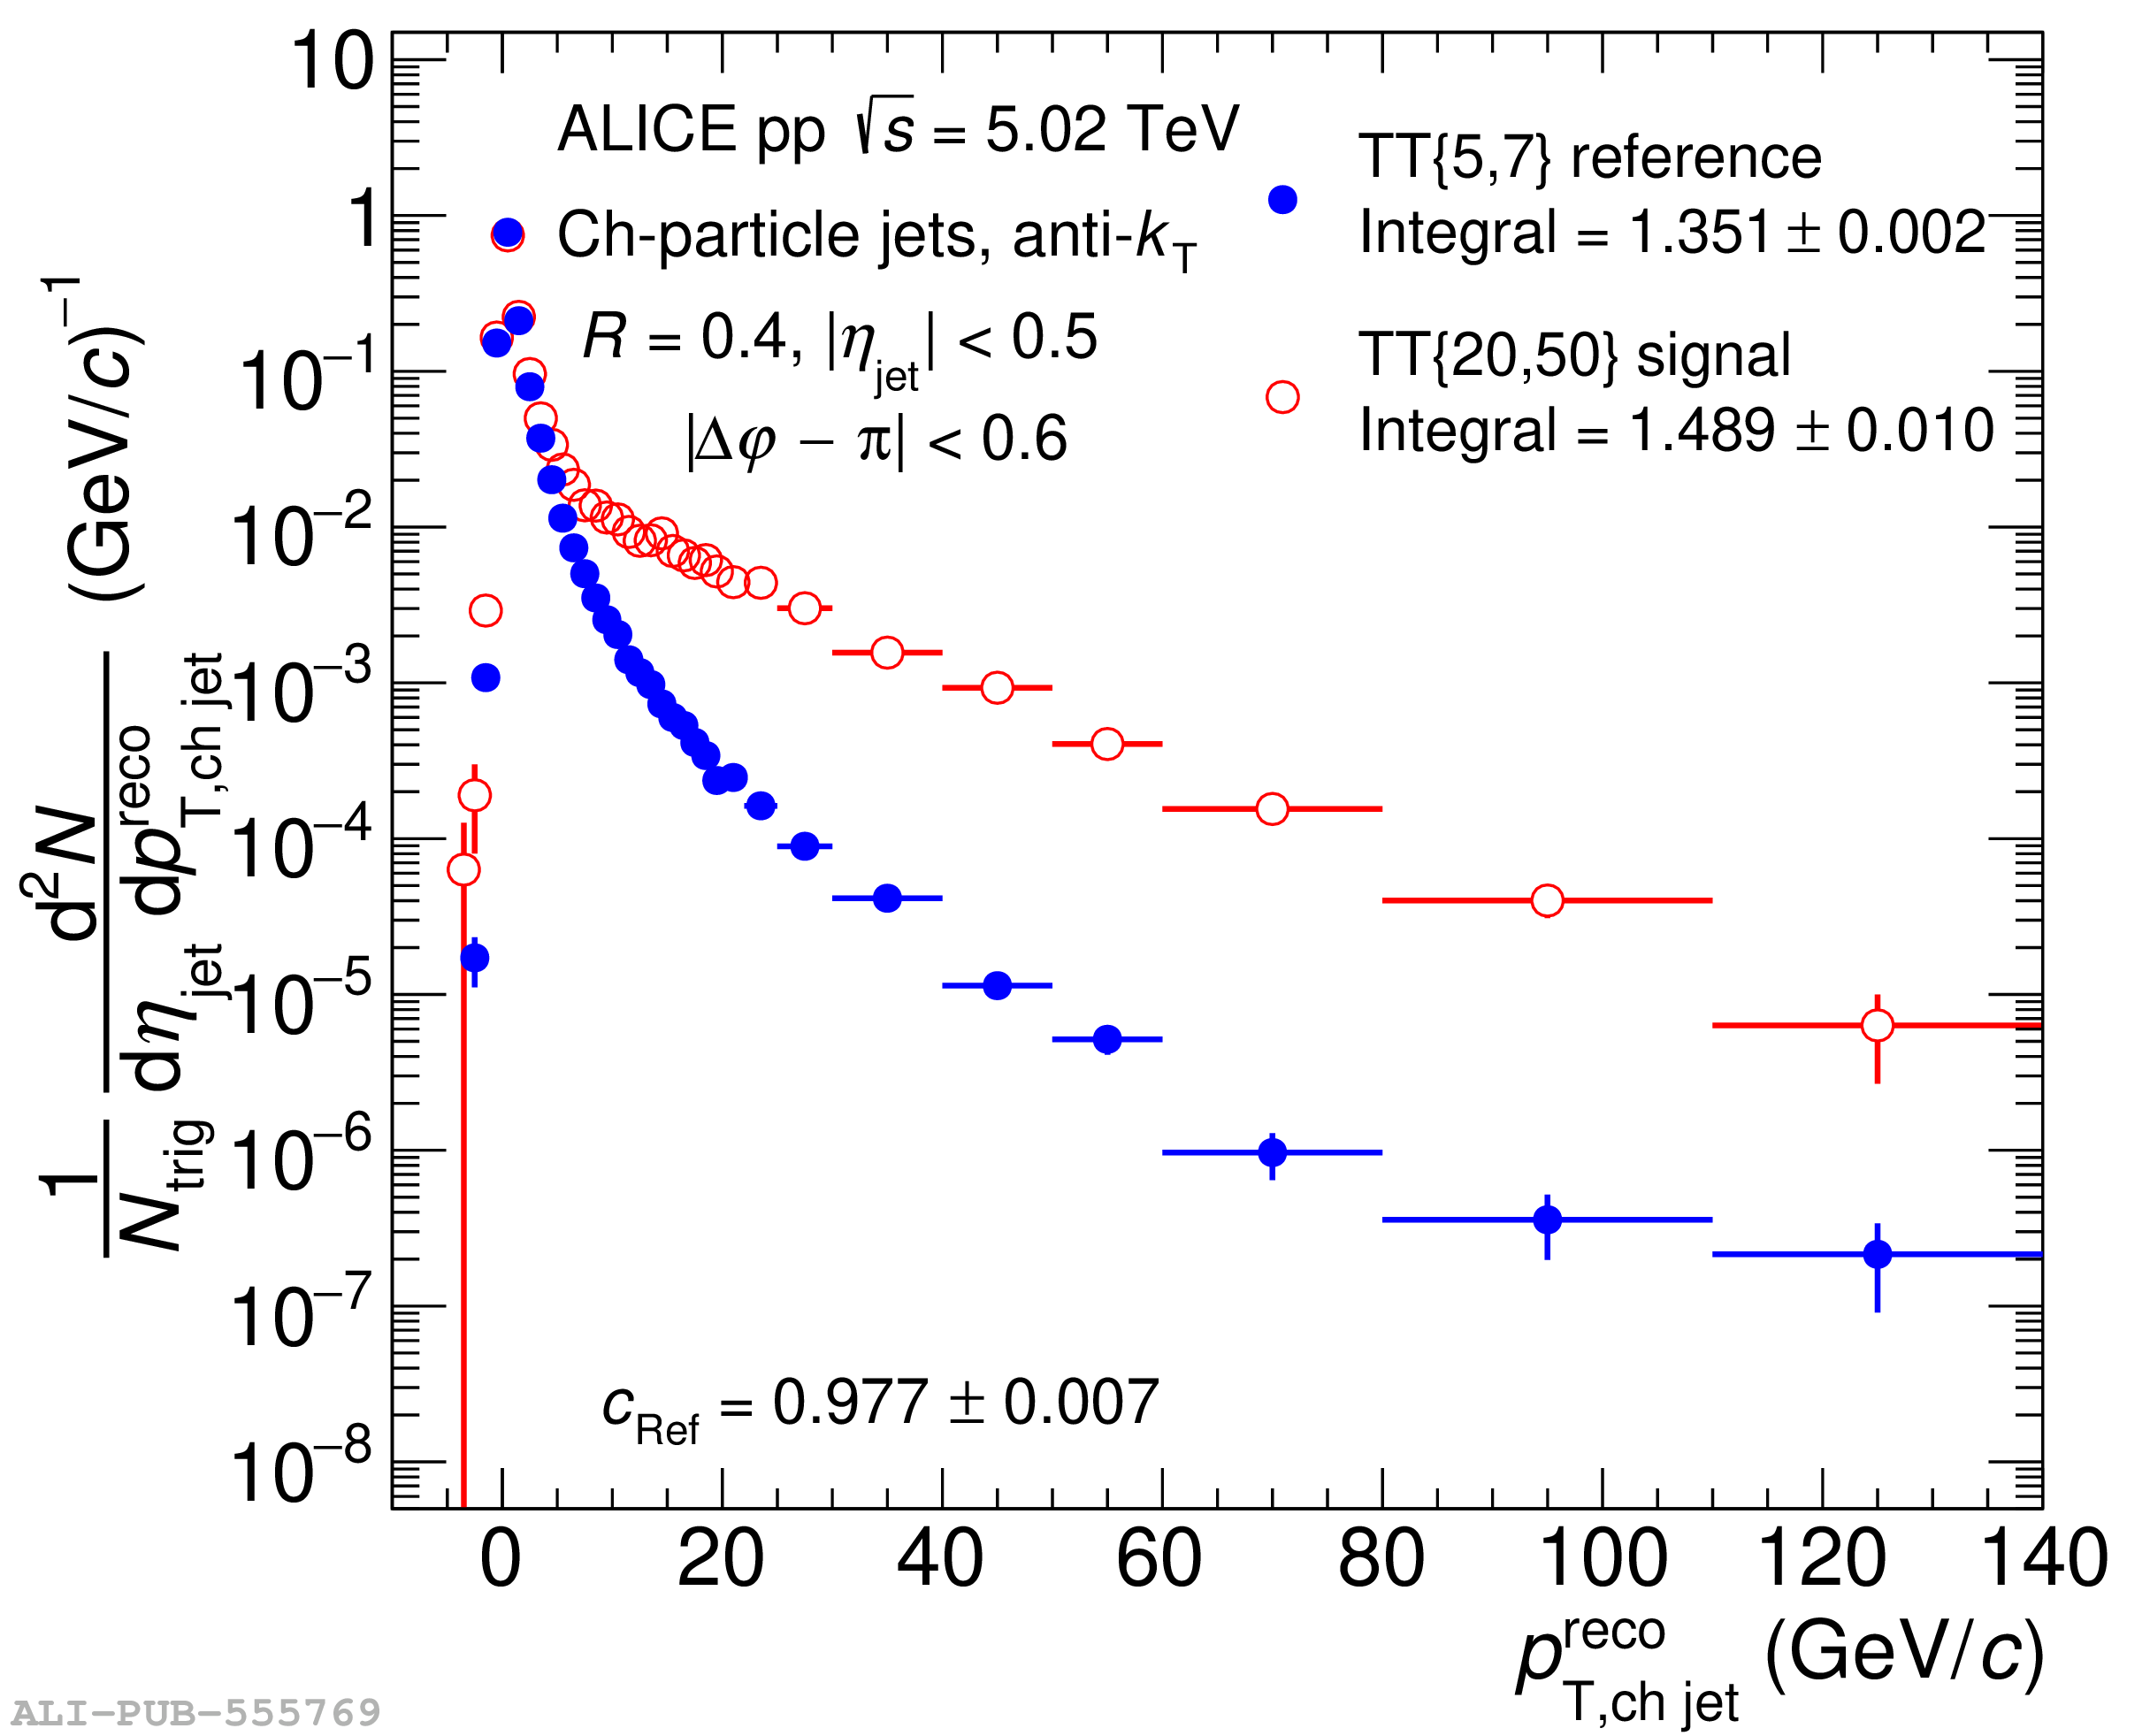 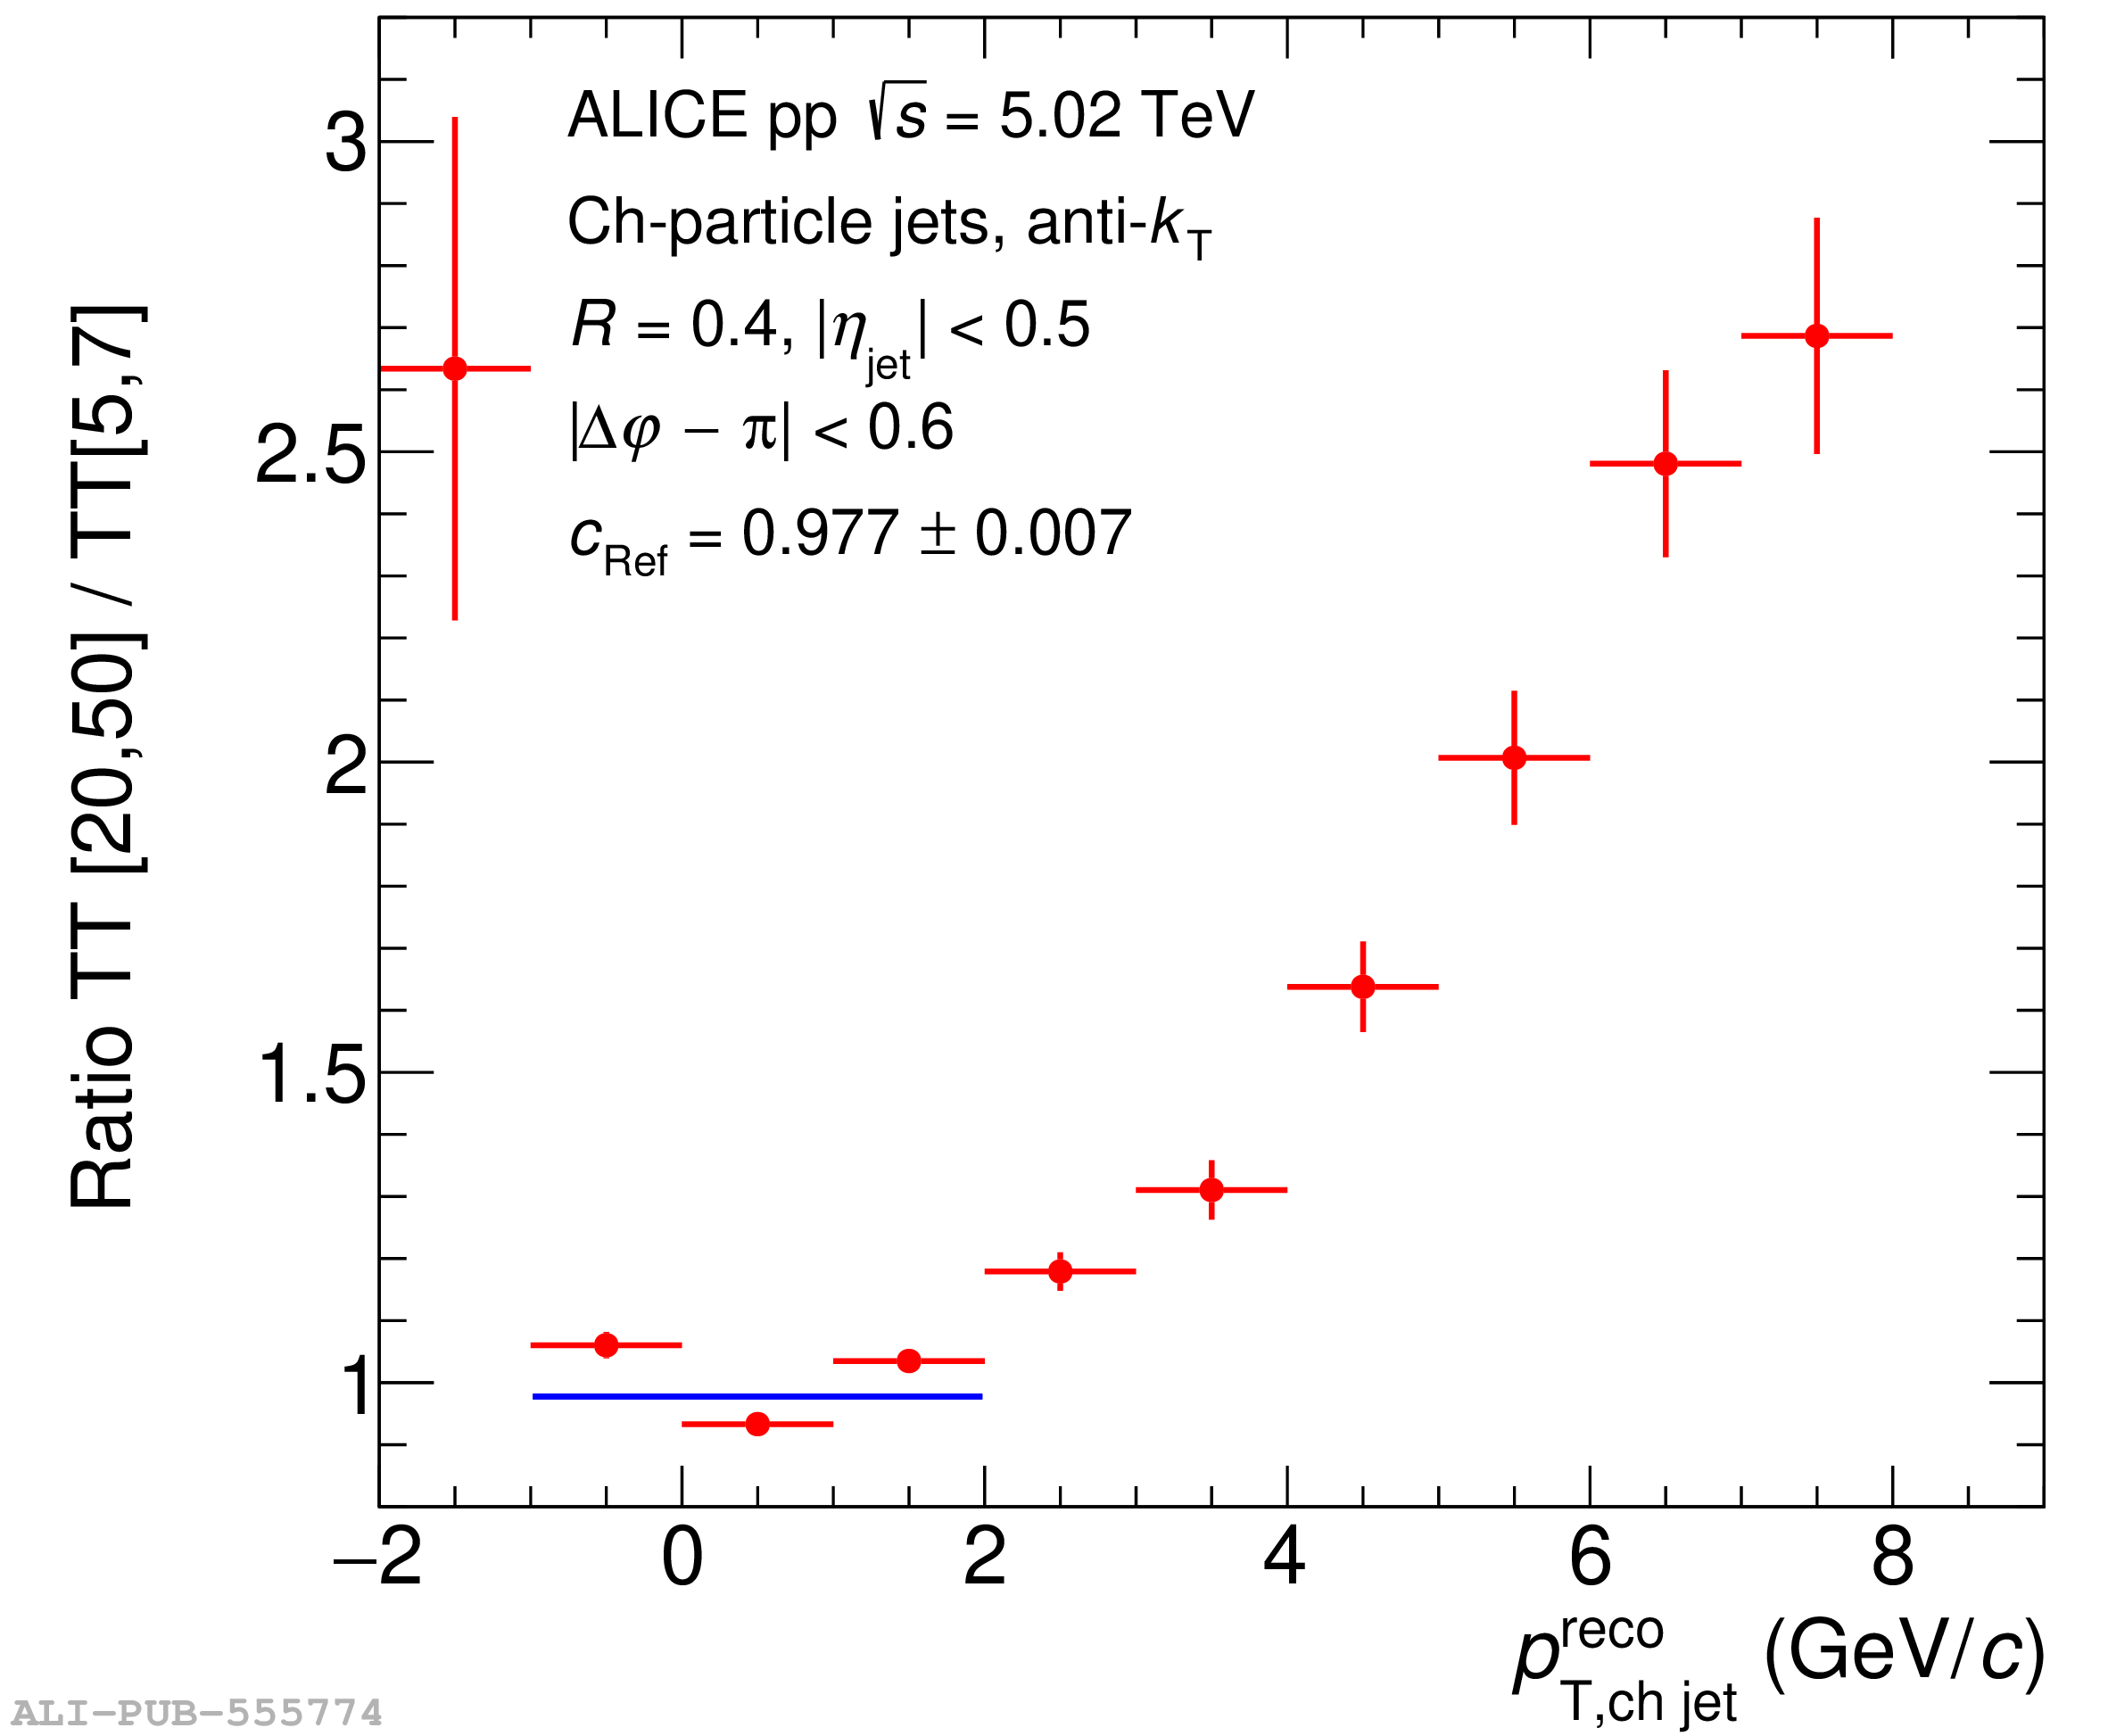 |
Figure 8
Trigger-normalized semi-inclusive recoil jet distributions for ${\rm TT_{sig}}$ and ${\rm TT_{ref}}$-selected populations in pp collisions at $\sqrts=5.02$ TeV, for $R=0.2$ (top), 0.4 (middle), and 0.5 (bottom). The ${\rm TT_{ref}}$ distribution is scaled by $c_{\rm Ref}$. The resulting $\Delta_{\rm recoil}$ distribution is also shown. Left panels: Distributions as a function of $p_{\rm T,\text{ch jet}}^{\rm reco}$ in the $\Delta\varphi$ acceptance of the $\Delta_{\rm recoil}(p_{\rm T,jet})$ analysis. Right panels: Distributions as a function of $\Delta\varphi$, for $p_{\rm T,\text{ch jet}}^{\rm reco}\in[20,30]$ GeV/$c$. ${\rm TT_{sig}}$ and ${\rm TT_{ref}}$ distributions in left middle panel are the same as in Fig. 7, left panel. | 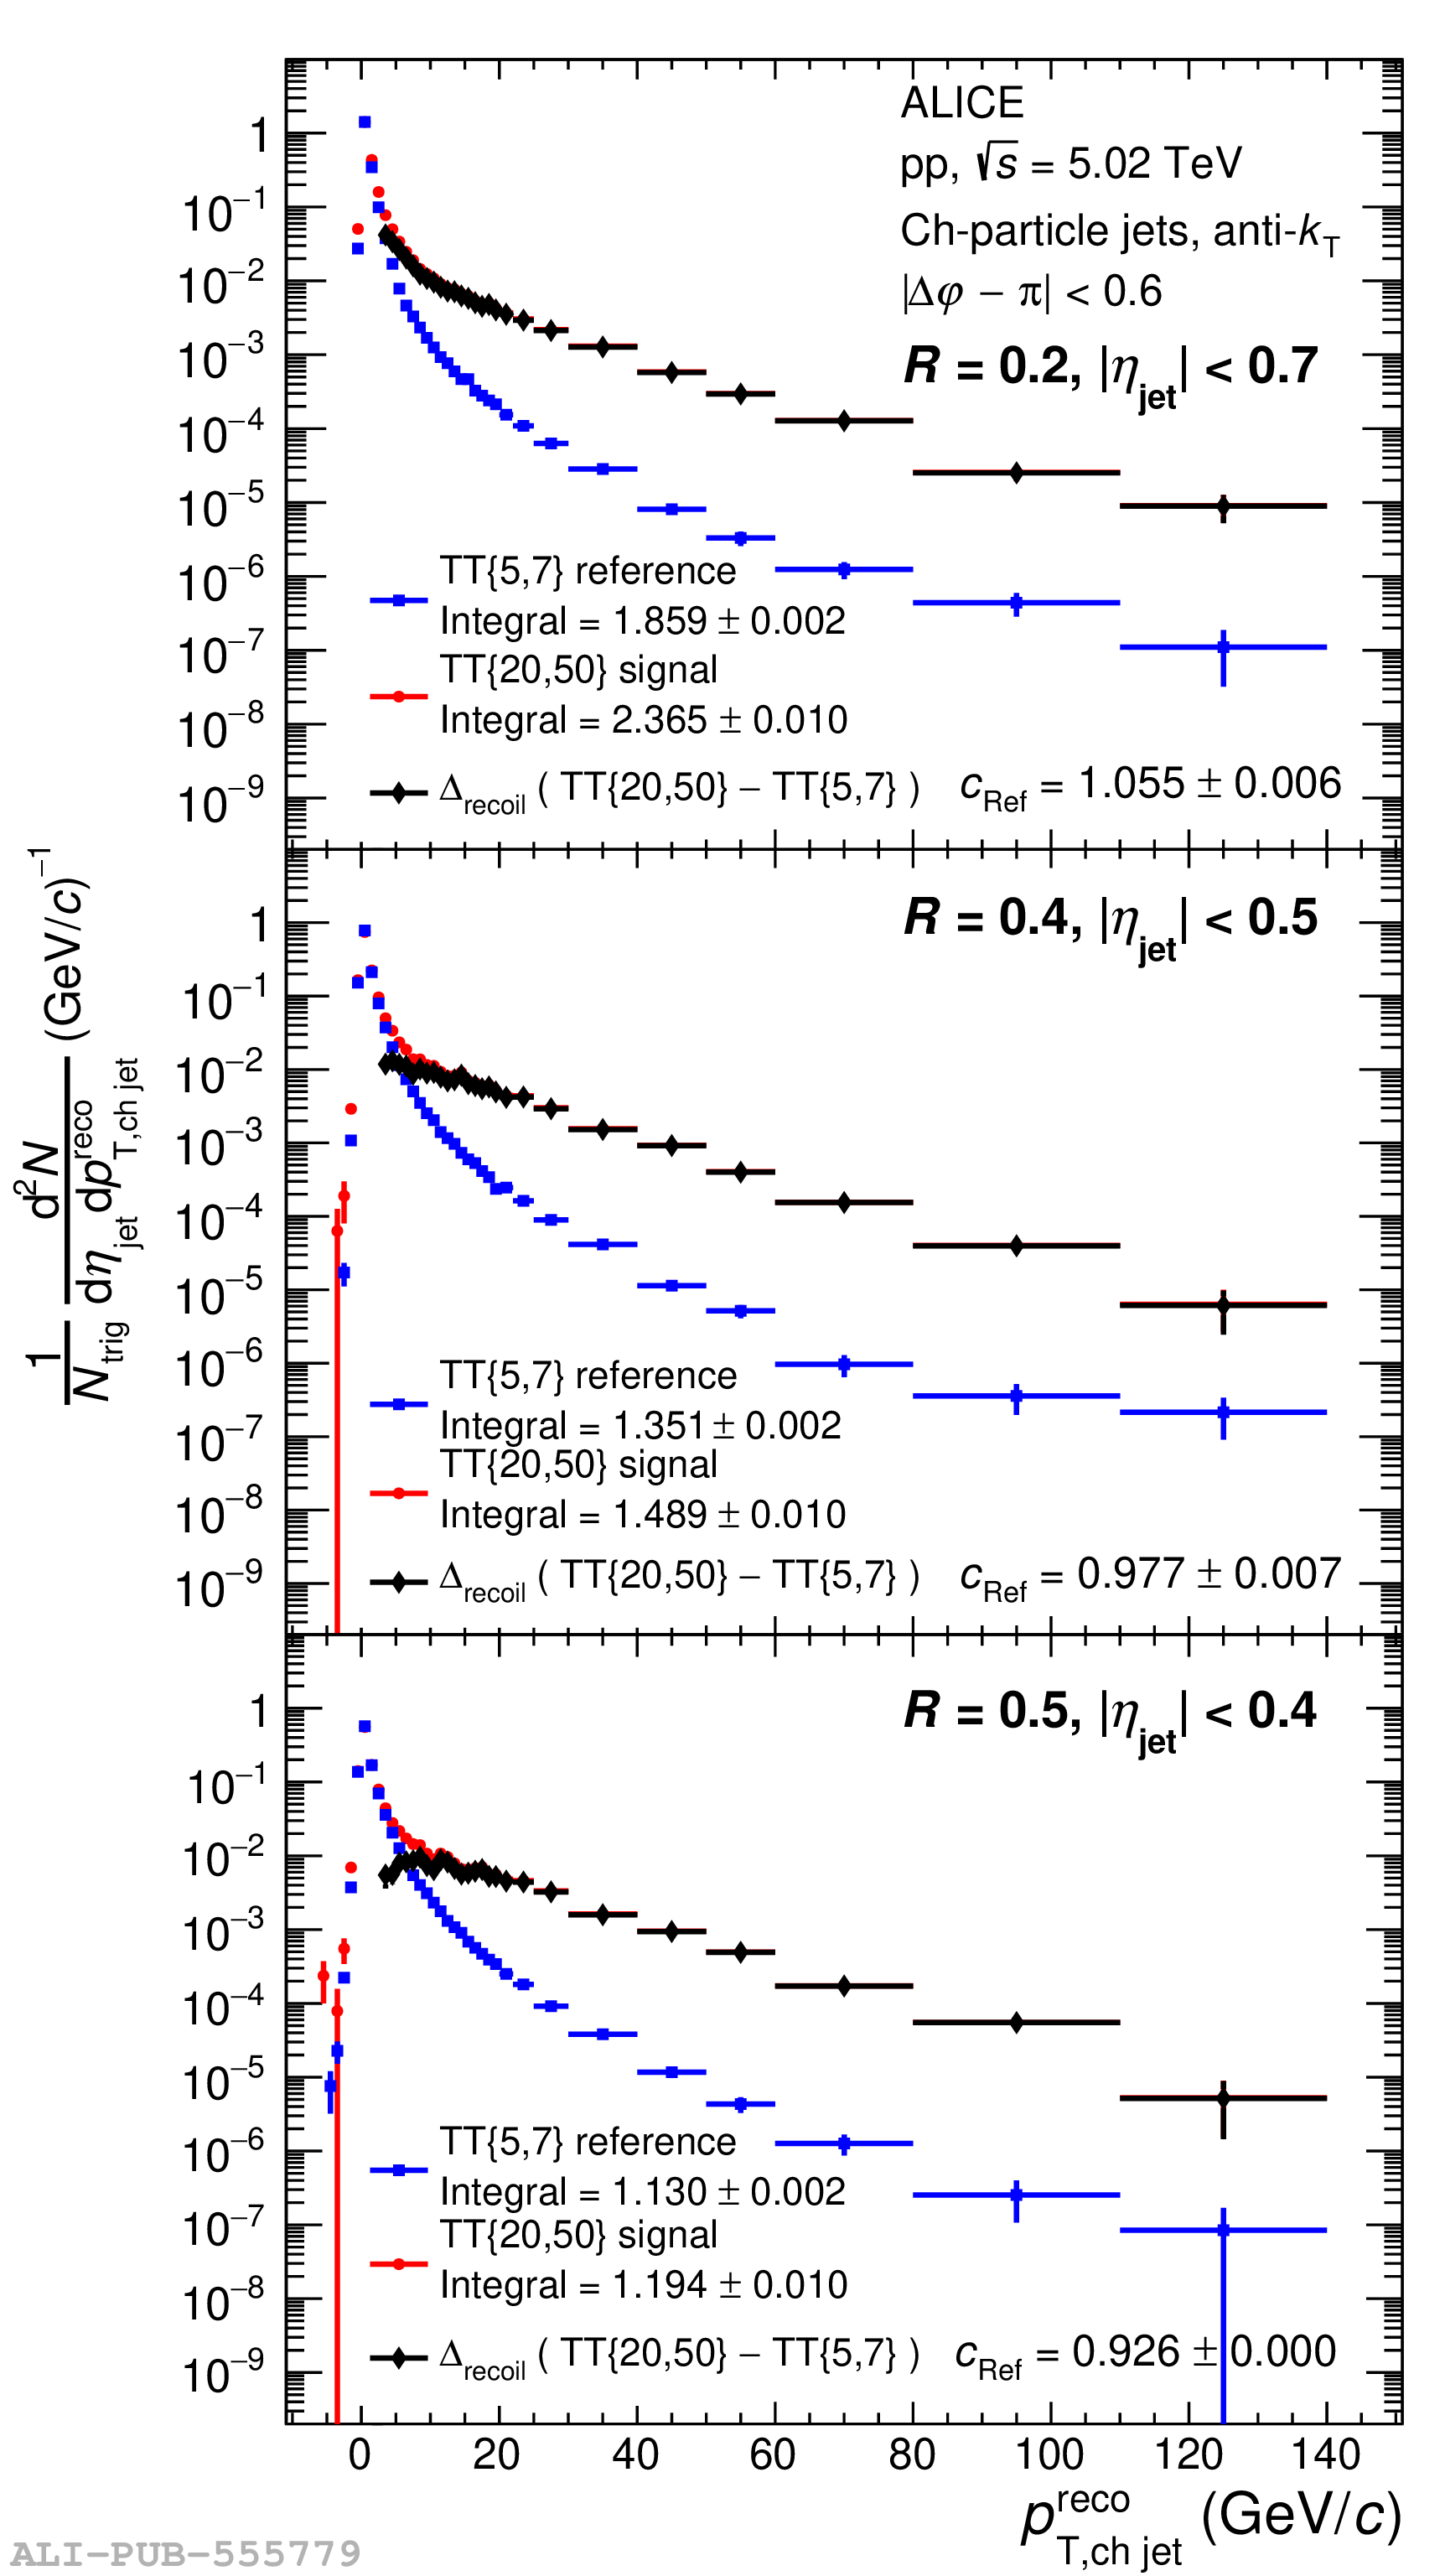 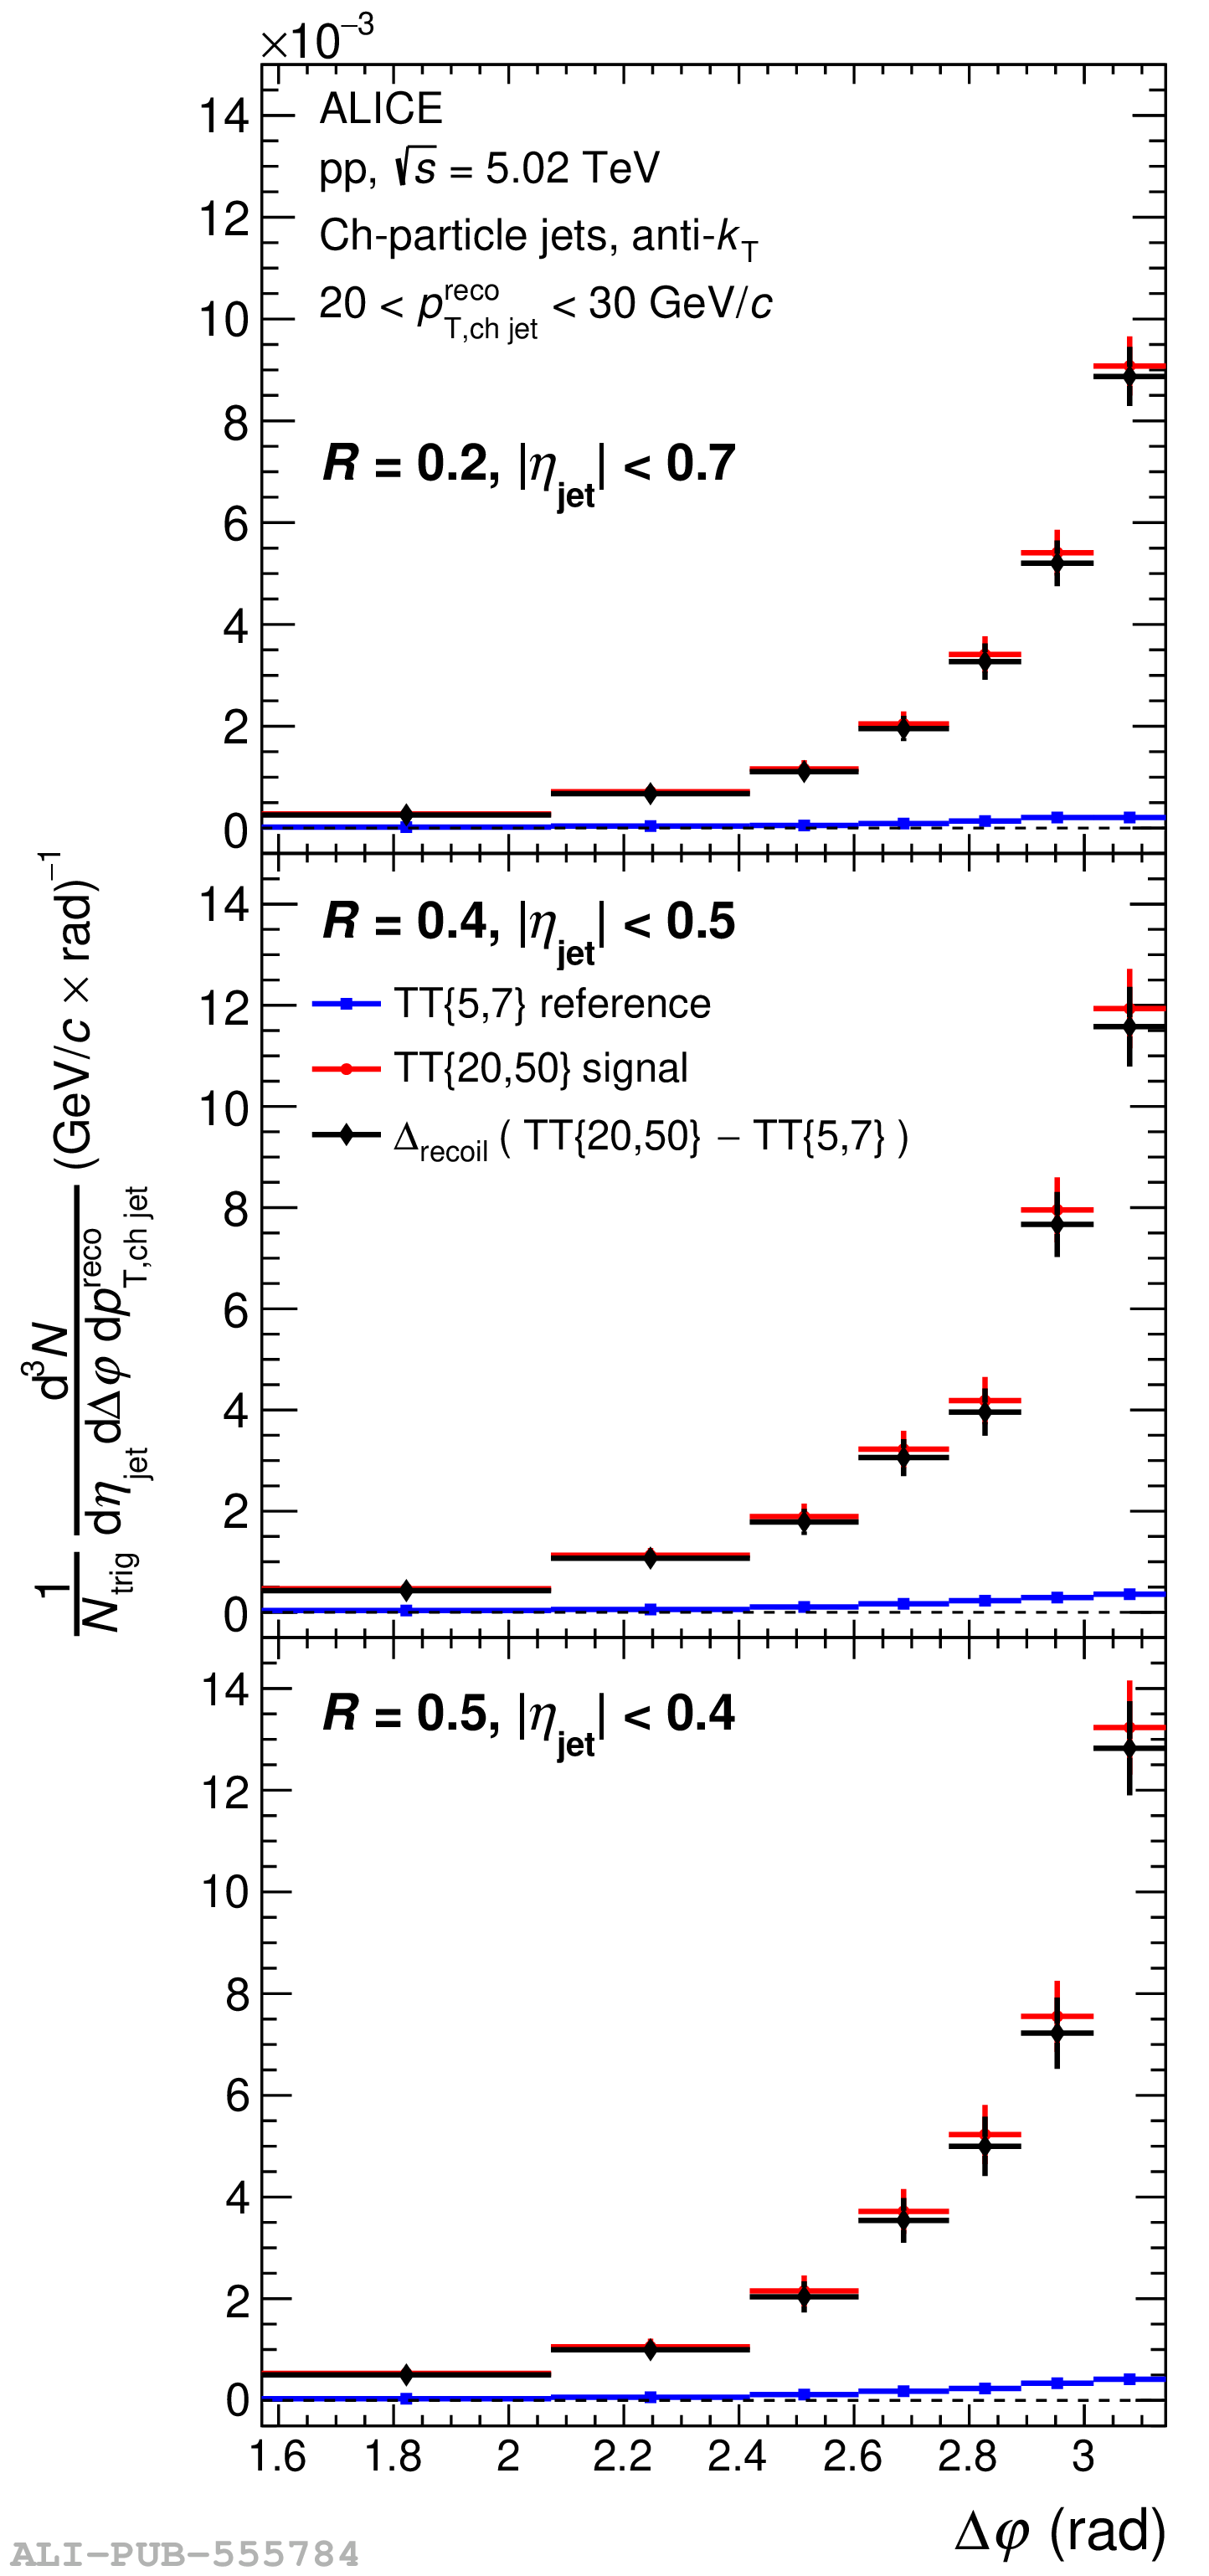 |
Figure 11
Upper panels: corrected $\Delta_{\rm recoil}(p_{\rm T,\text{ch jet}})$ distributions measured for $R=0.2$ (left), 0.4 (middle), and 0.5 (right) in pp collisions at $\sqrts=5.02$ TeV, compared to calculations from JETSCAPE, JEWEL, PYTHIA8, and POWHEG . Lower panels: ratio of the data and calculations to a functional fit of the measured $\Delta_{\rm recoil}(p_{\rm T,\text{ch jet}})$ distributions. | 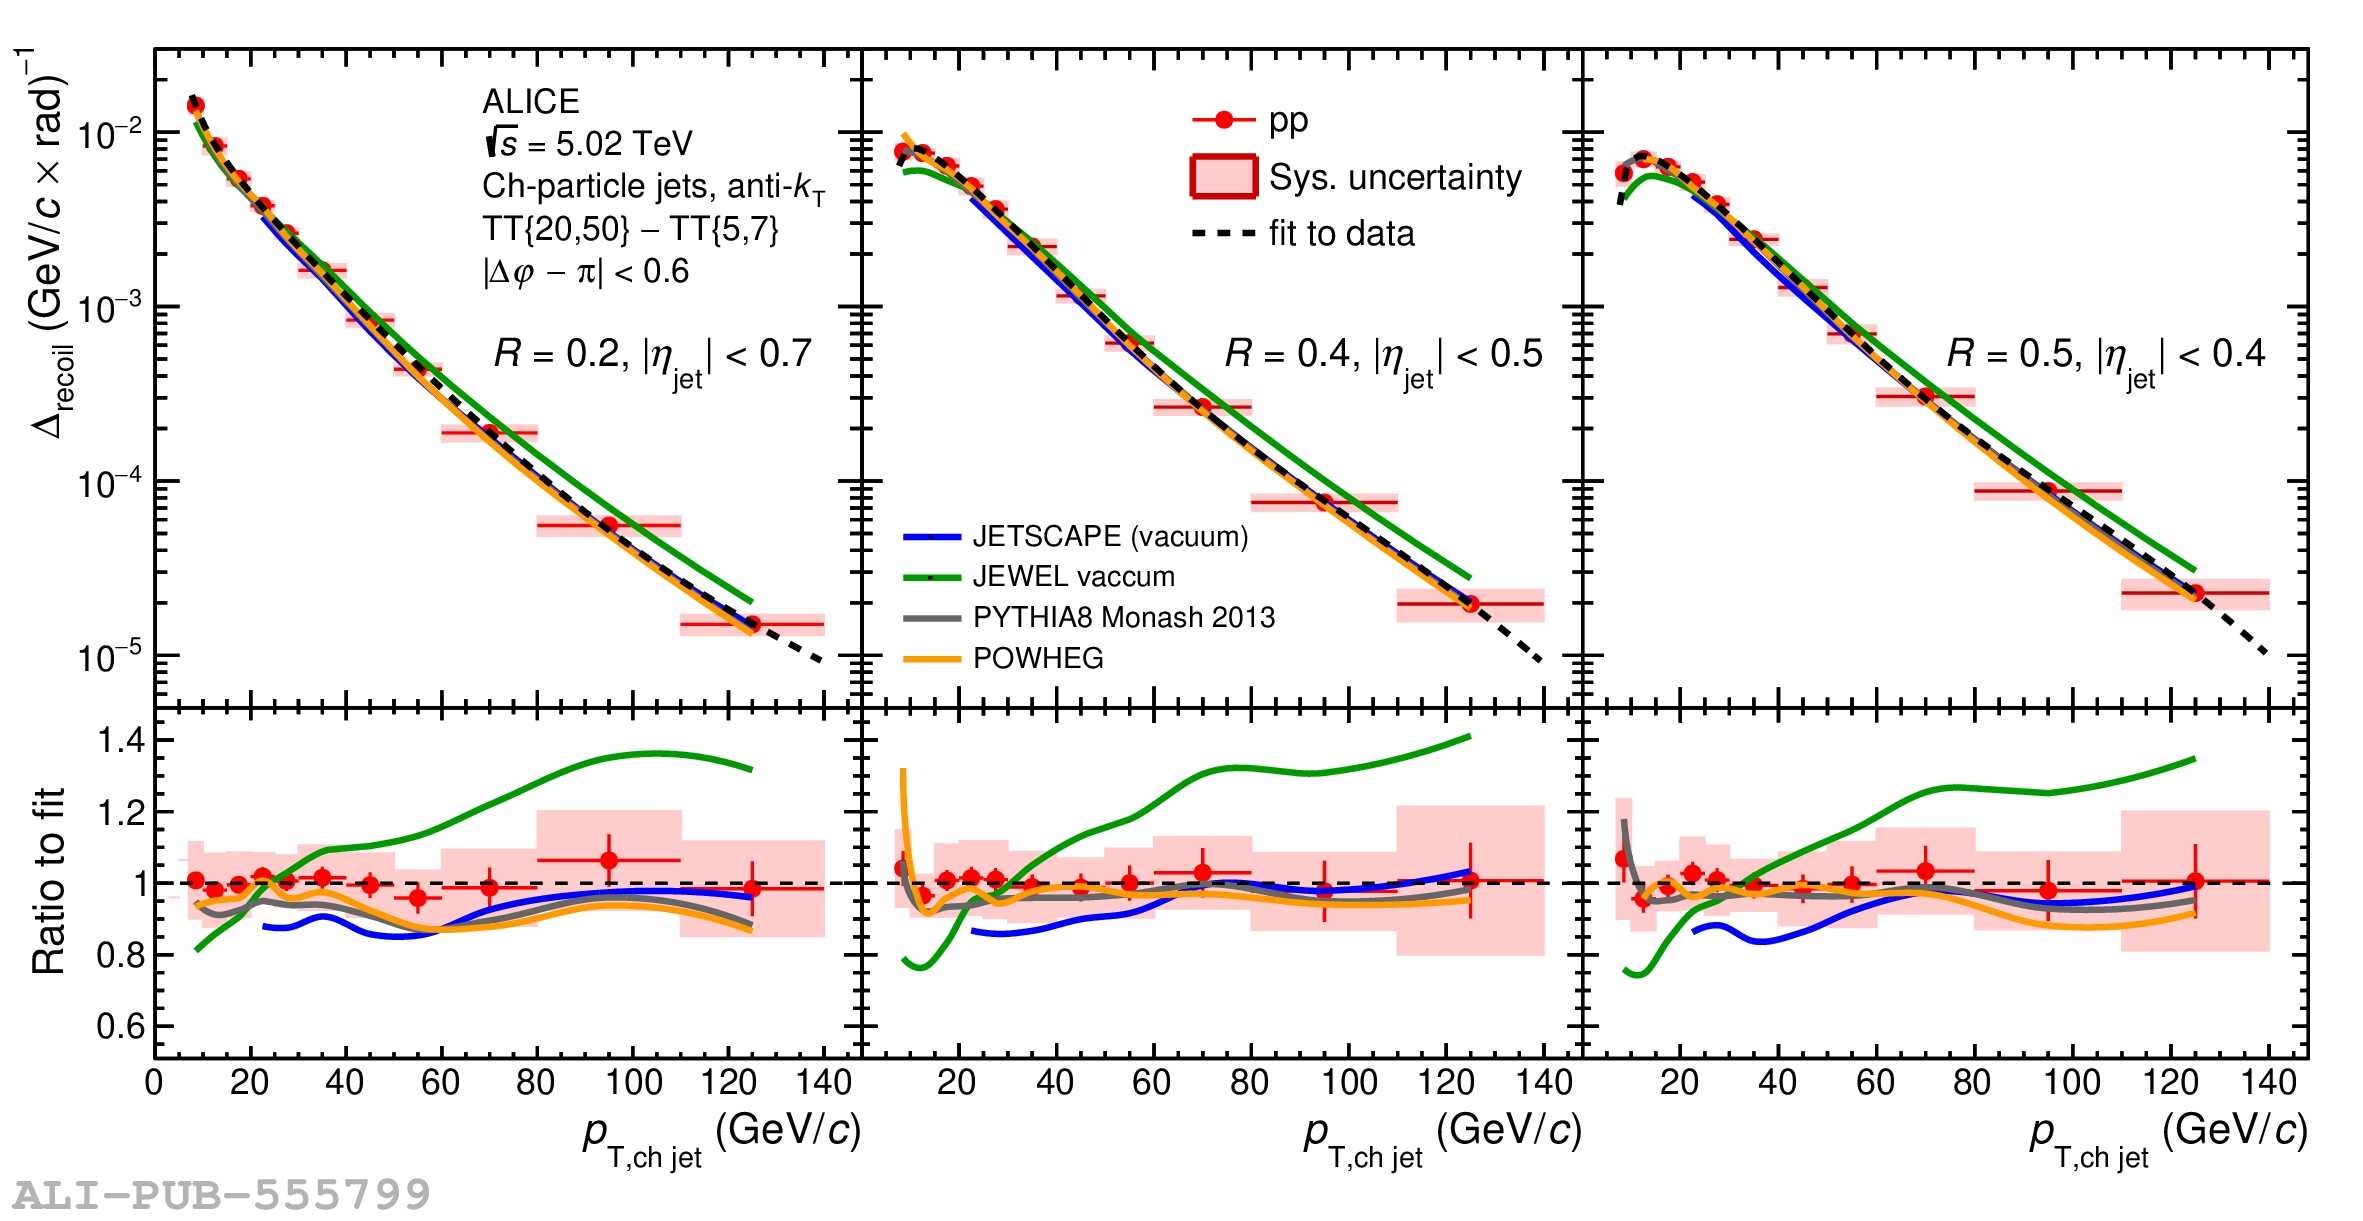 |
Figure 12
Corrected $\Delta_{\rm recoil}(\Delta\varphi)$ distributions for pp collisions at $\sqrts=5.02$ TeV for $R=0.2$ (top), 0.4 (middle), and 0.5 (bottom) in $p_{\rm T,\text{ch jet}}$ bins (left to right): [10,20], [20,30], [30,50], and [50,100] GeV/$c$. JETSCAPE, JEWEL, PYTHIA8, and POWHEG calculations are also shown Upper sub-panels show the individual distributions, while lower sub-panels show their ratio to a functional fit of the measured data. | 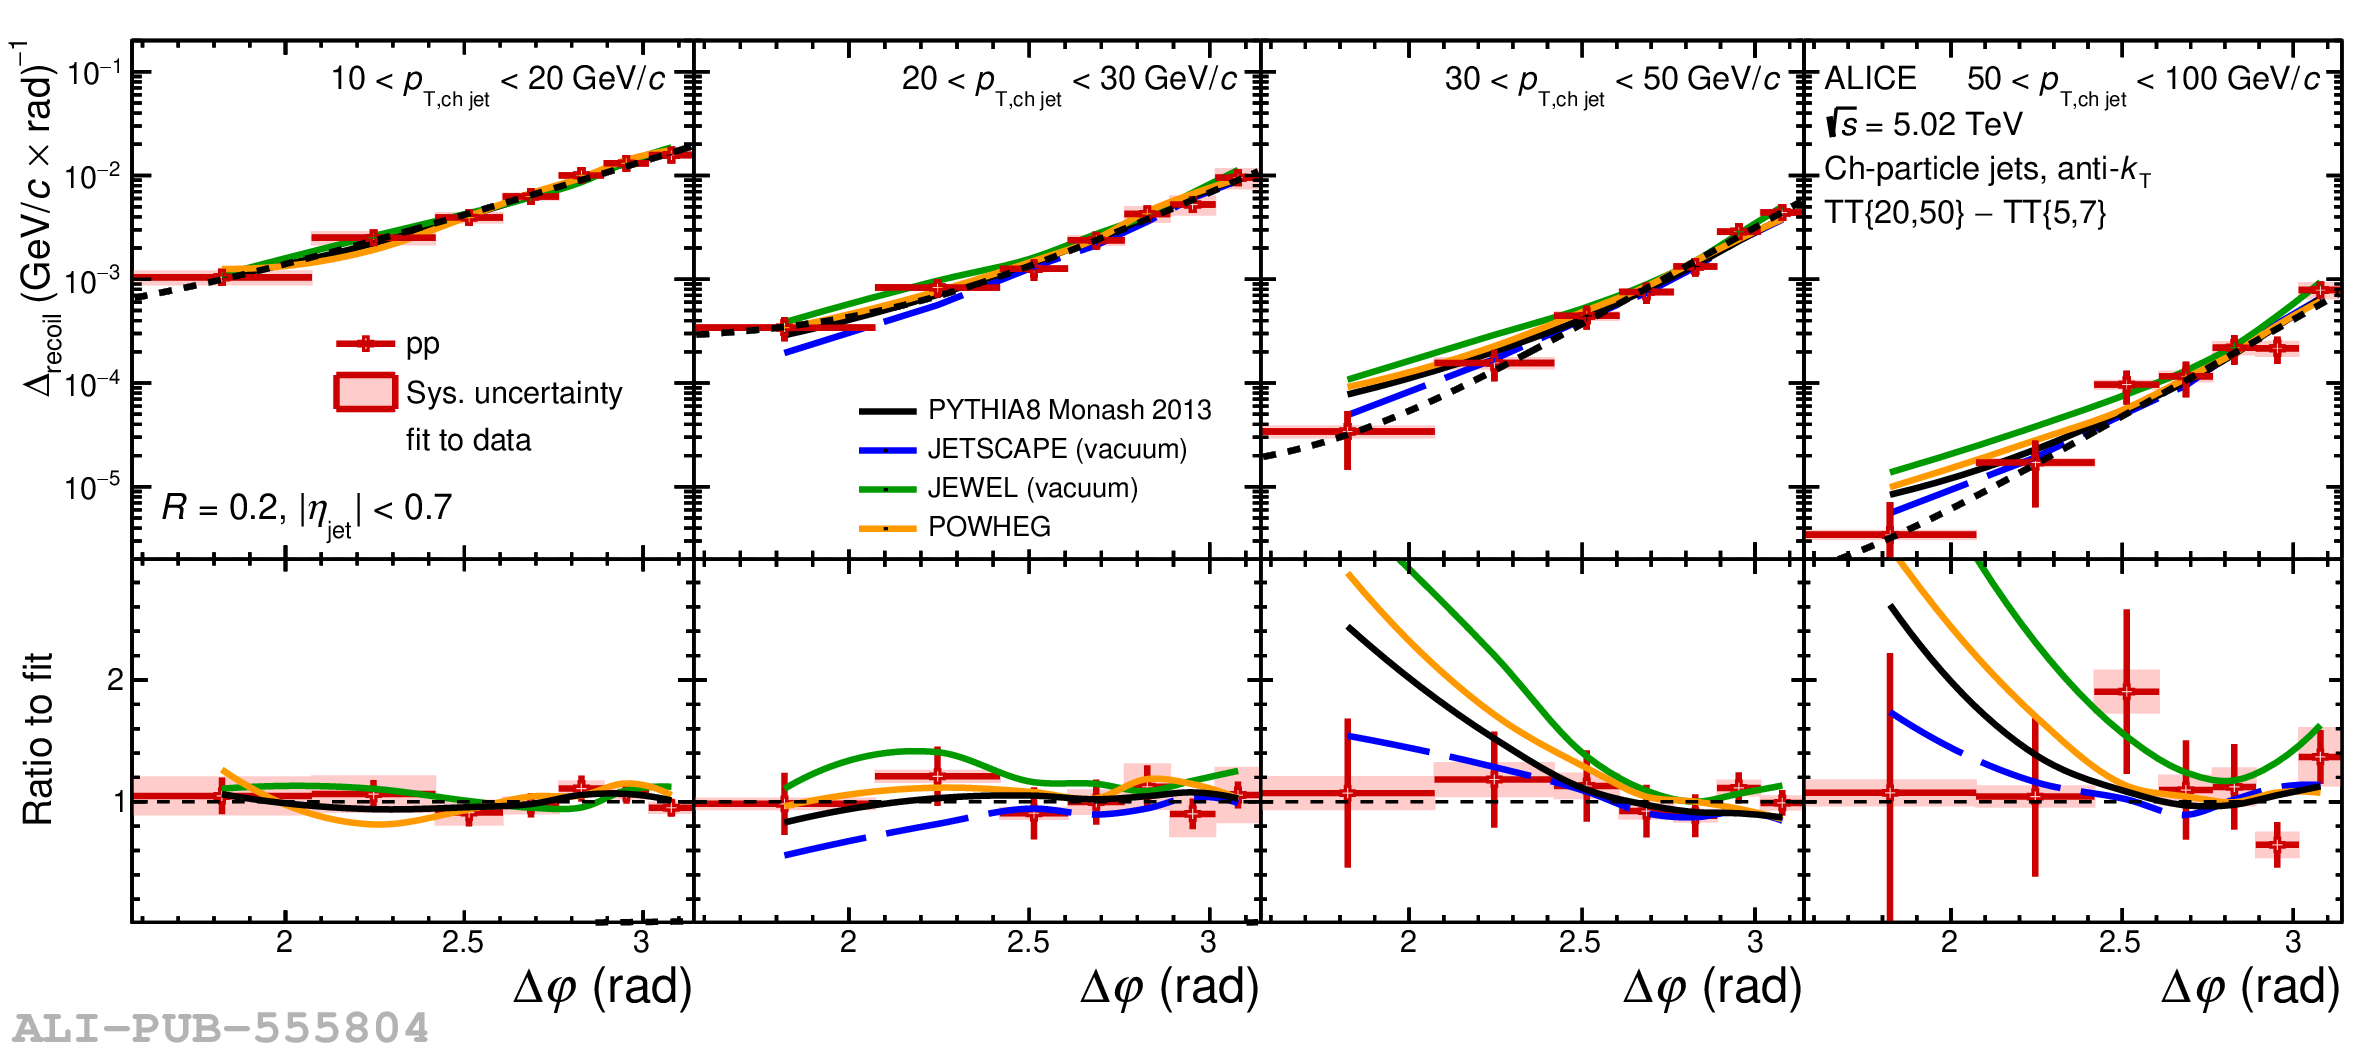 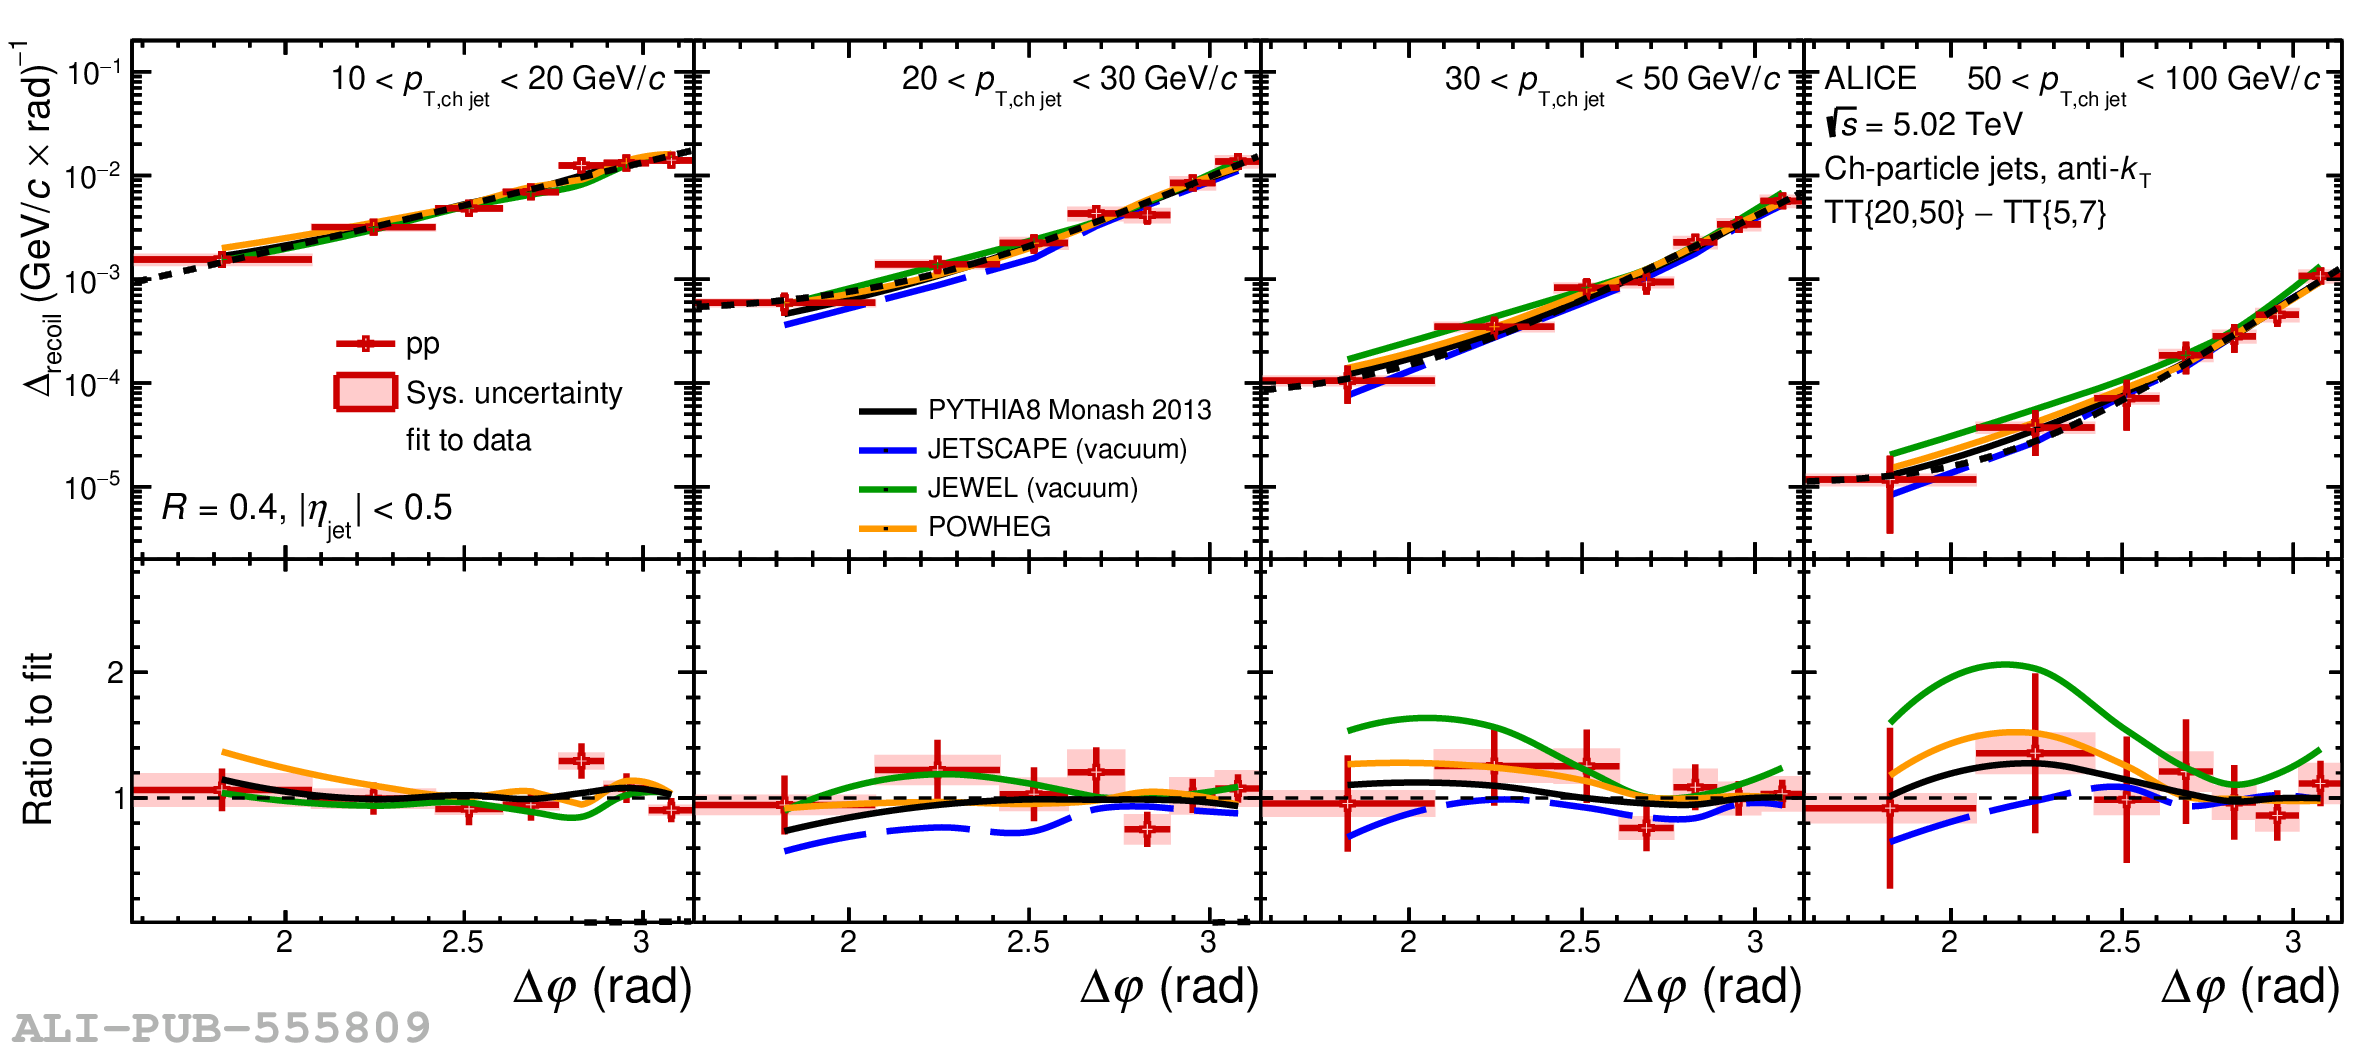 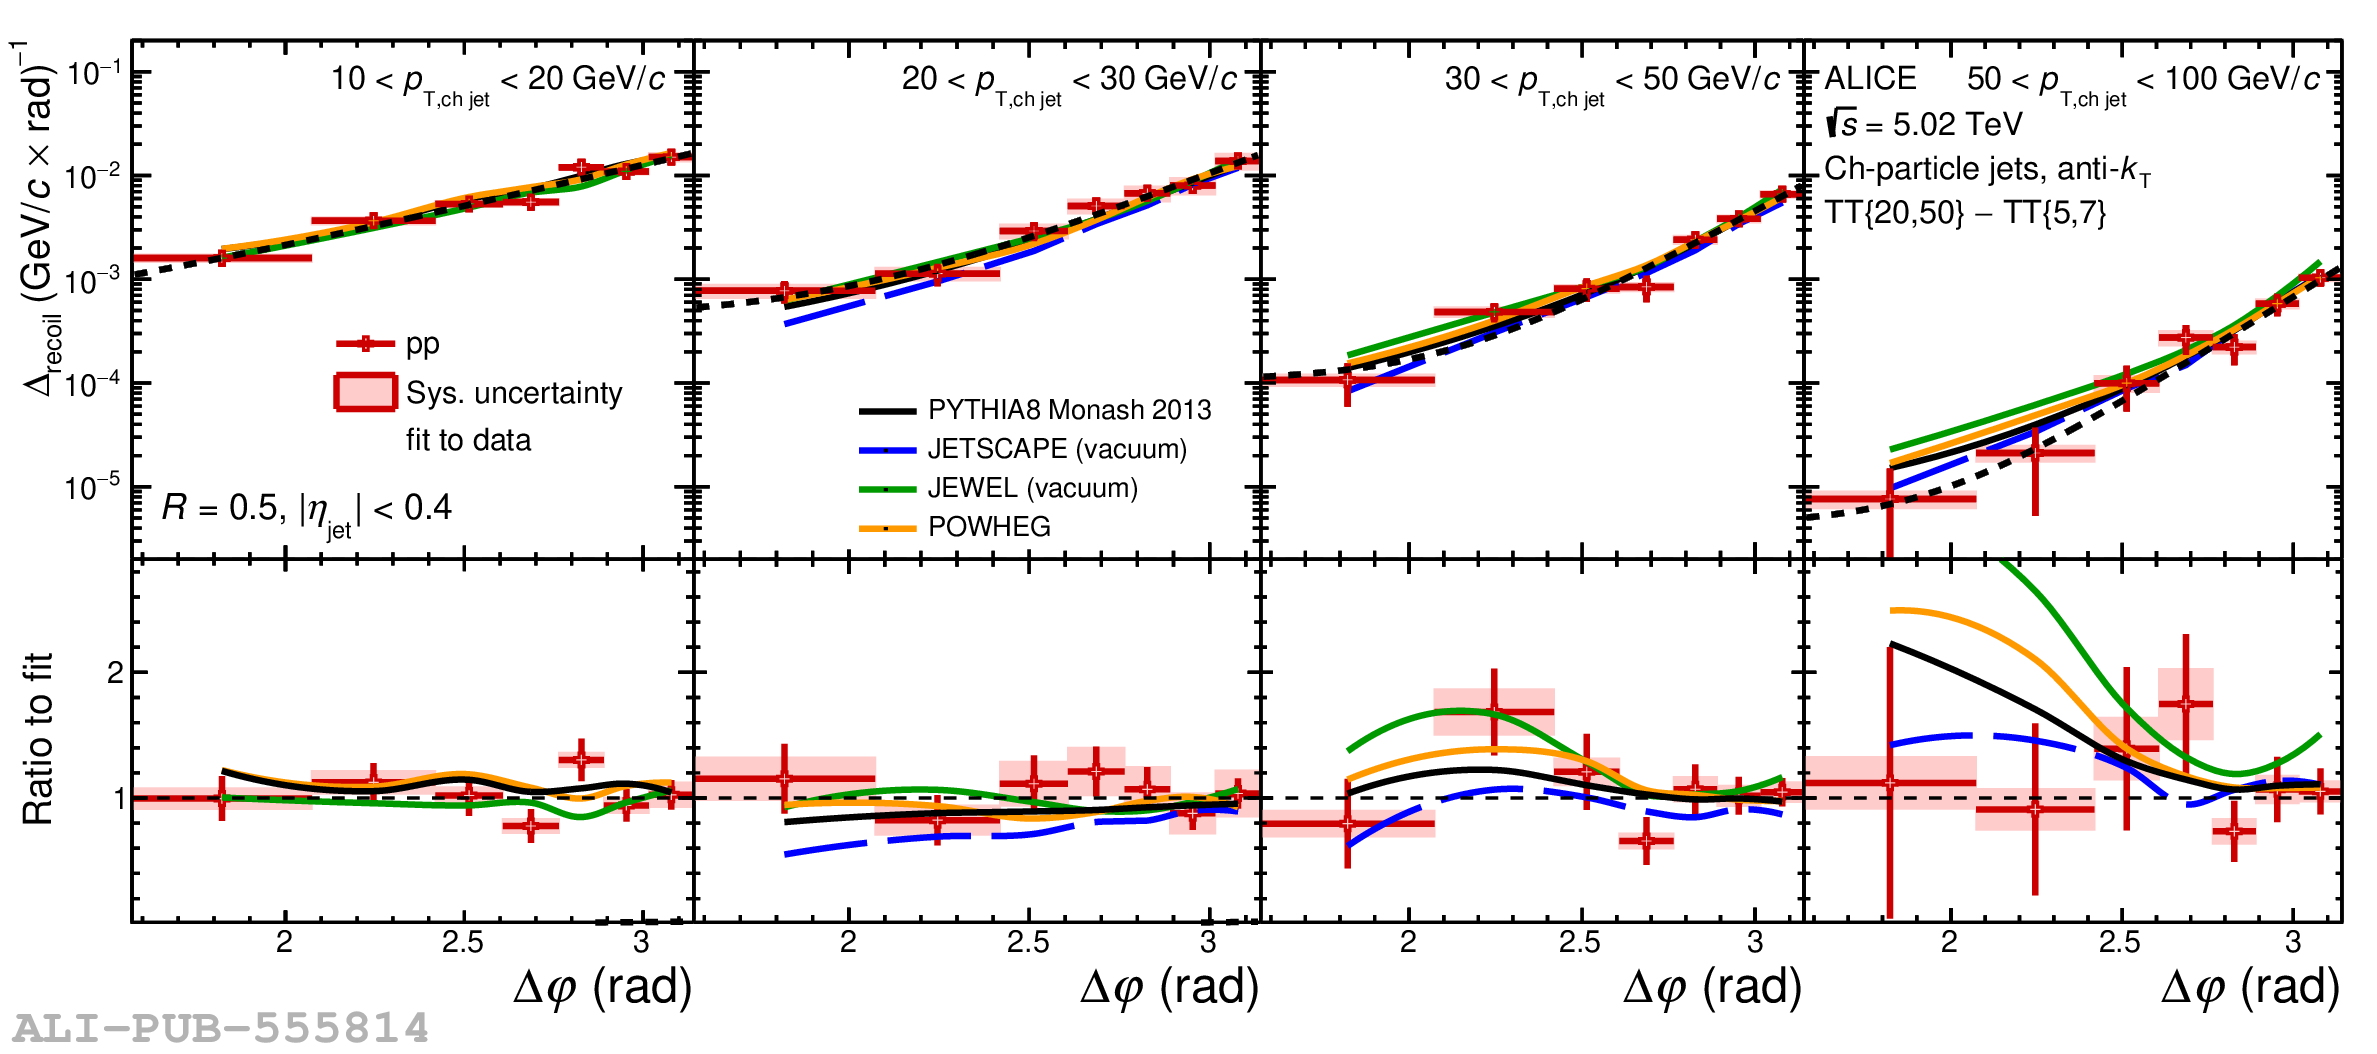 |
Figure 13
Upper panels: corrected $\Delta_{\rm recoil}(p_{\rm T,\text{ch jet}})$ distributions measured for $R=0.2$ (left), 0.4 (middle), and 0.5 (right) in Pb$-$Pb collisions at $\sqrtsNN=5.02$ TeV, compared to theoretical calculations from JETSCAPE and JEWEL. Lower panels: ratio of the data and calculations to a functional fit of the measured $\Delta_{\rm recoil}(p_{\rm T,\text{ch jet}})$ distributions. | 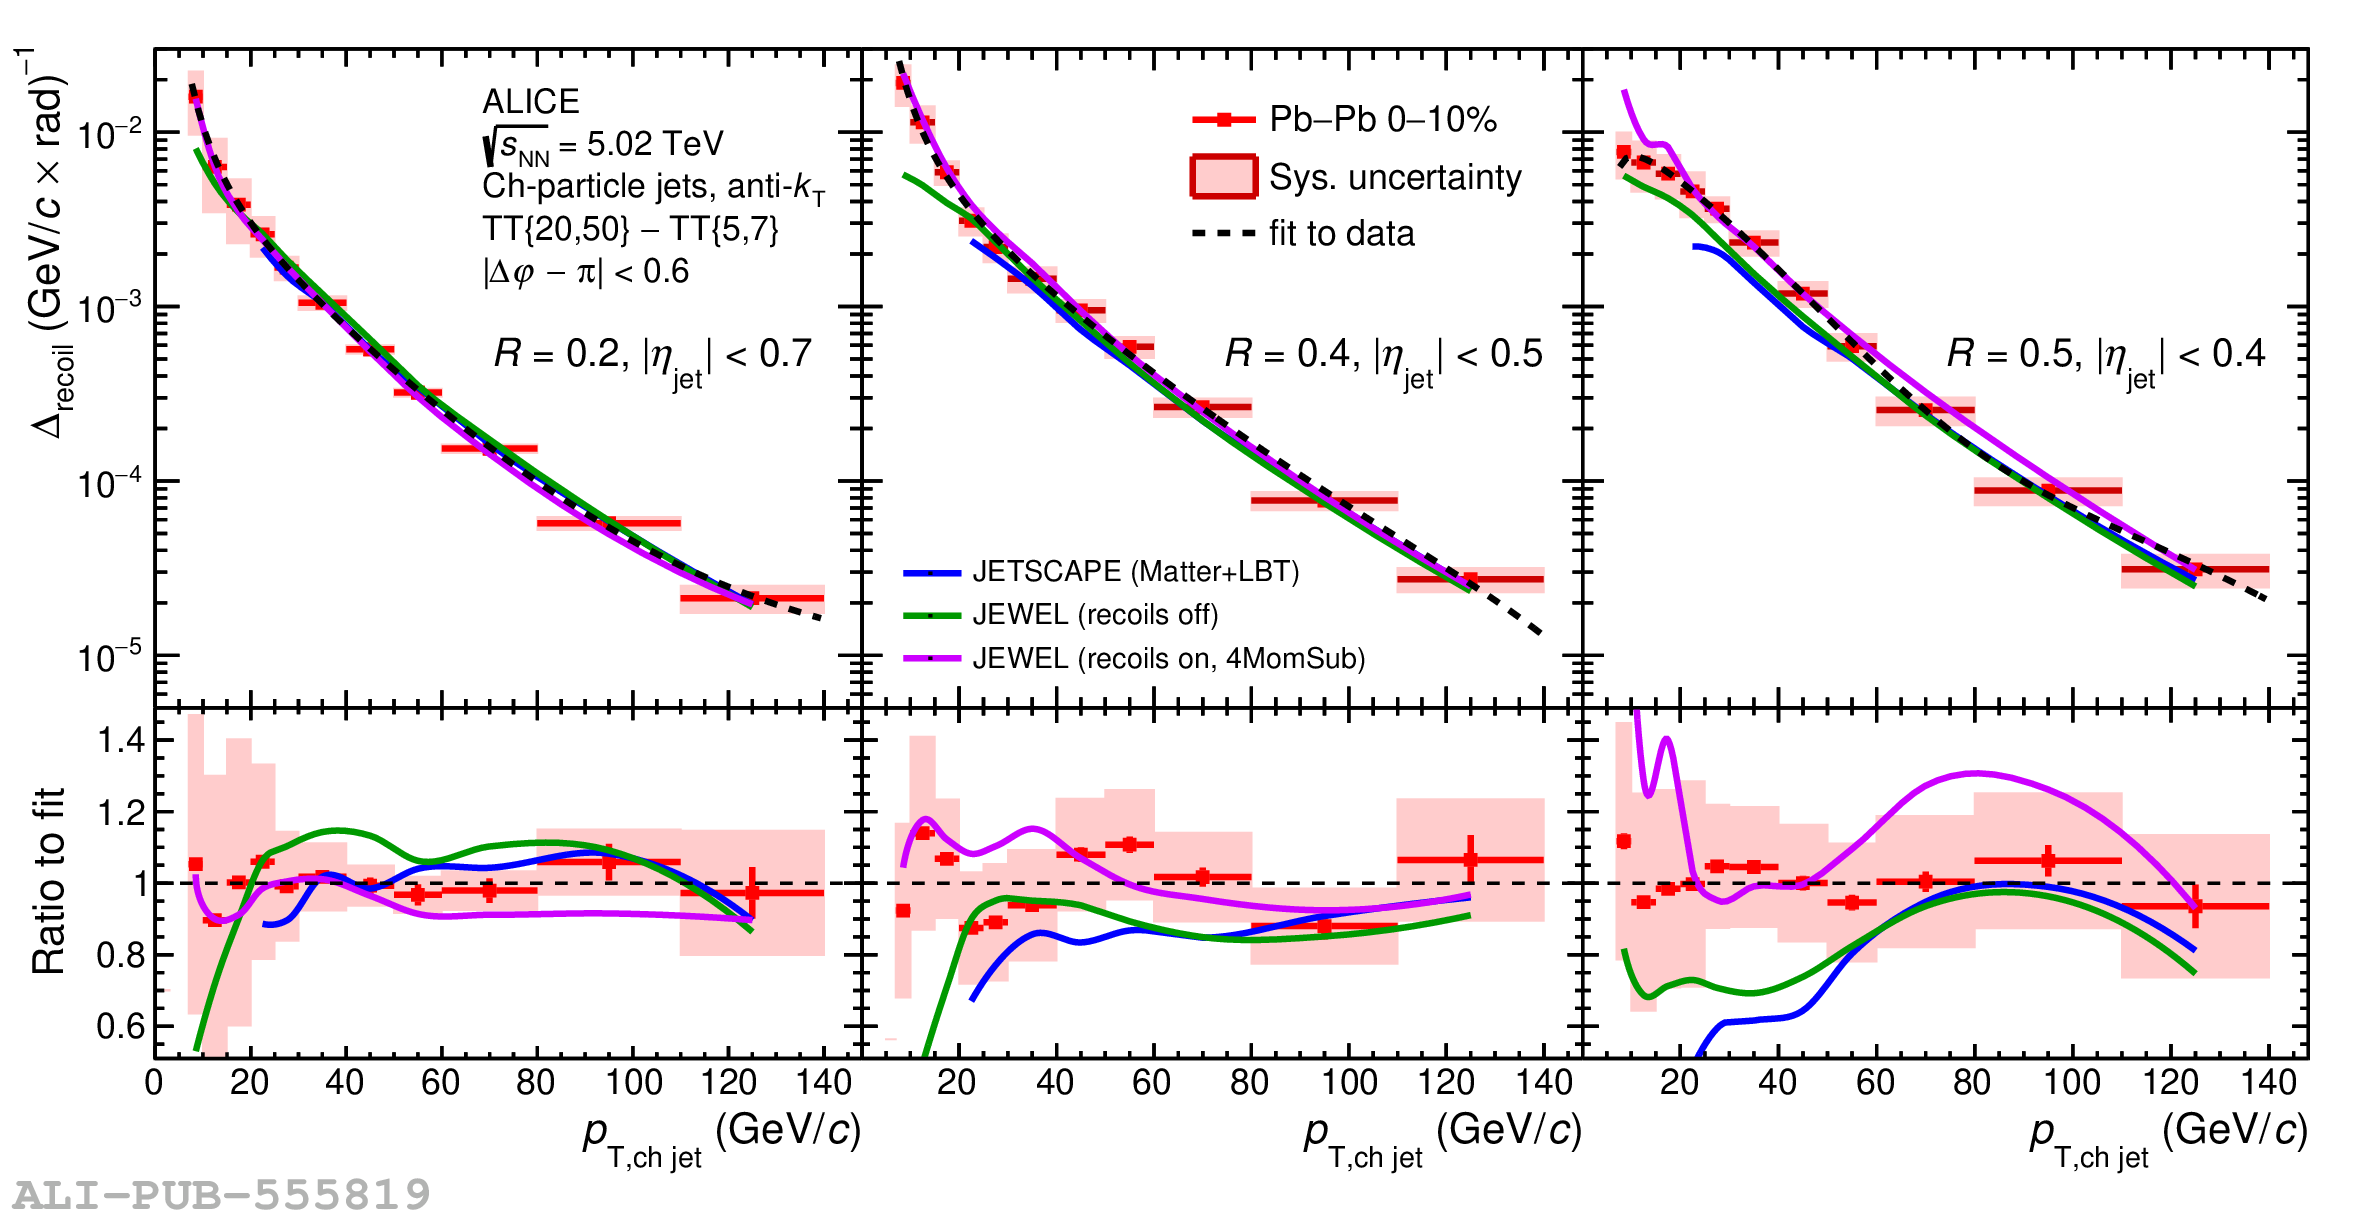 |
Figure 14
Corrected $\Delta_{\rm recoil}(\Delta\varphi)$ distributions for Pb$-$Pb collisions at $\sqrtsNN=5.02$ TeV, for $R=0.2$ (top), 0.4 (middle), and 0.5 (bottom) in $p_{\rm T,\text{ch jet}}$ bins (left to right): [10,20], [20,30], [30,50], and [50,100] GeV/$c$. JETSCAPE and JEWEL calculations are also shown. Upper sub-panels show the individual distributions, while lower sub-panels show their ratio to a functional fit of the data. | 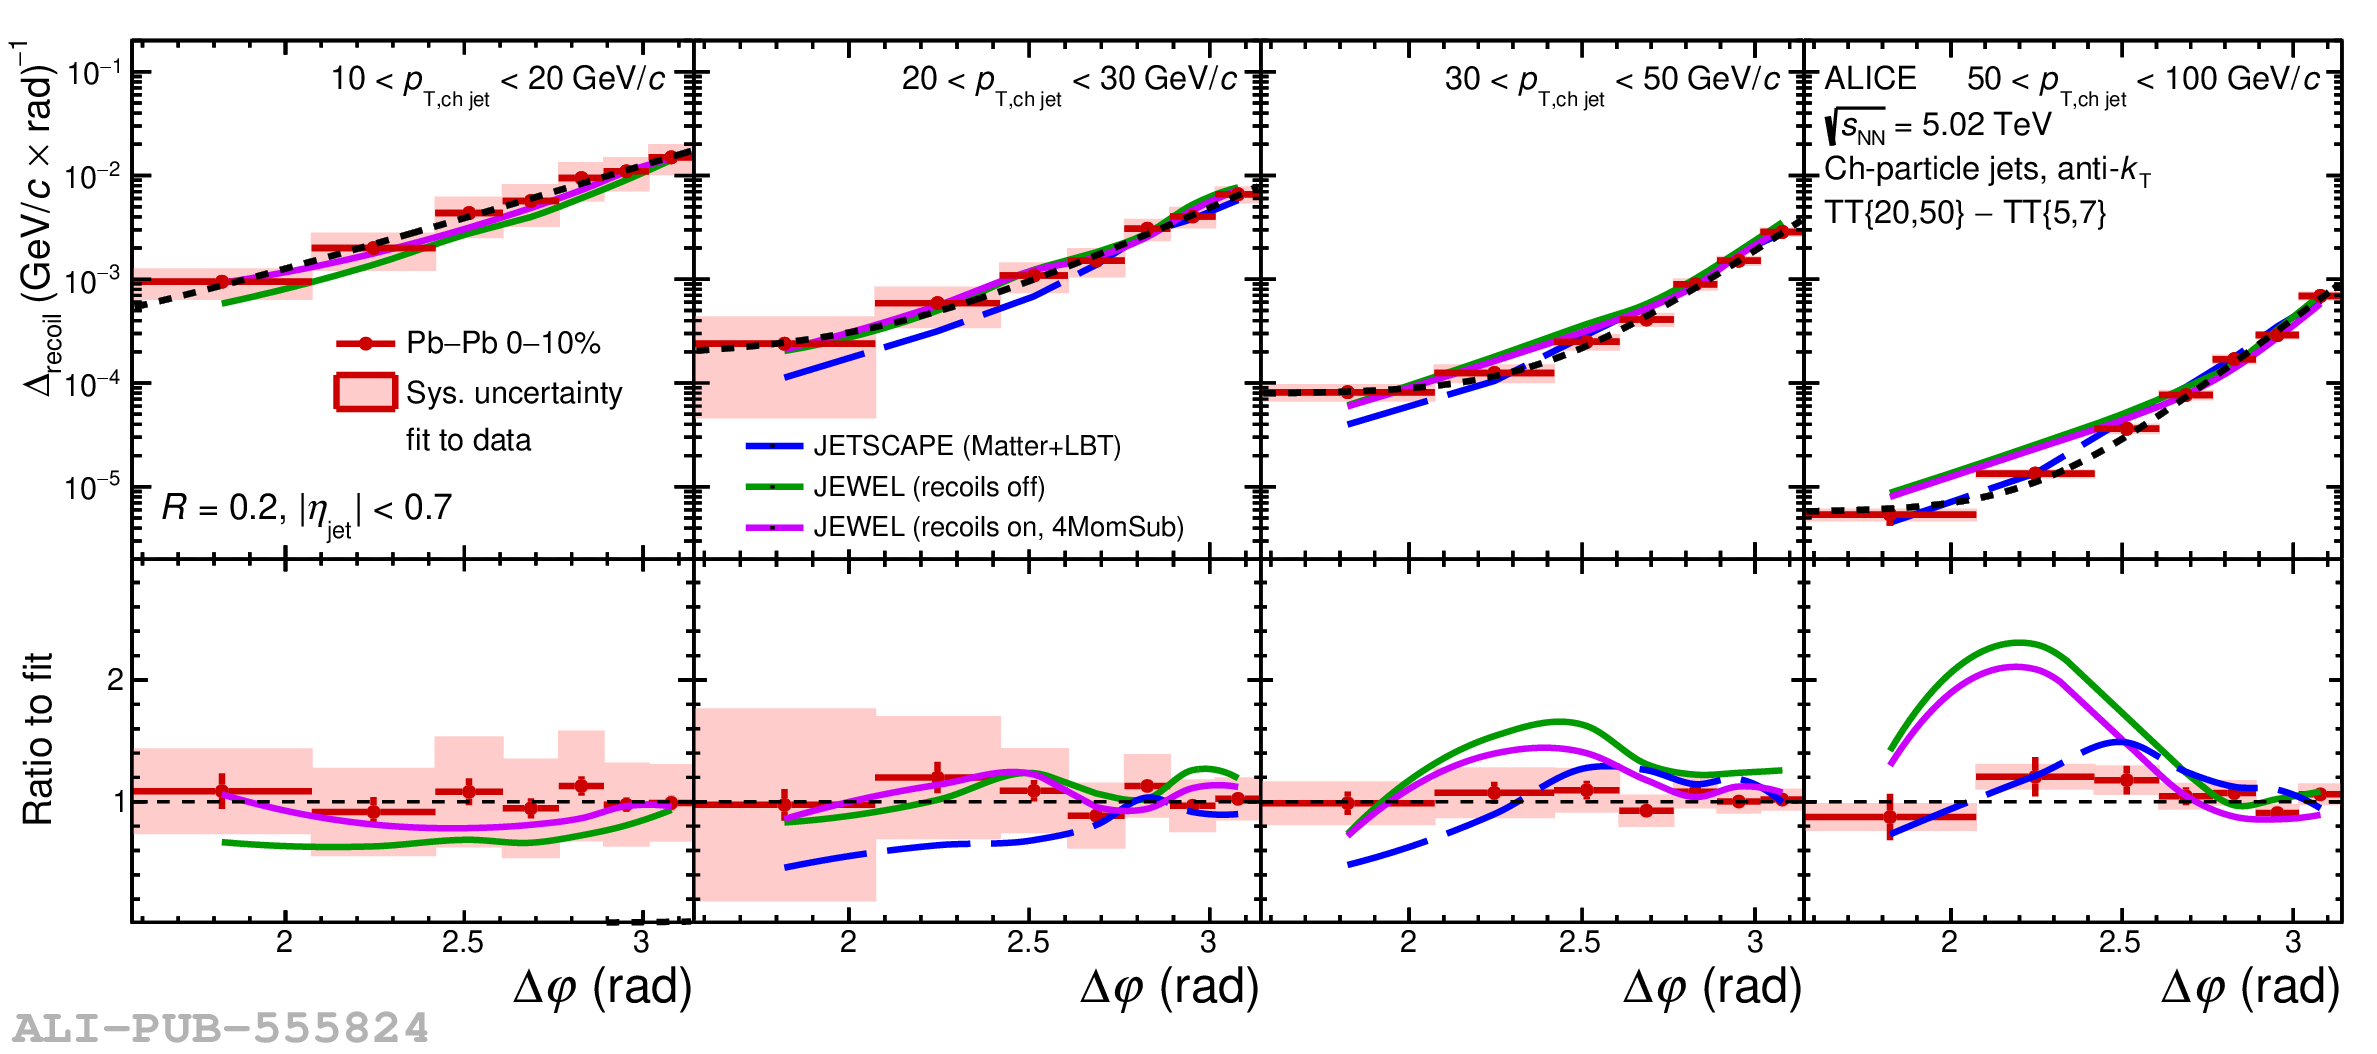 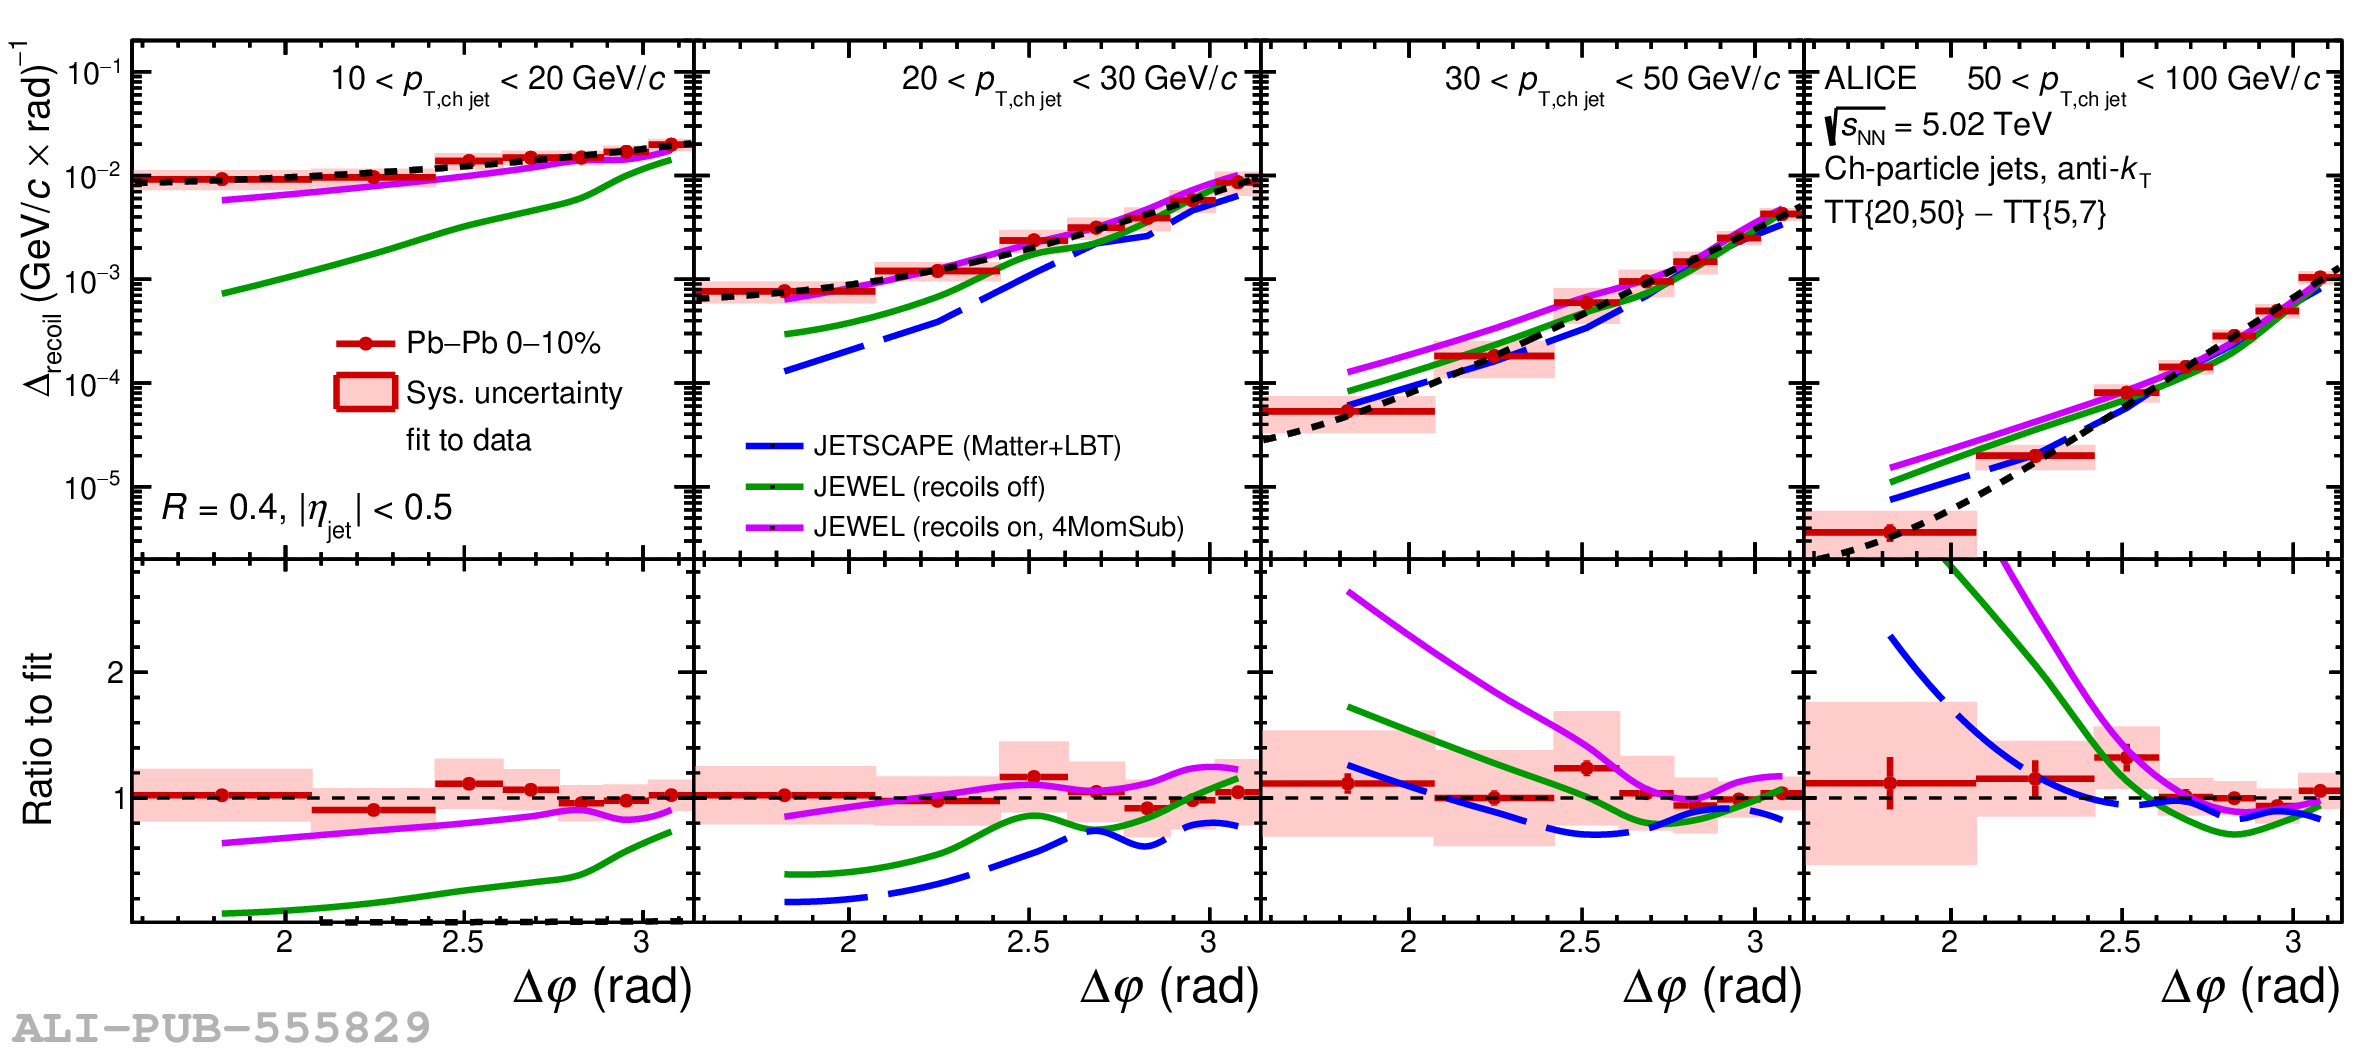 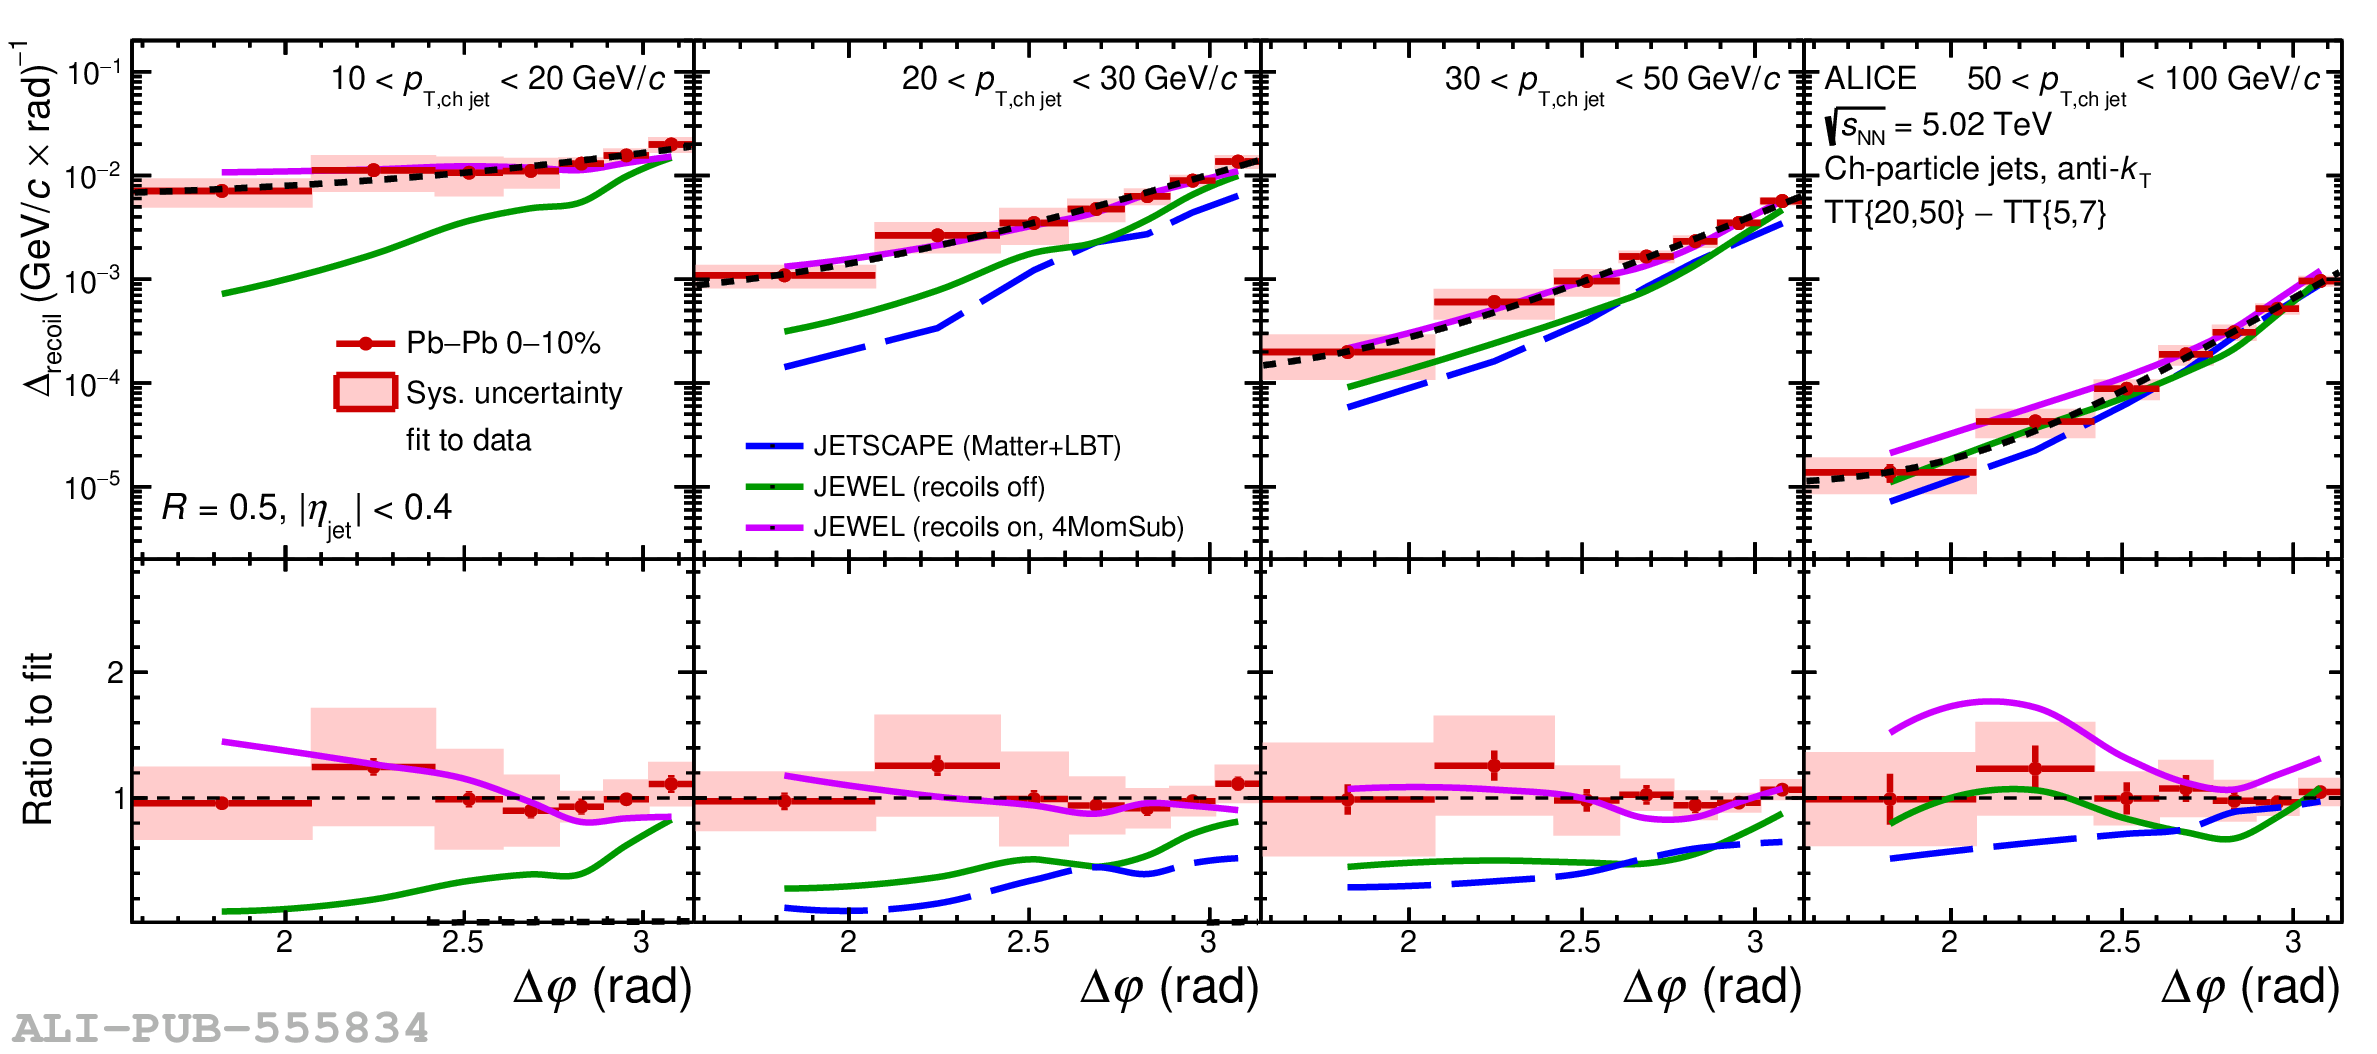 |
Figure 15
$I_{\rm AA}(p_{\rm T,\text{ch jet}})$ from the $\Delta_{\rm recoil}(p_{\rm T,jet})$ distributions measured for $R=0.2$ (top), 0.4 (middle), and 0.5 (bottom) in central Pb$-$Pb (Fig. 13) and pp collisions (Fig. 11). JETSCAPE, JEWEL, and the Hybrid Model calculations are also shown. | 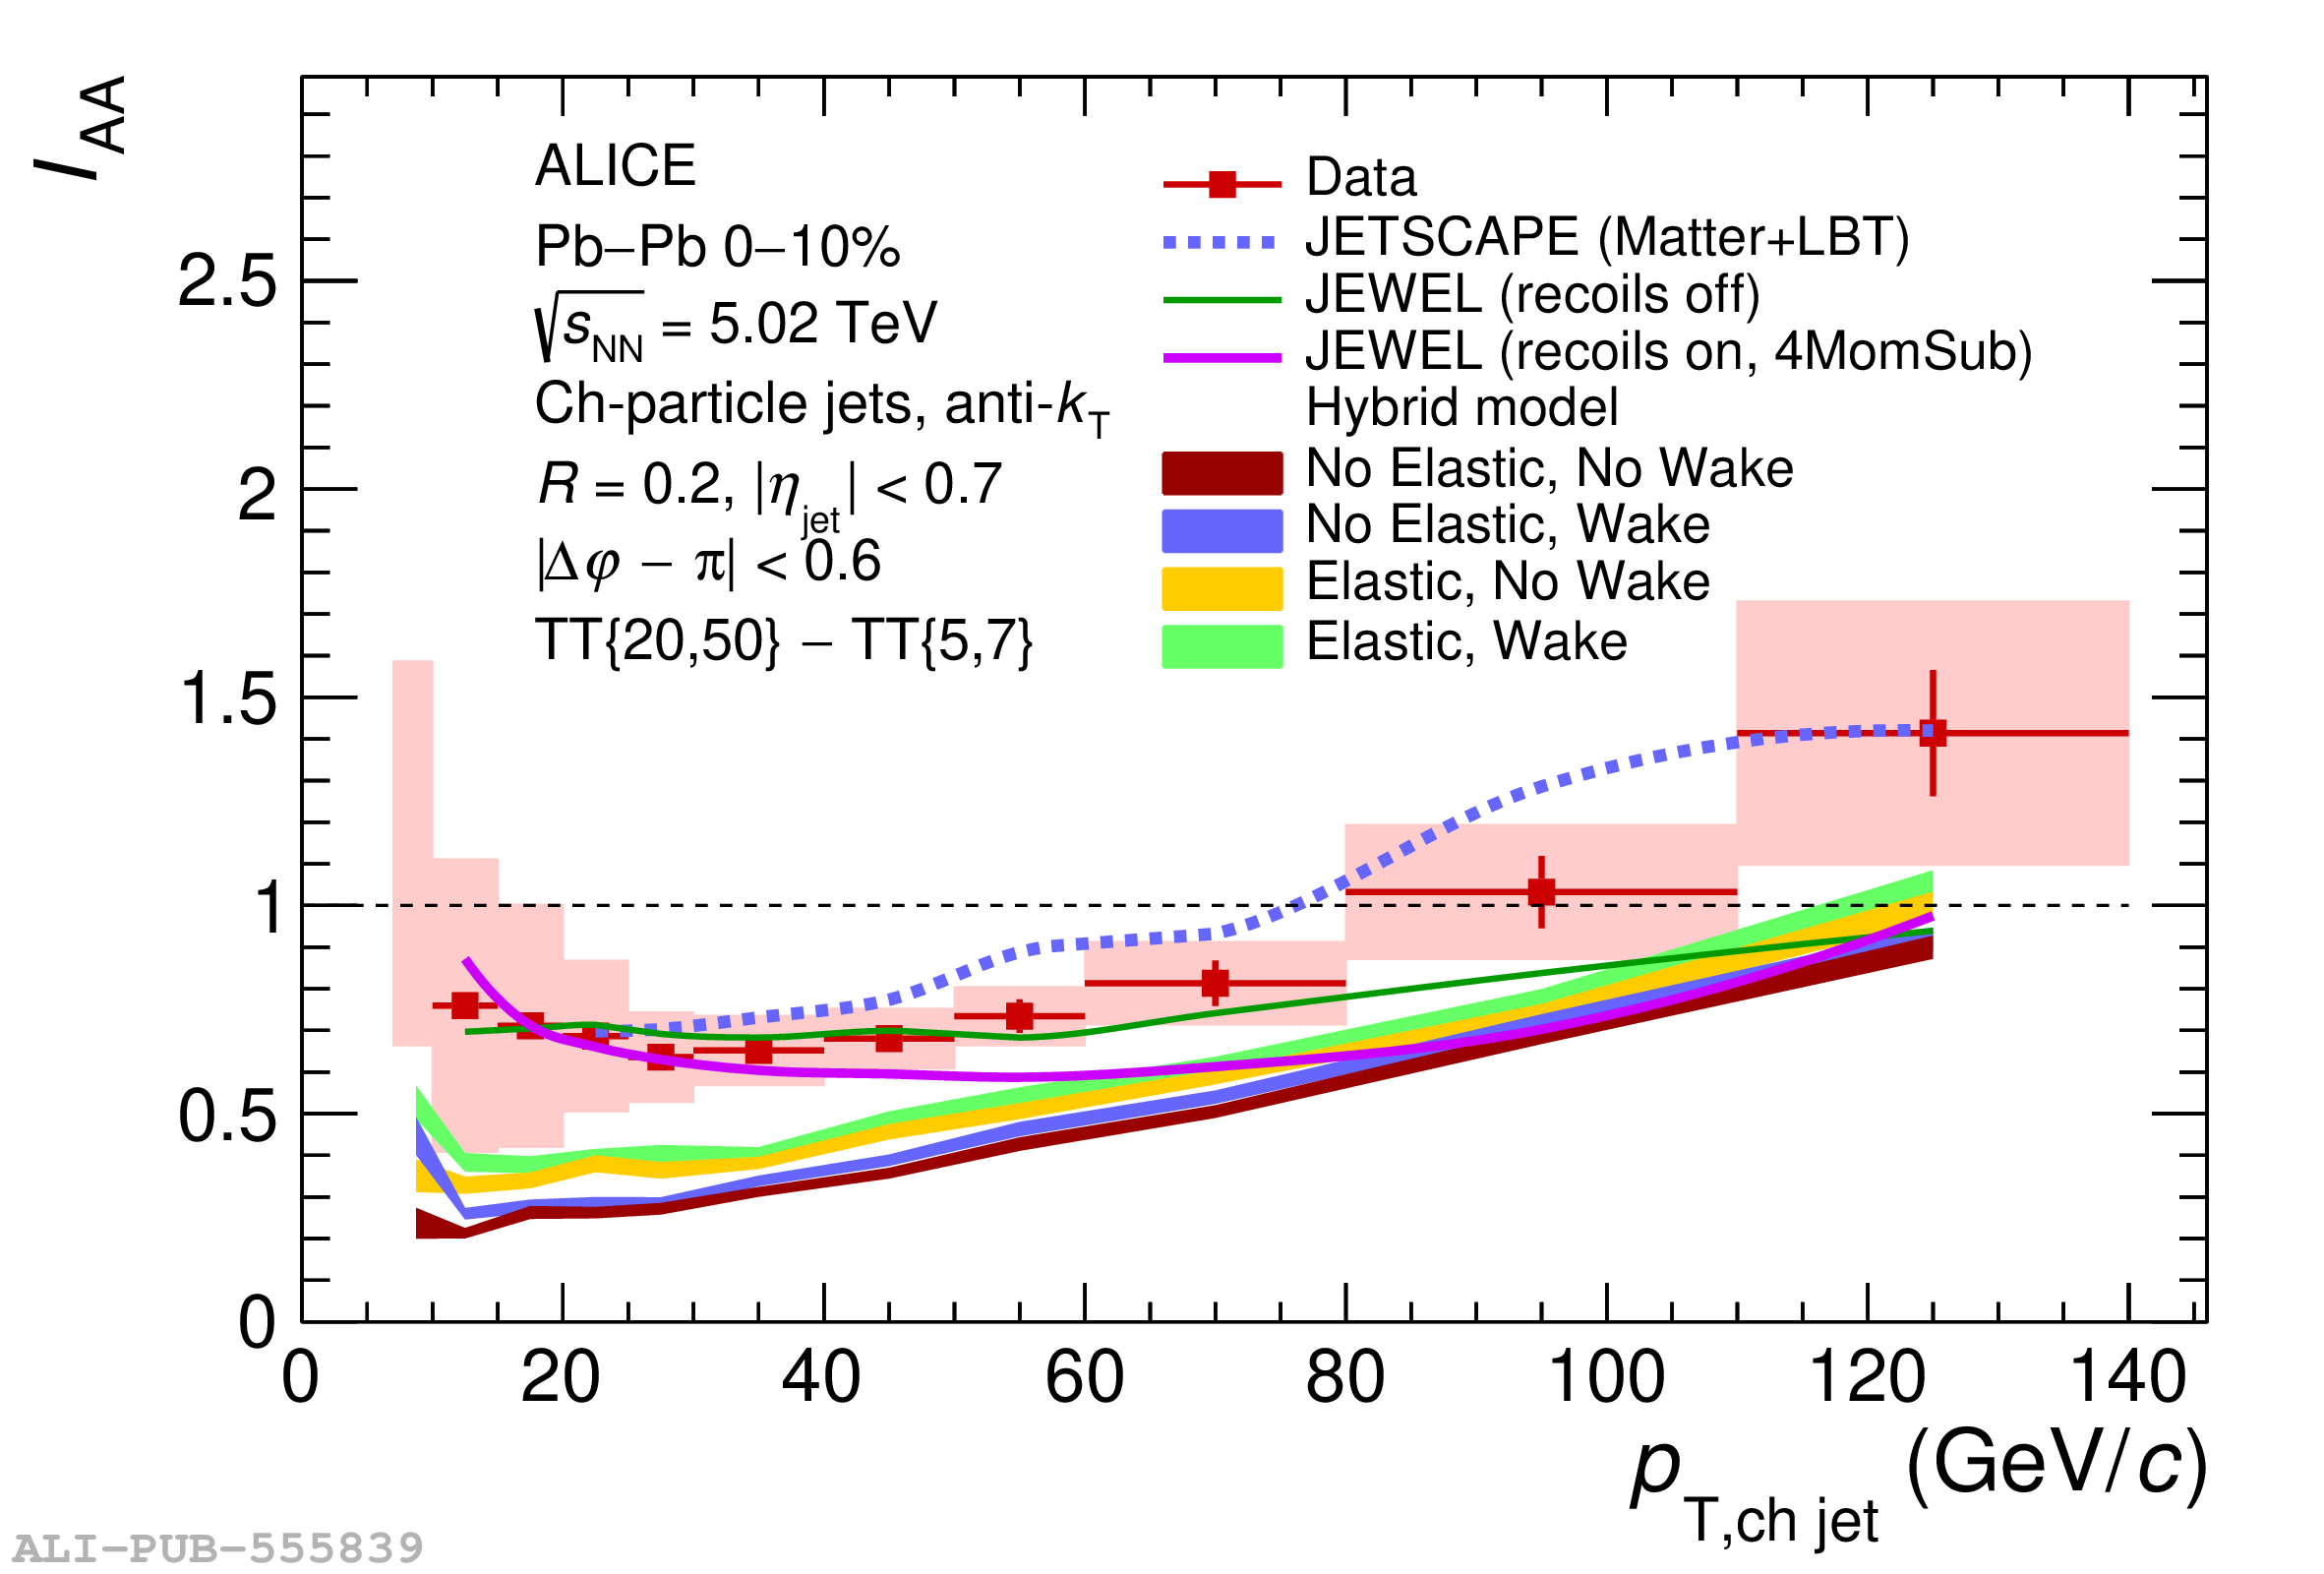 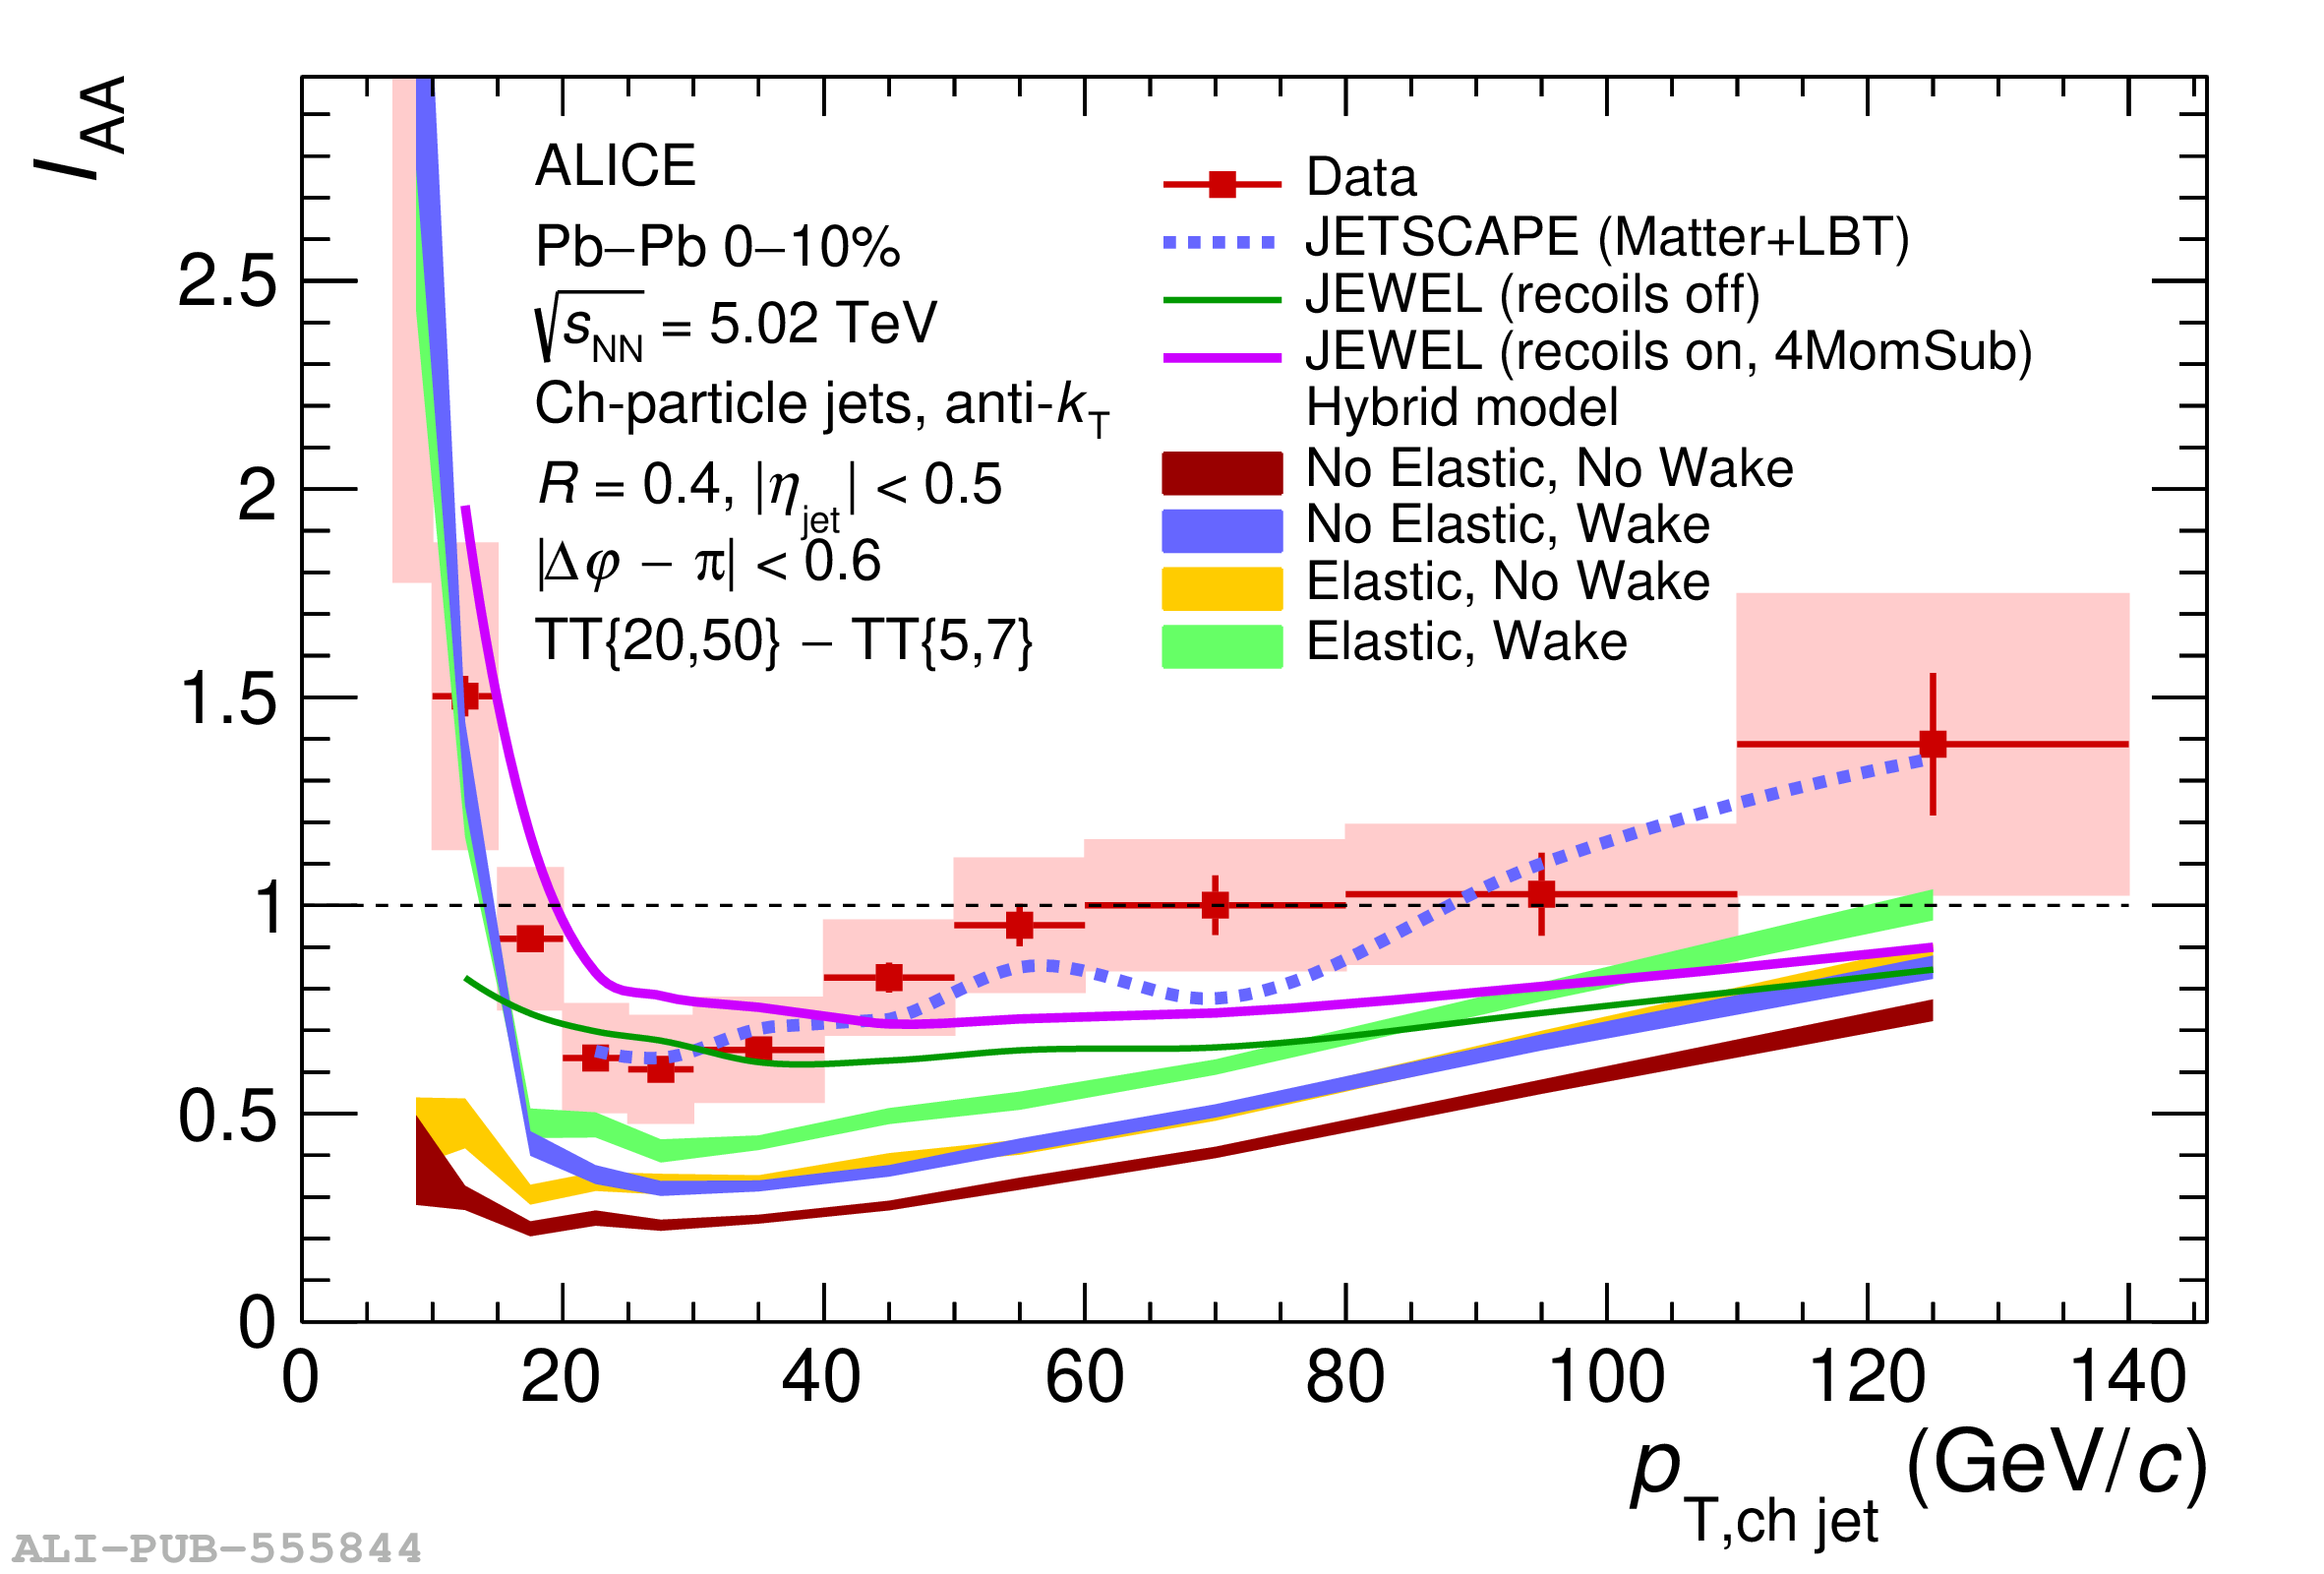 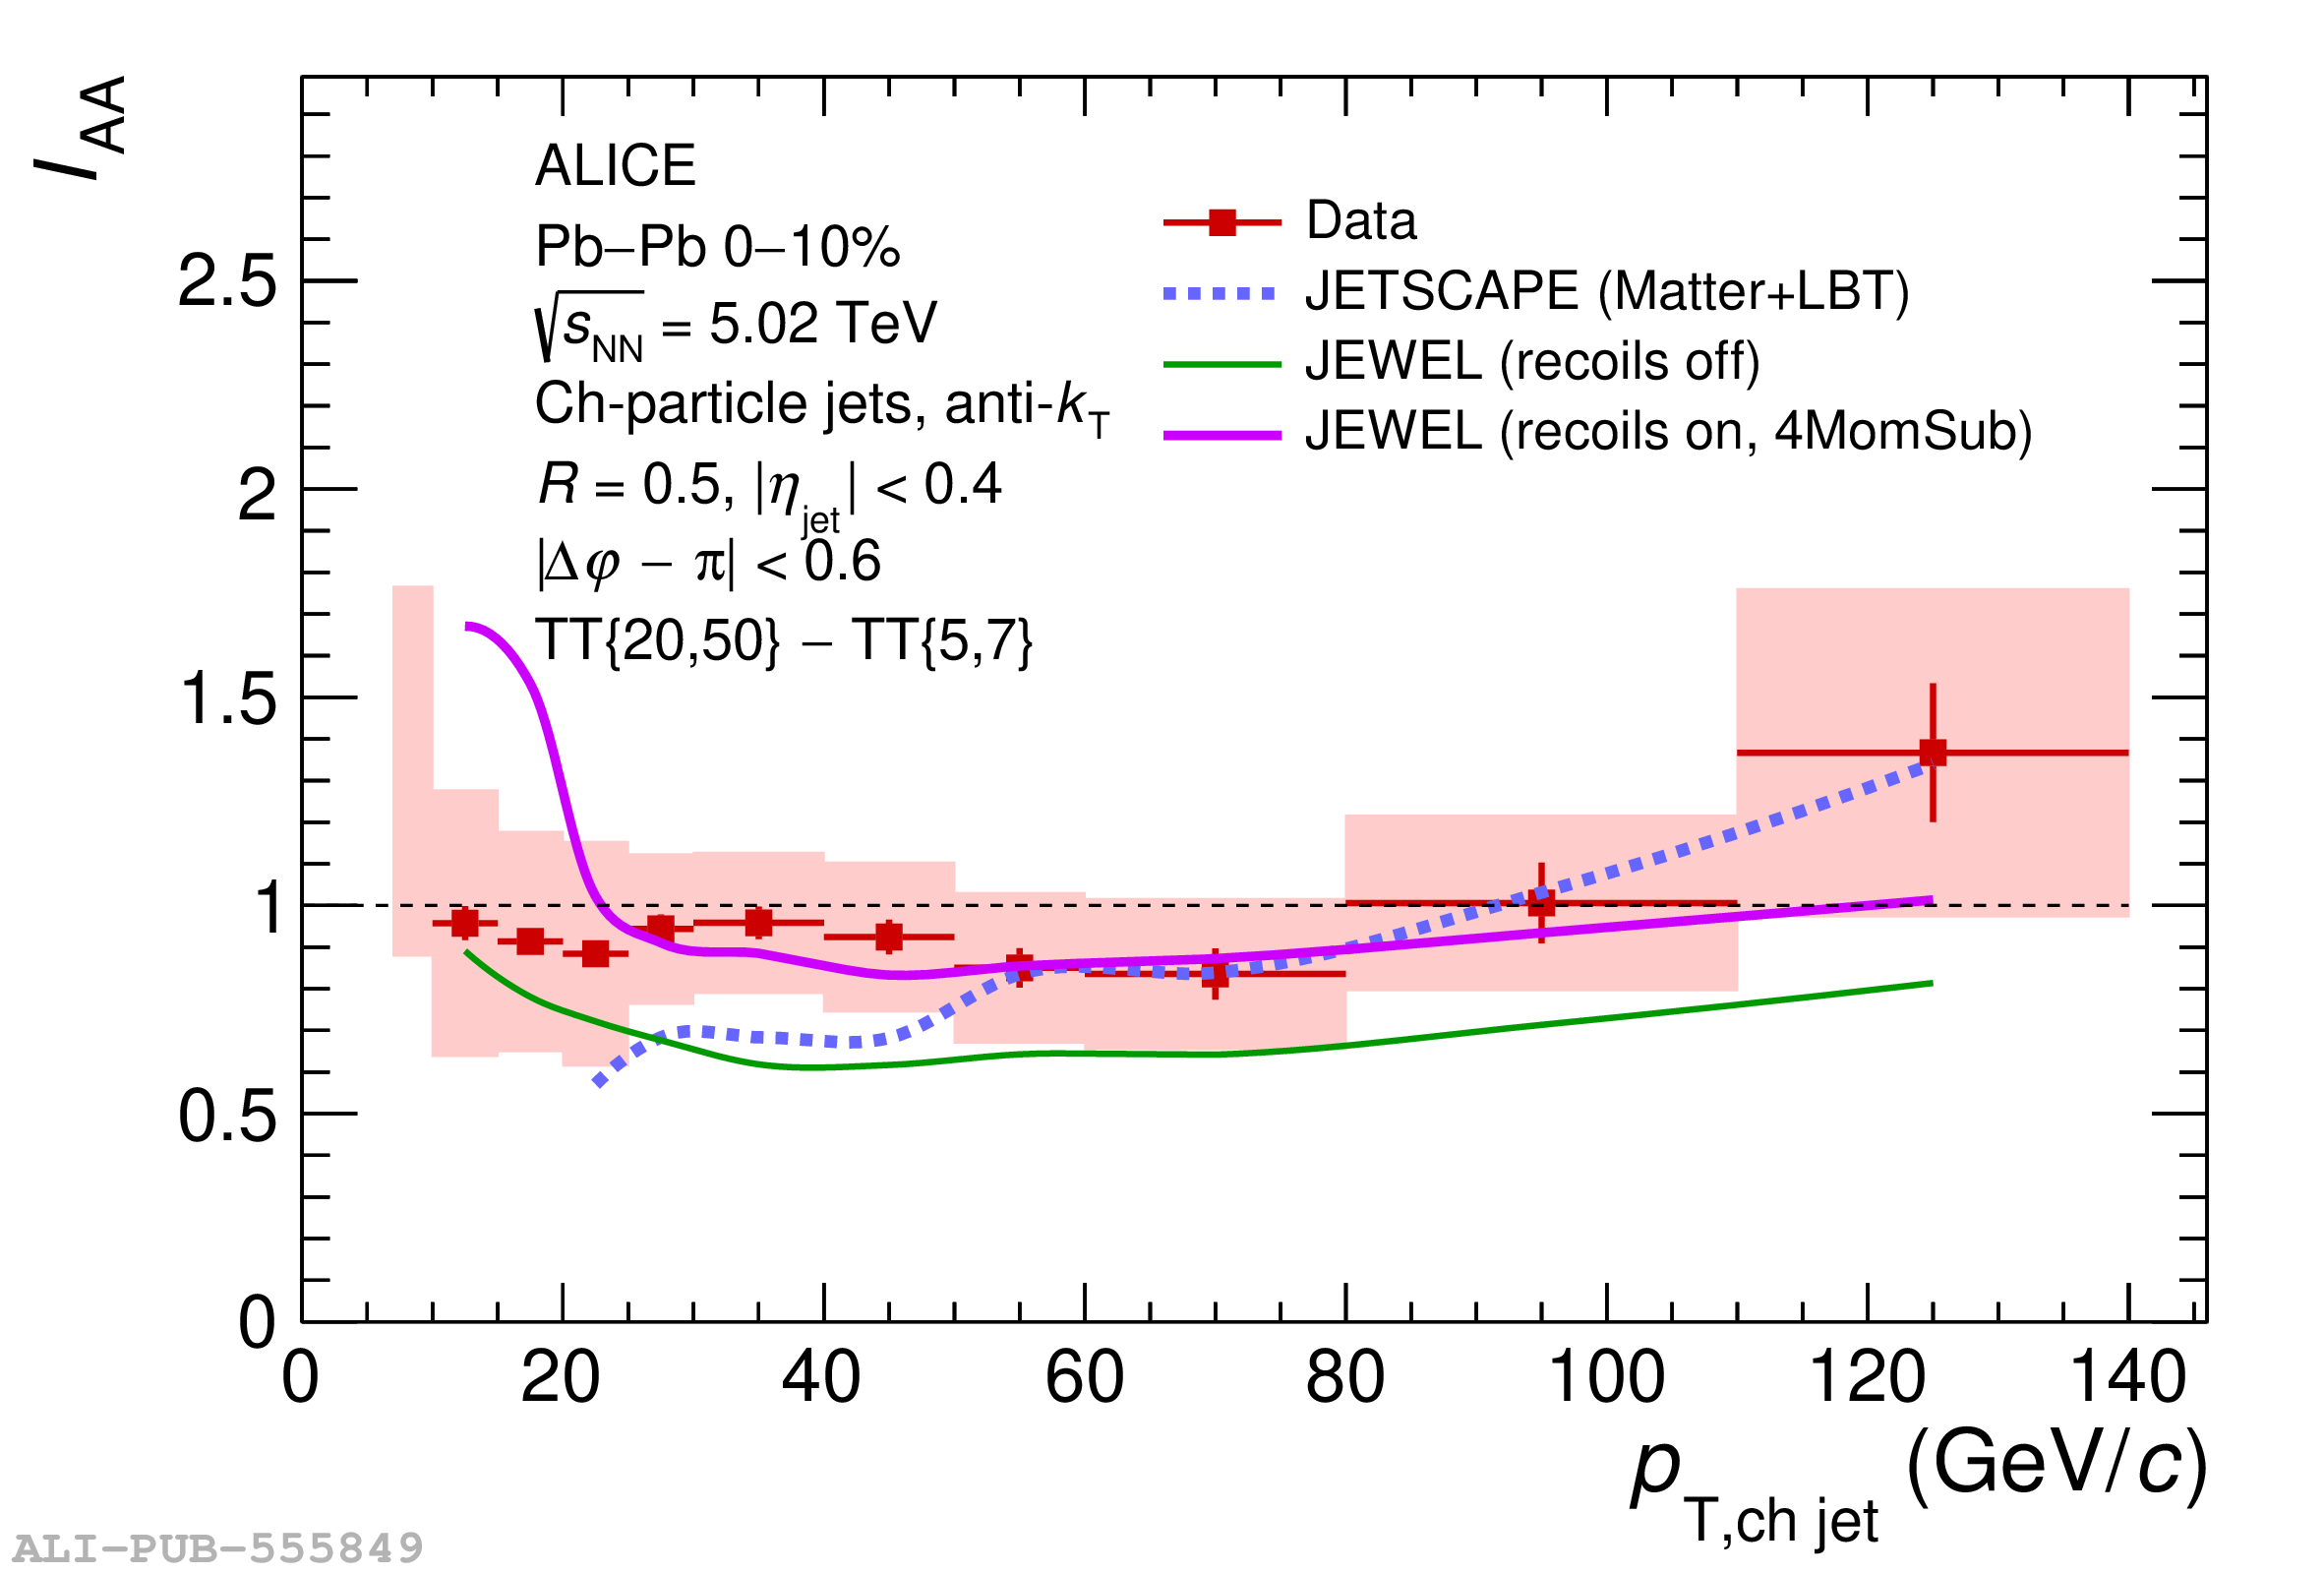 |
Figure 16
$I_{\rm AA}(p_{\rm T,\text{ch jet}})$ for $R=0.2$ and 0.4, for various ${\rm TT_{Sig}}$ selections. The data points have been displaced for clarity, and the vertical dashed grey lines indicate the bin edges. JETSCAPE predictions for the corresponding ${\rm TT_{Sig}}$ selections are also shown. | 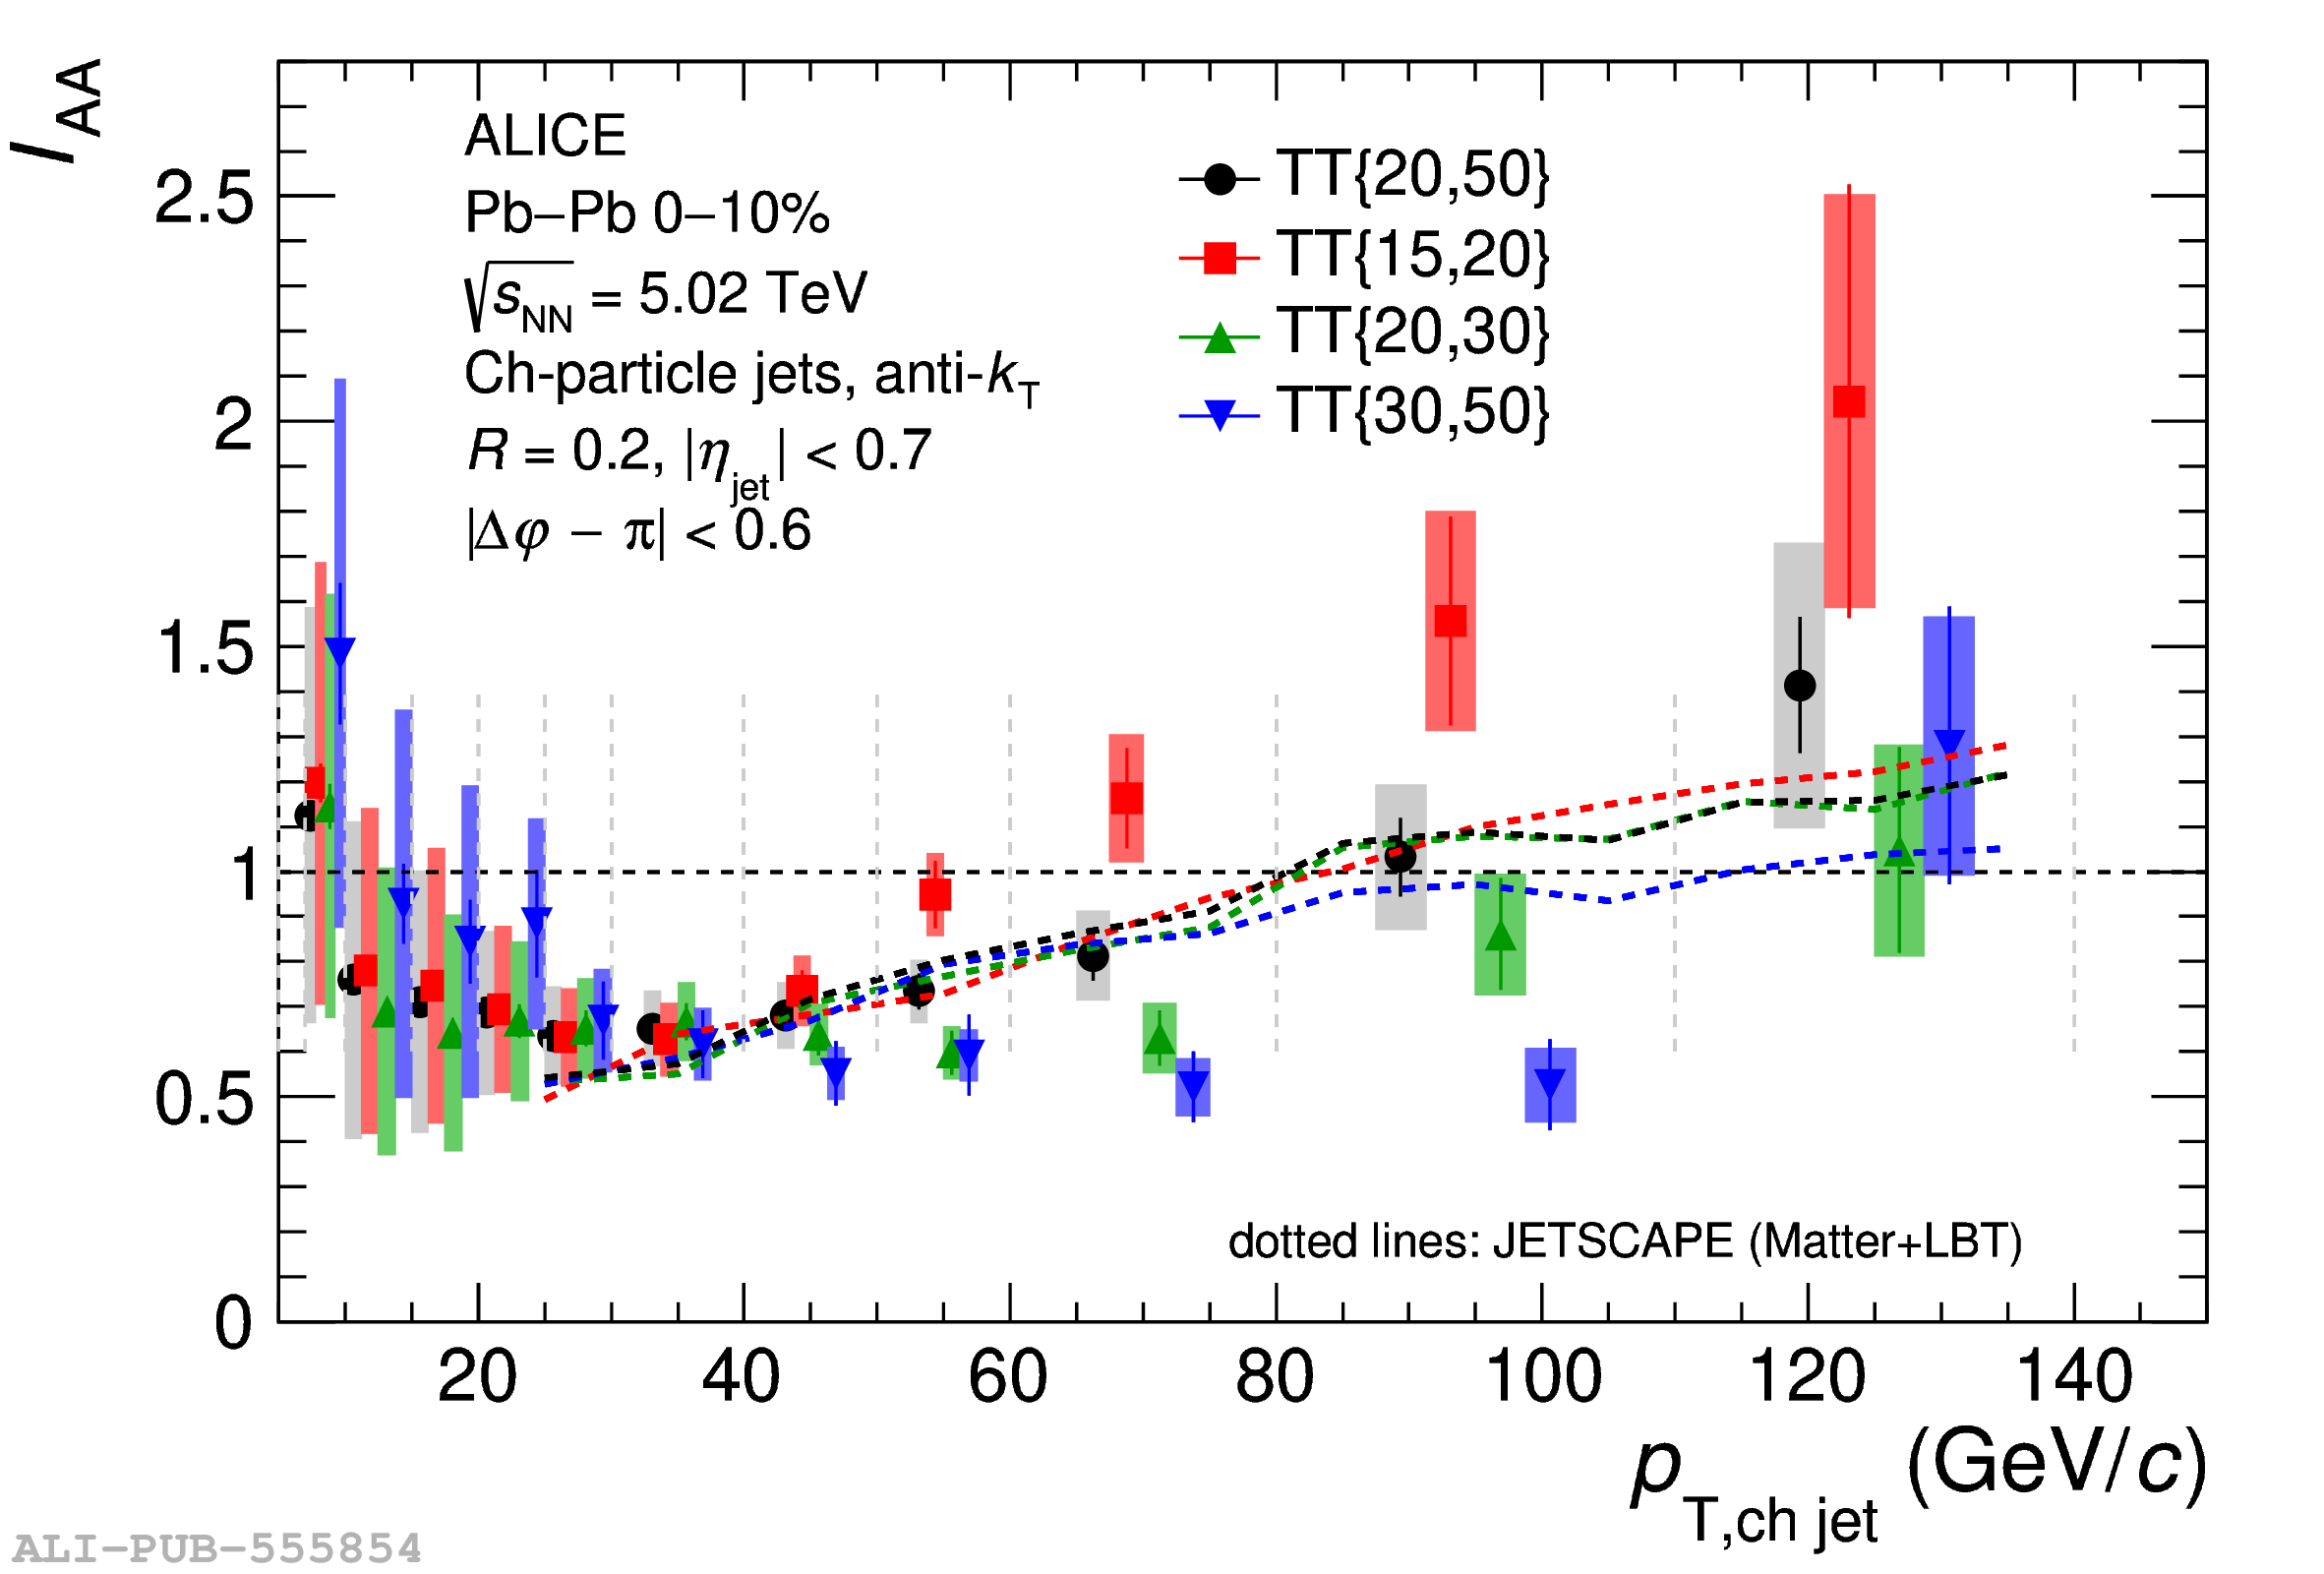 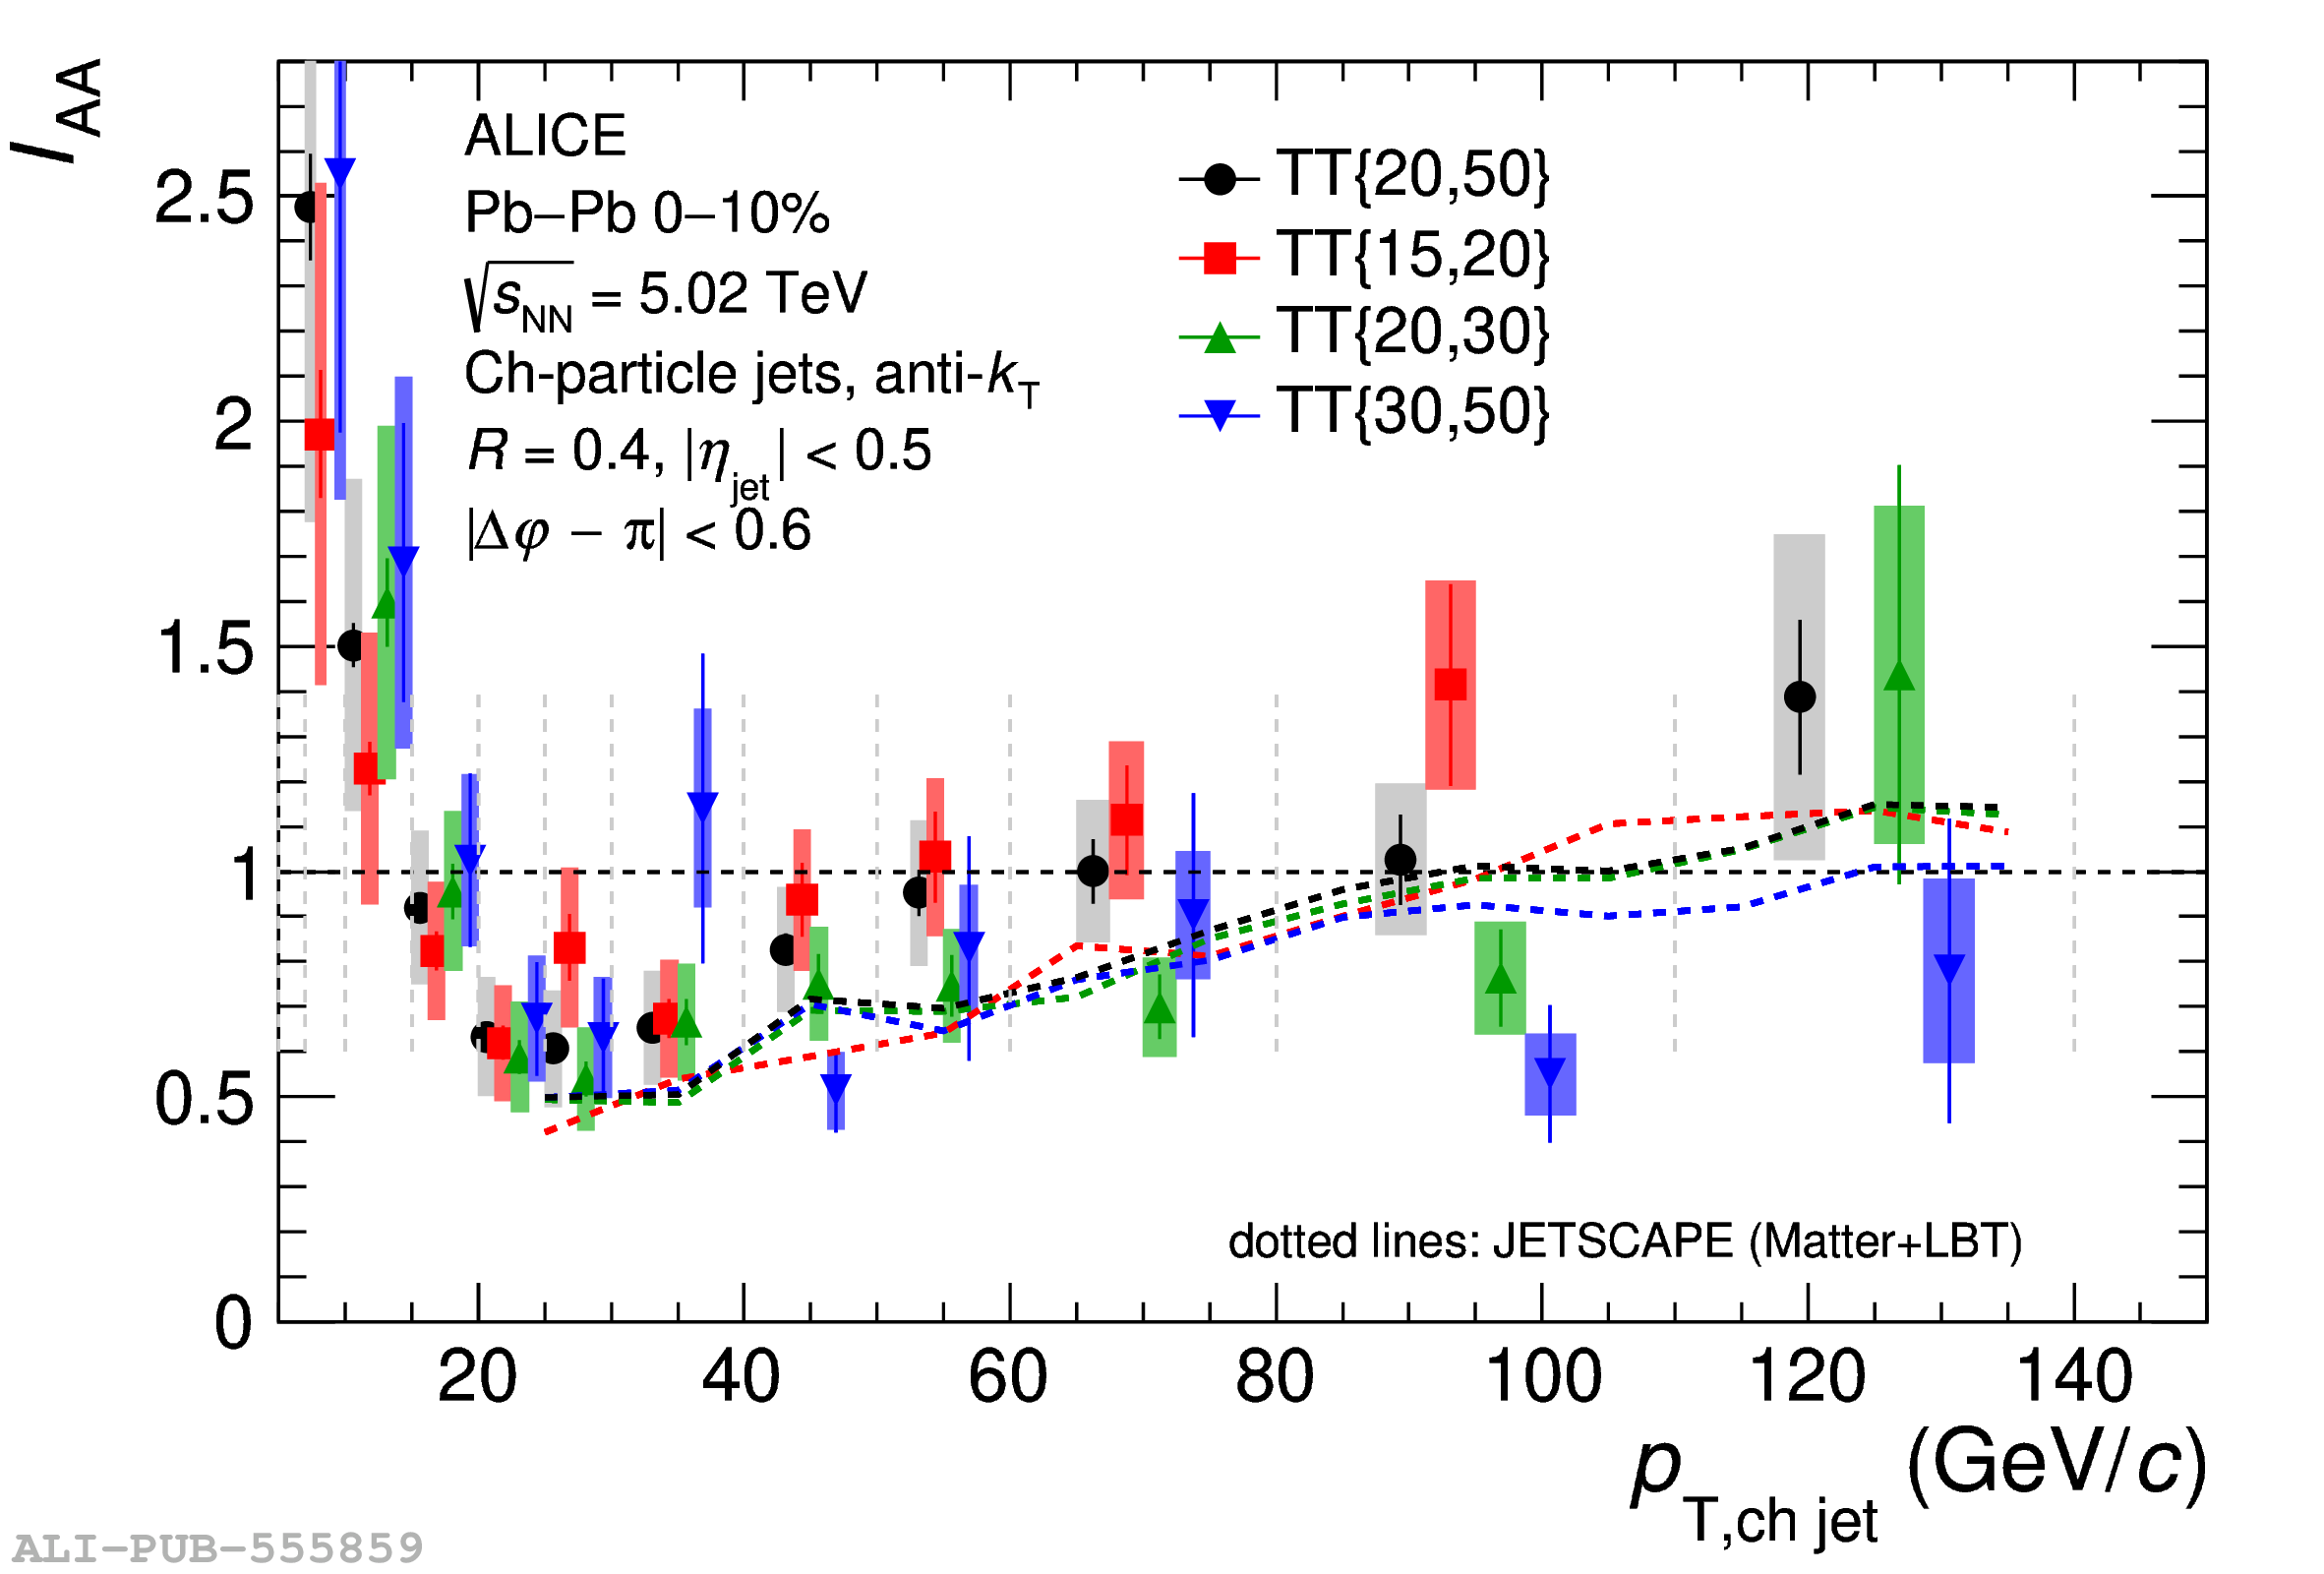 |
Figure 17
Ratio of $\Delta_{\rm recoil}(p_{\rm T,\text{ch jet}})$ distributions in pp collisions at $\sqrts=5.02$ TeV using the data from Fig. 11, for $R=0.2/R=0.4$ (left) and $R=0.2/R=0.5$ (right), compared to calculations from PYTHIA8 and JETSCAPE. The corresponding ratios of cross sections for inclusive jets are also shown for pp collisions at $\sqrts = 5.02$ TeV and $\sqrts = 13$ TeV. The uncertainties in the ratio take into account the correlation of uncertainties between numerator and denominator. | 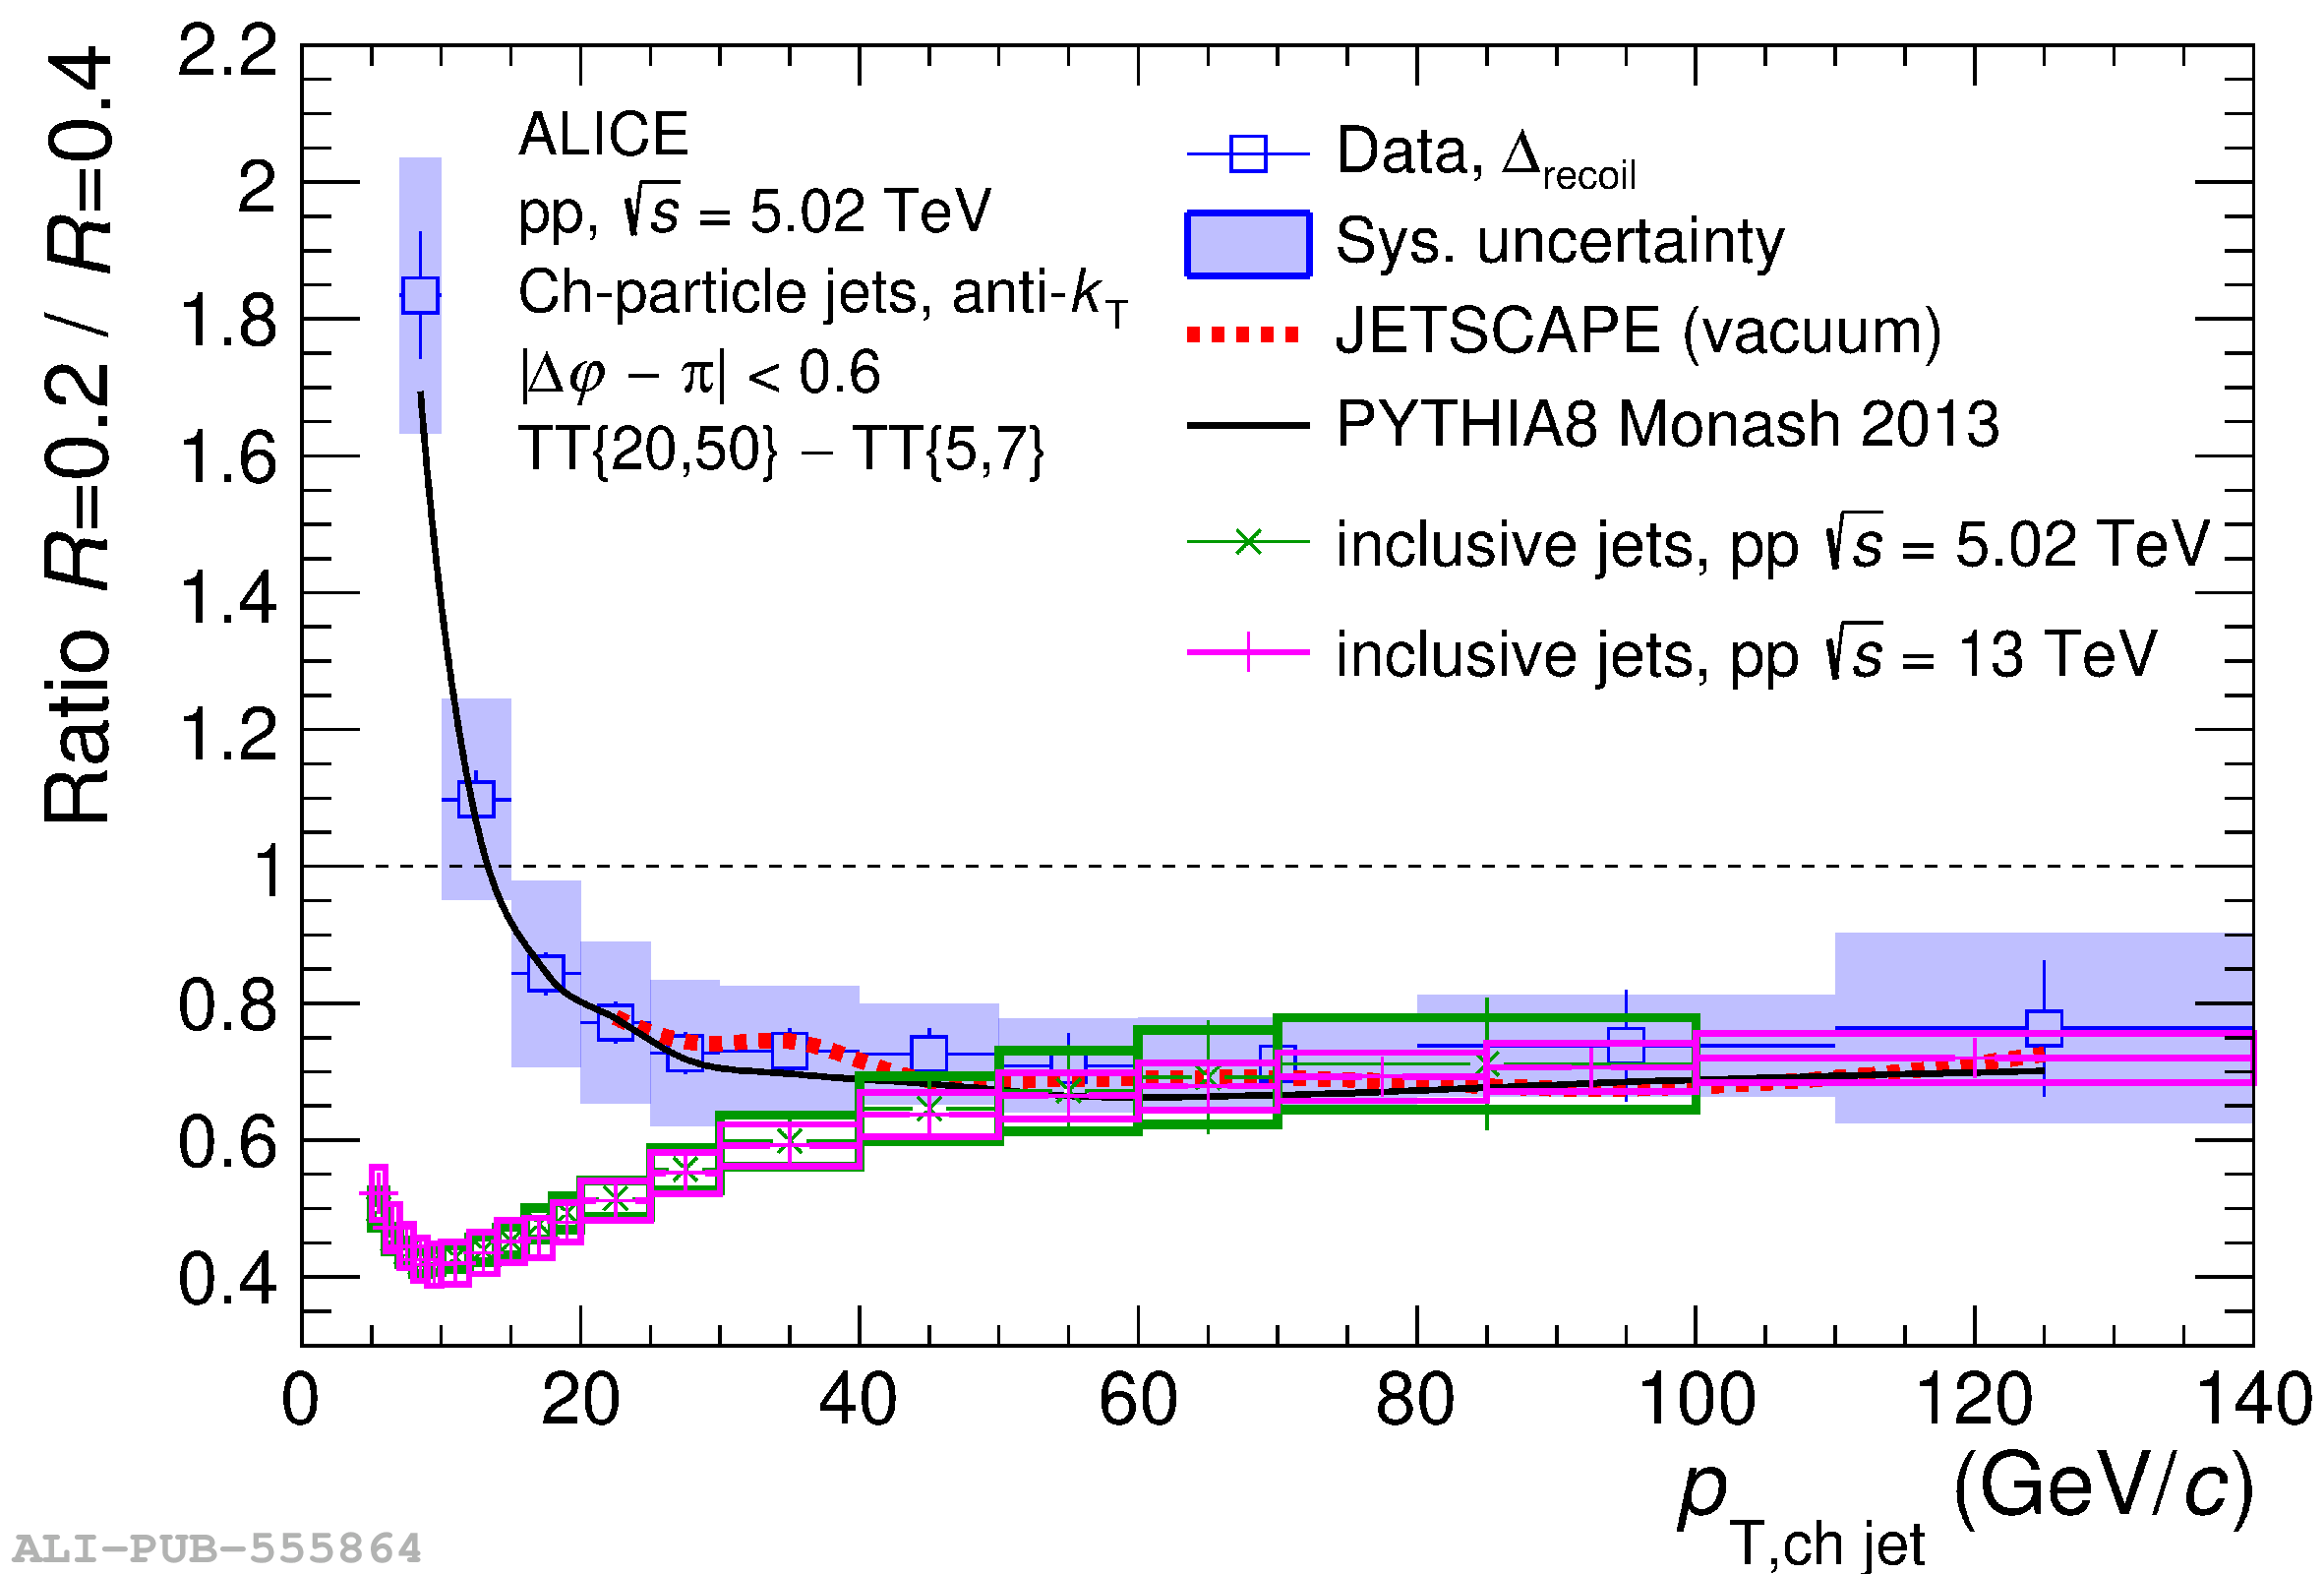 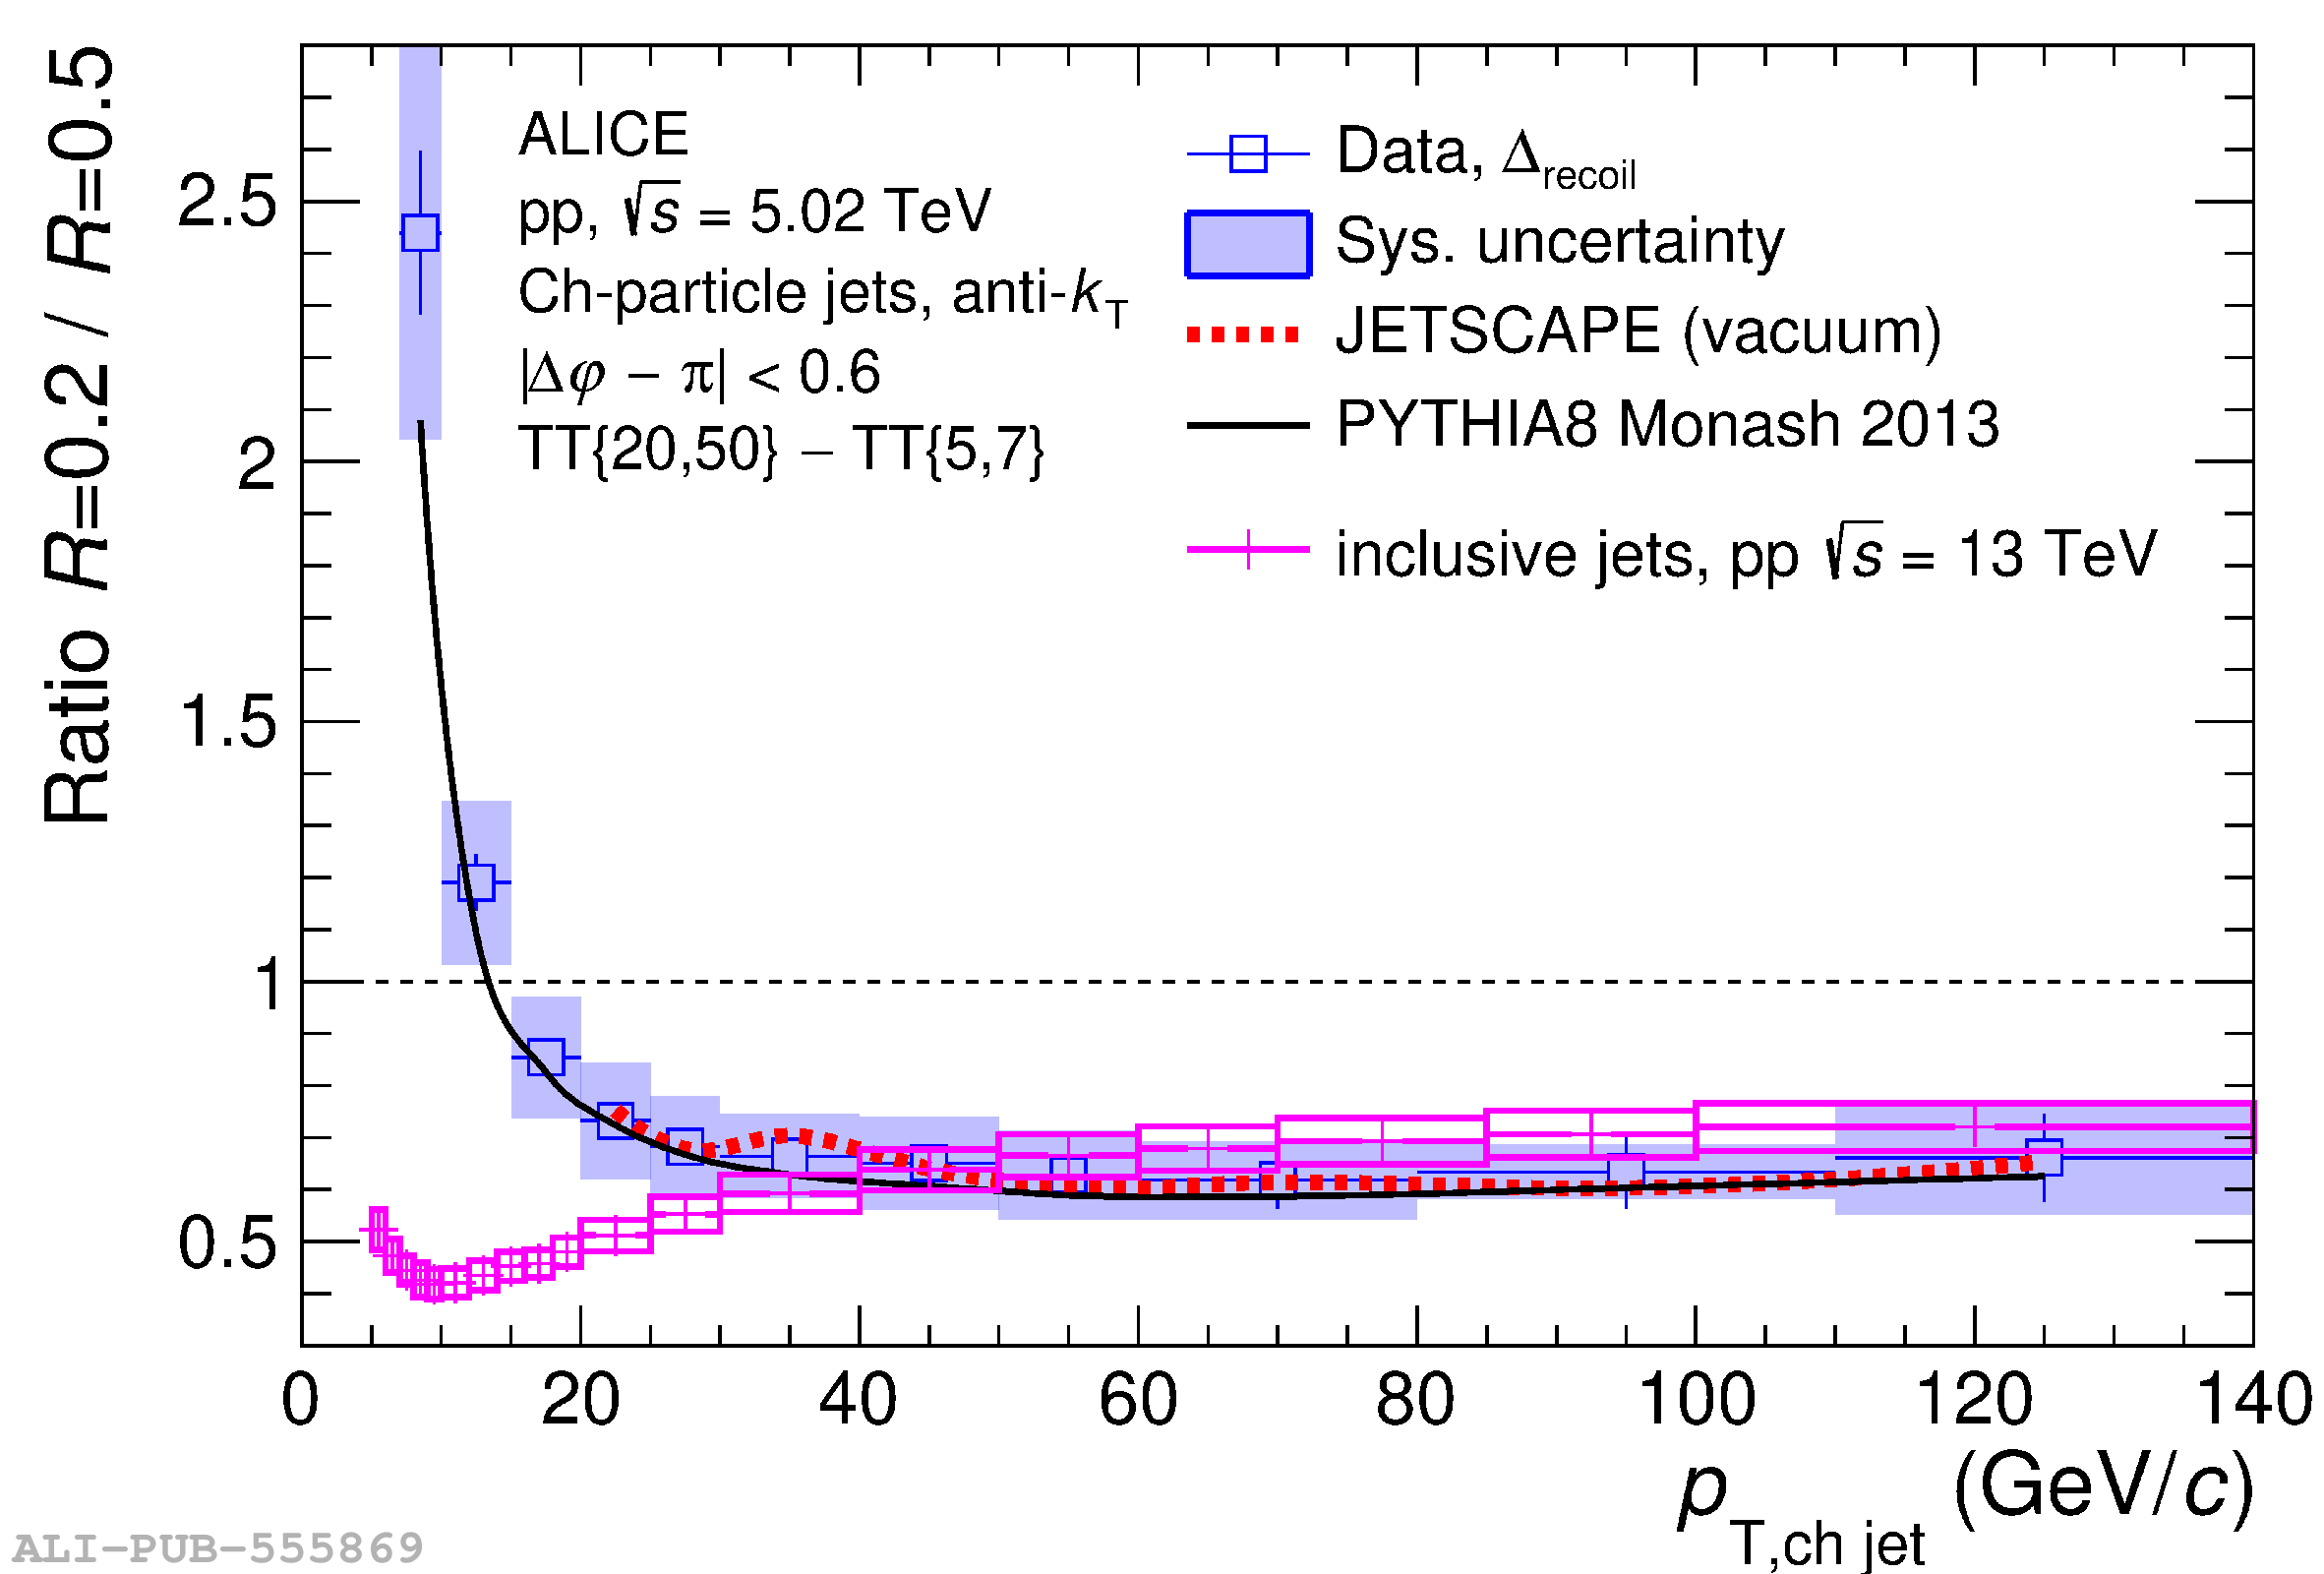 |
Figure 18
Ratio of $\Delta_{\rm recoil}(p_{\rm T,\text{ch jet}})$ distributions with different $R$ for Pb$-$Pb collisions at $\sqrtsNN=5.02$ TeV from the data in Fig. 13, together with the ratios for pp collisions from Fig. 17, for $R=0.2/R=0.4$ (upper), $R=0.2/R=0.5$ (middle), and $R=0.4/R=0.5$ (lower). The uncertainty in the ratio takes into account the correlation of uncertainties between numerator and denominator. JETSCAPE calculations for pp and Pb$-$Pb collisions are also shown. | 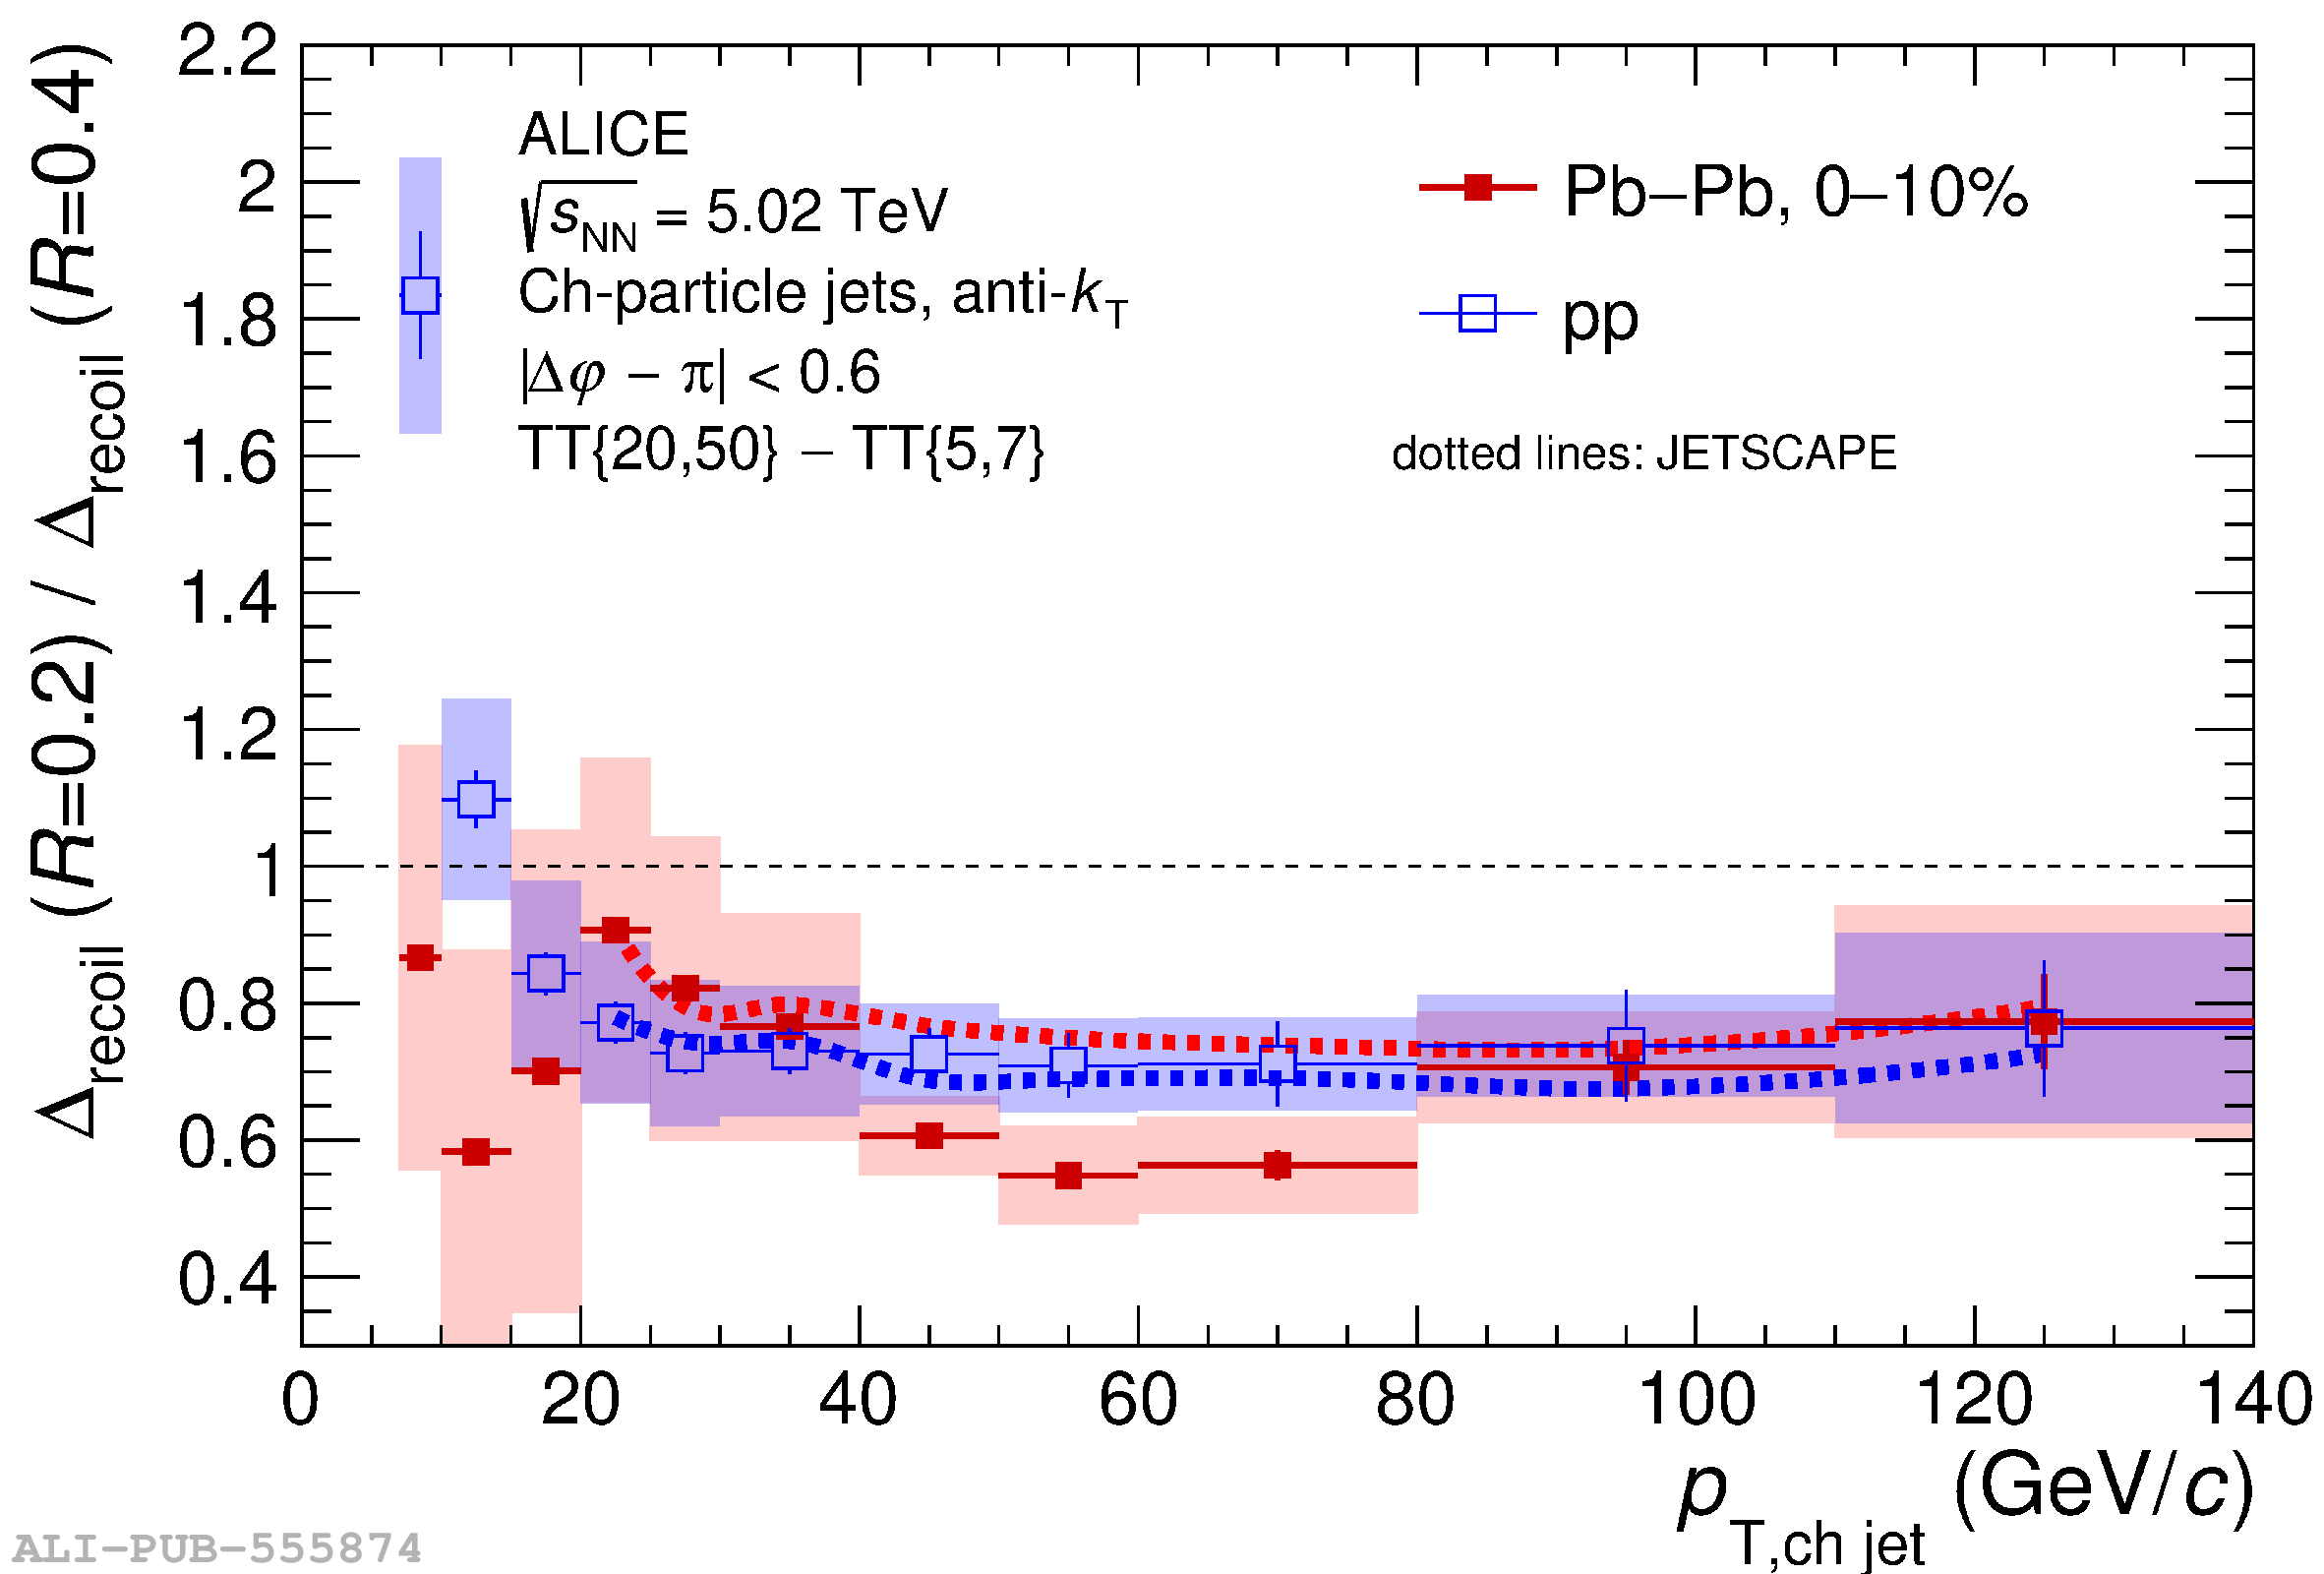 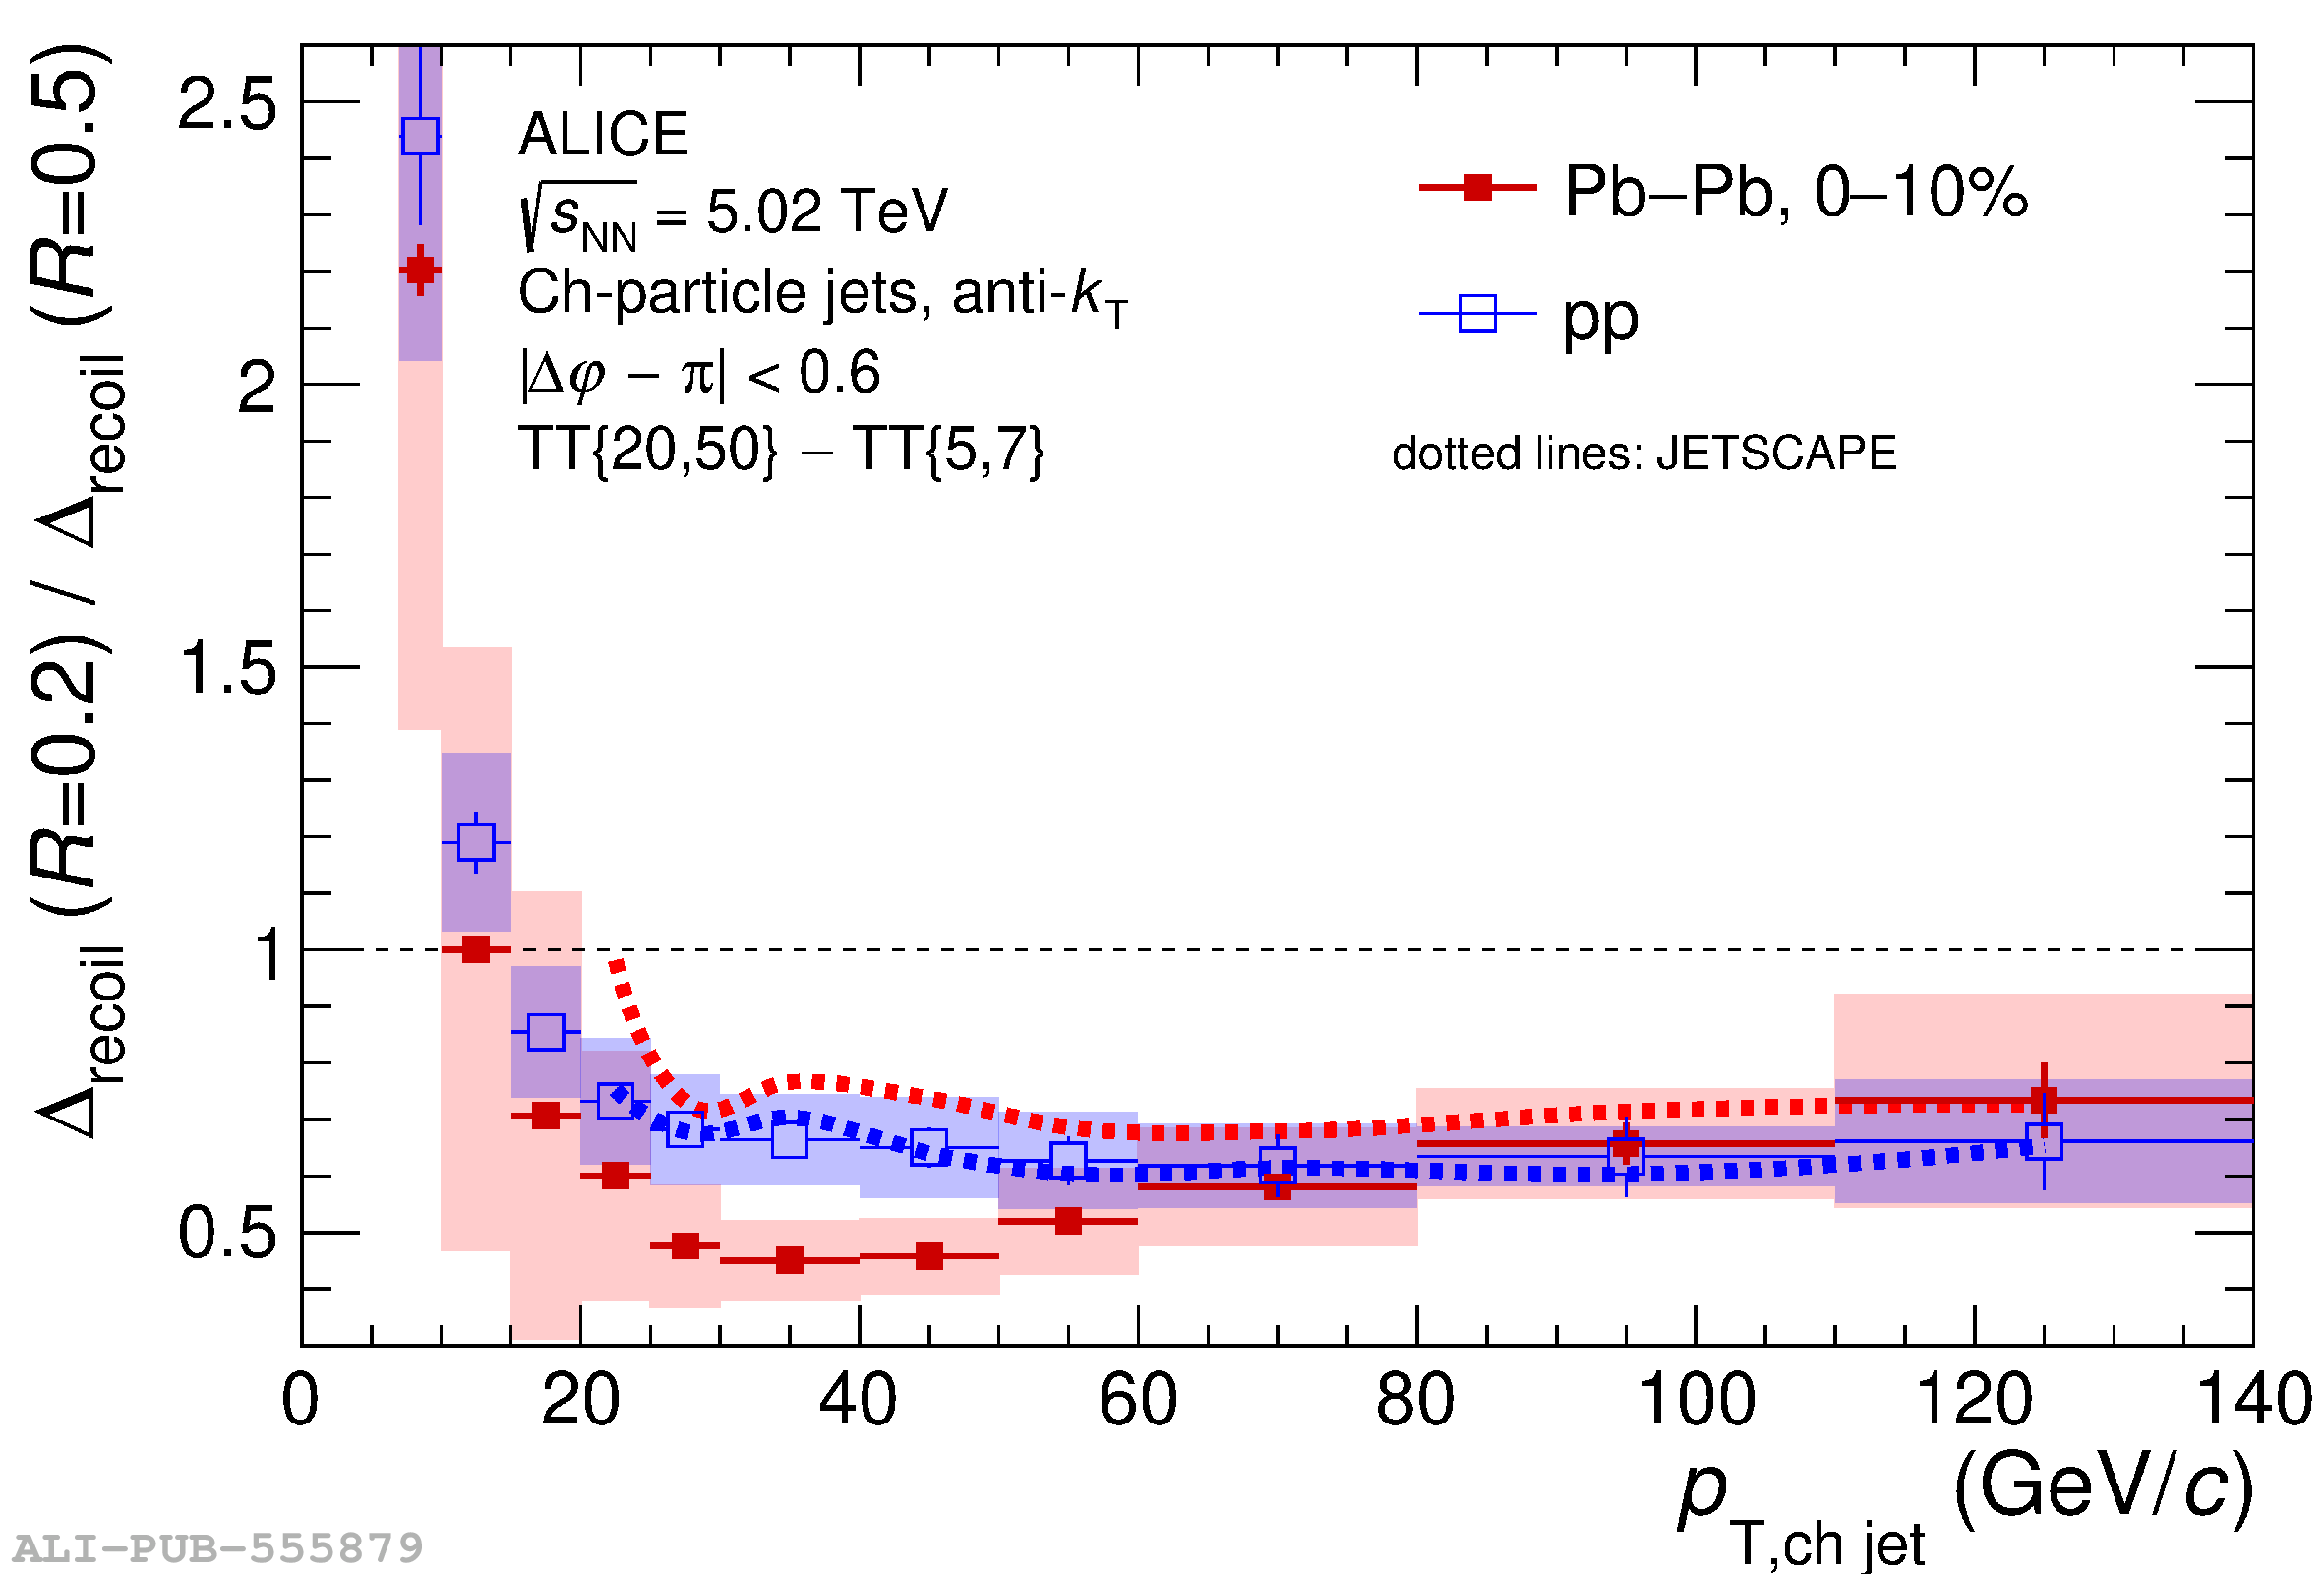  |
Figure 19
Distributions as a function of $\Delta\varphi$ for $R=0.2$. Upper panels: $\Delta_{\rm recoil}(\Delta\varphi)$ in intervals of $p_{\rm T,\text{ch jet}}$ measured in pp and Pb$-$Pb collisions. Lower panels: $I_{\rm AA}(\Delta\varphi)$, the ratio of the pp and Pb$-$Pb distributions in the corresponding upper panel. Predictions from JETSCAPE, JEWEL, Hybrid model, and a pQCD calculation are also shown. | 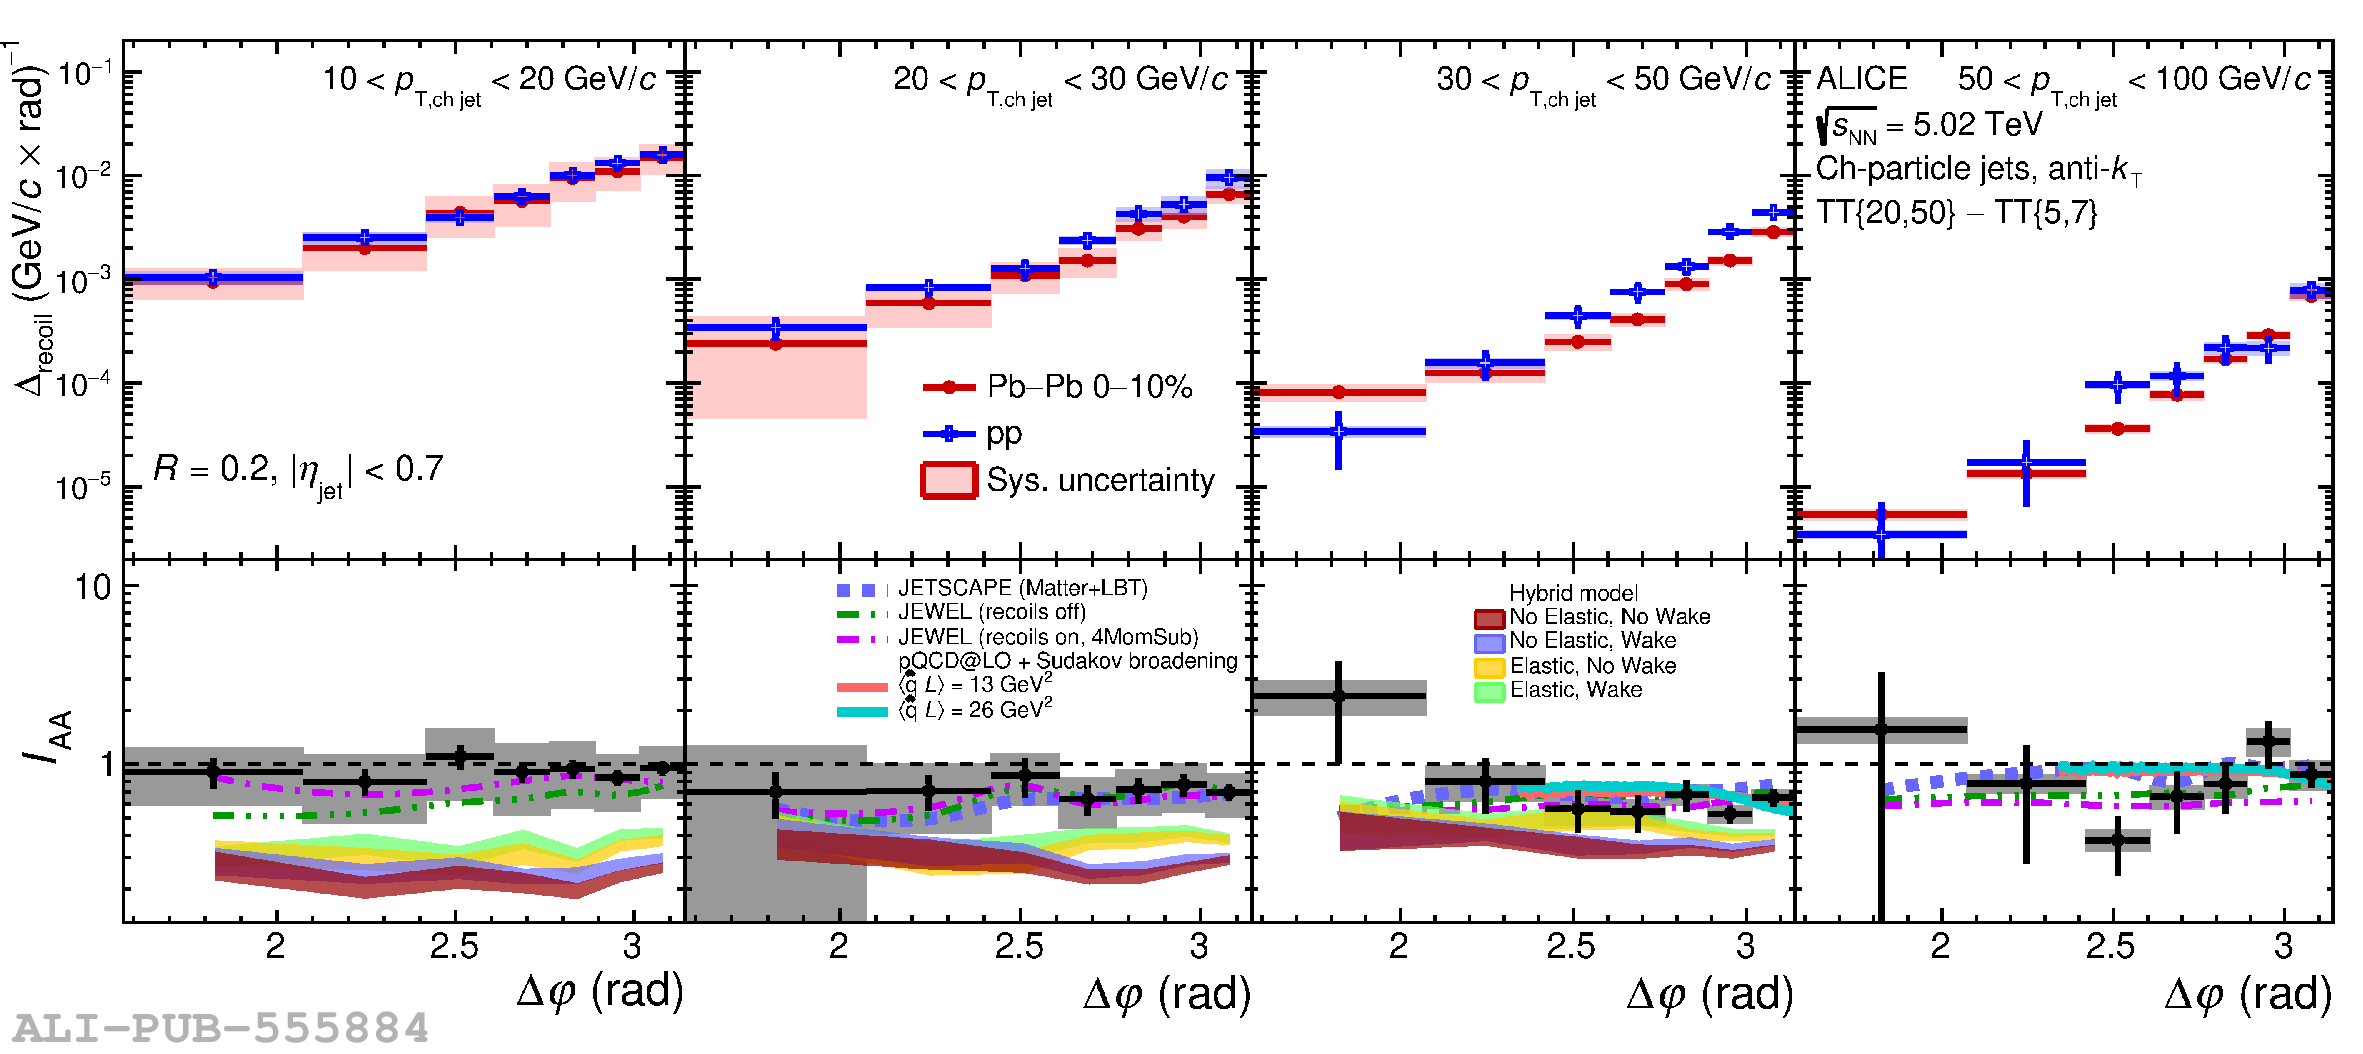 |
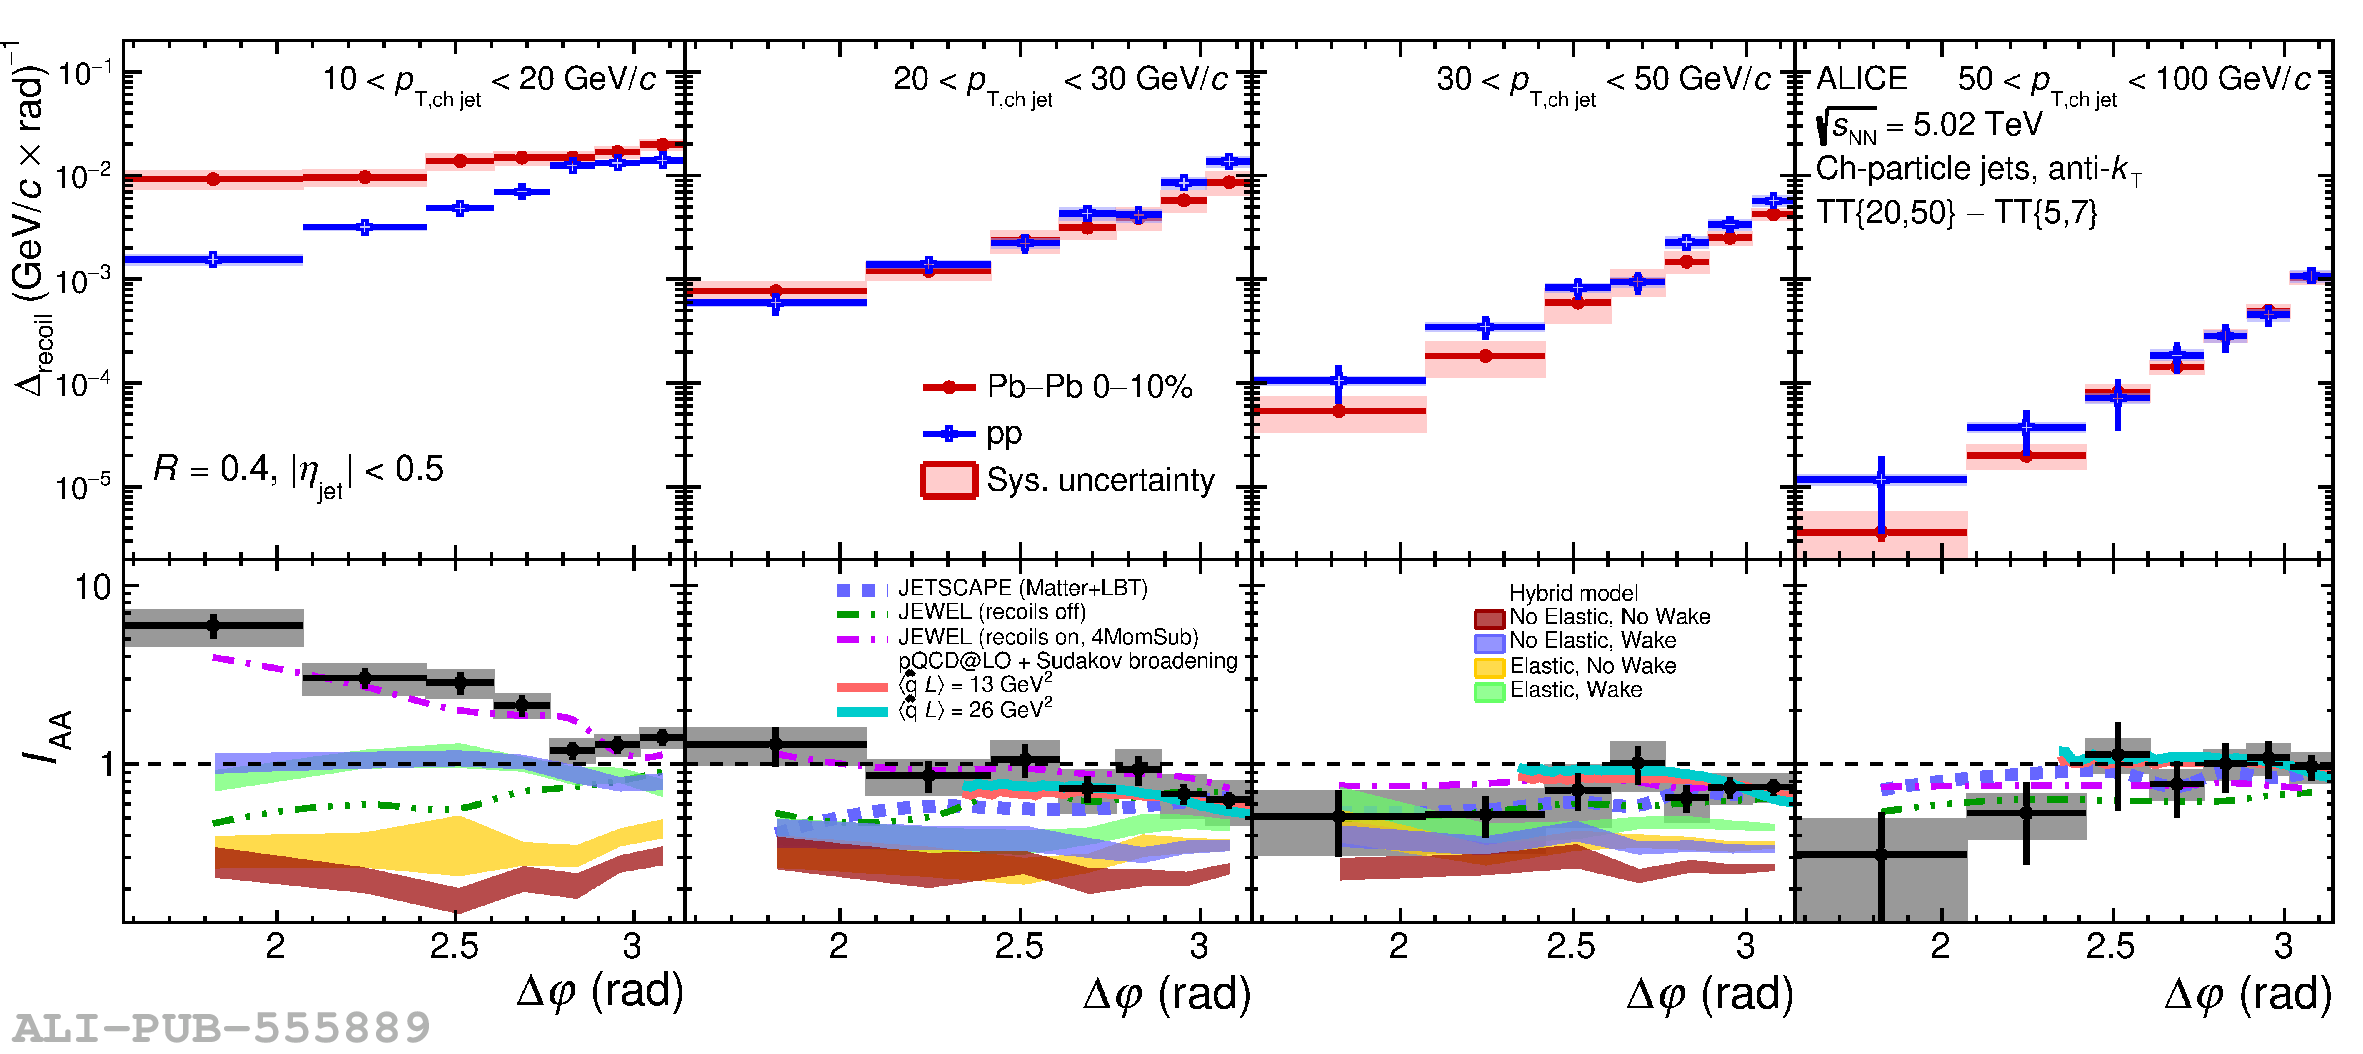

Figure 22
$I_{\rm AA}(p_{\rm T,\text{ch jet}})$ from the $\Delta_{\rm recoil}(p_{\rm T,jet})$ distributions and $\Delta_{\rm recoil}(\Delta\varphi)$ distributions projected within similar $\Delta\varphi$ intervals, measured for $R=0.2$ (top), 0.4 (middle), and 0.5 (bottom) in central Pb$-$Pb and pp collisions. |    |