Ratio of ${\rm TT_{sig}}$ and ${\rm TT_{ref}}$-selected distributions from Fig. 3, with the same panel layout. The horizontal dashed line and band show the value of $c_{\rm Ref}$ and its uncertainty. The vertical solid grey line is at $p_{\rm T,\text{ch jet}}^{\rm reco}=0$, and horizontal solid grey line is at unity. See text for details. | 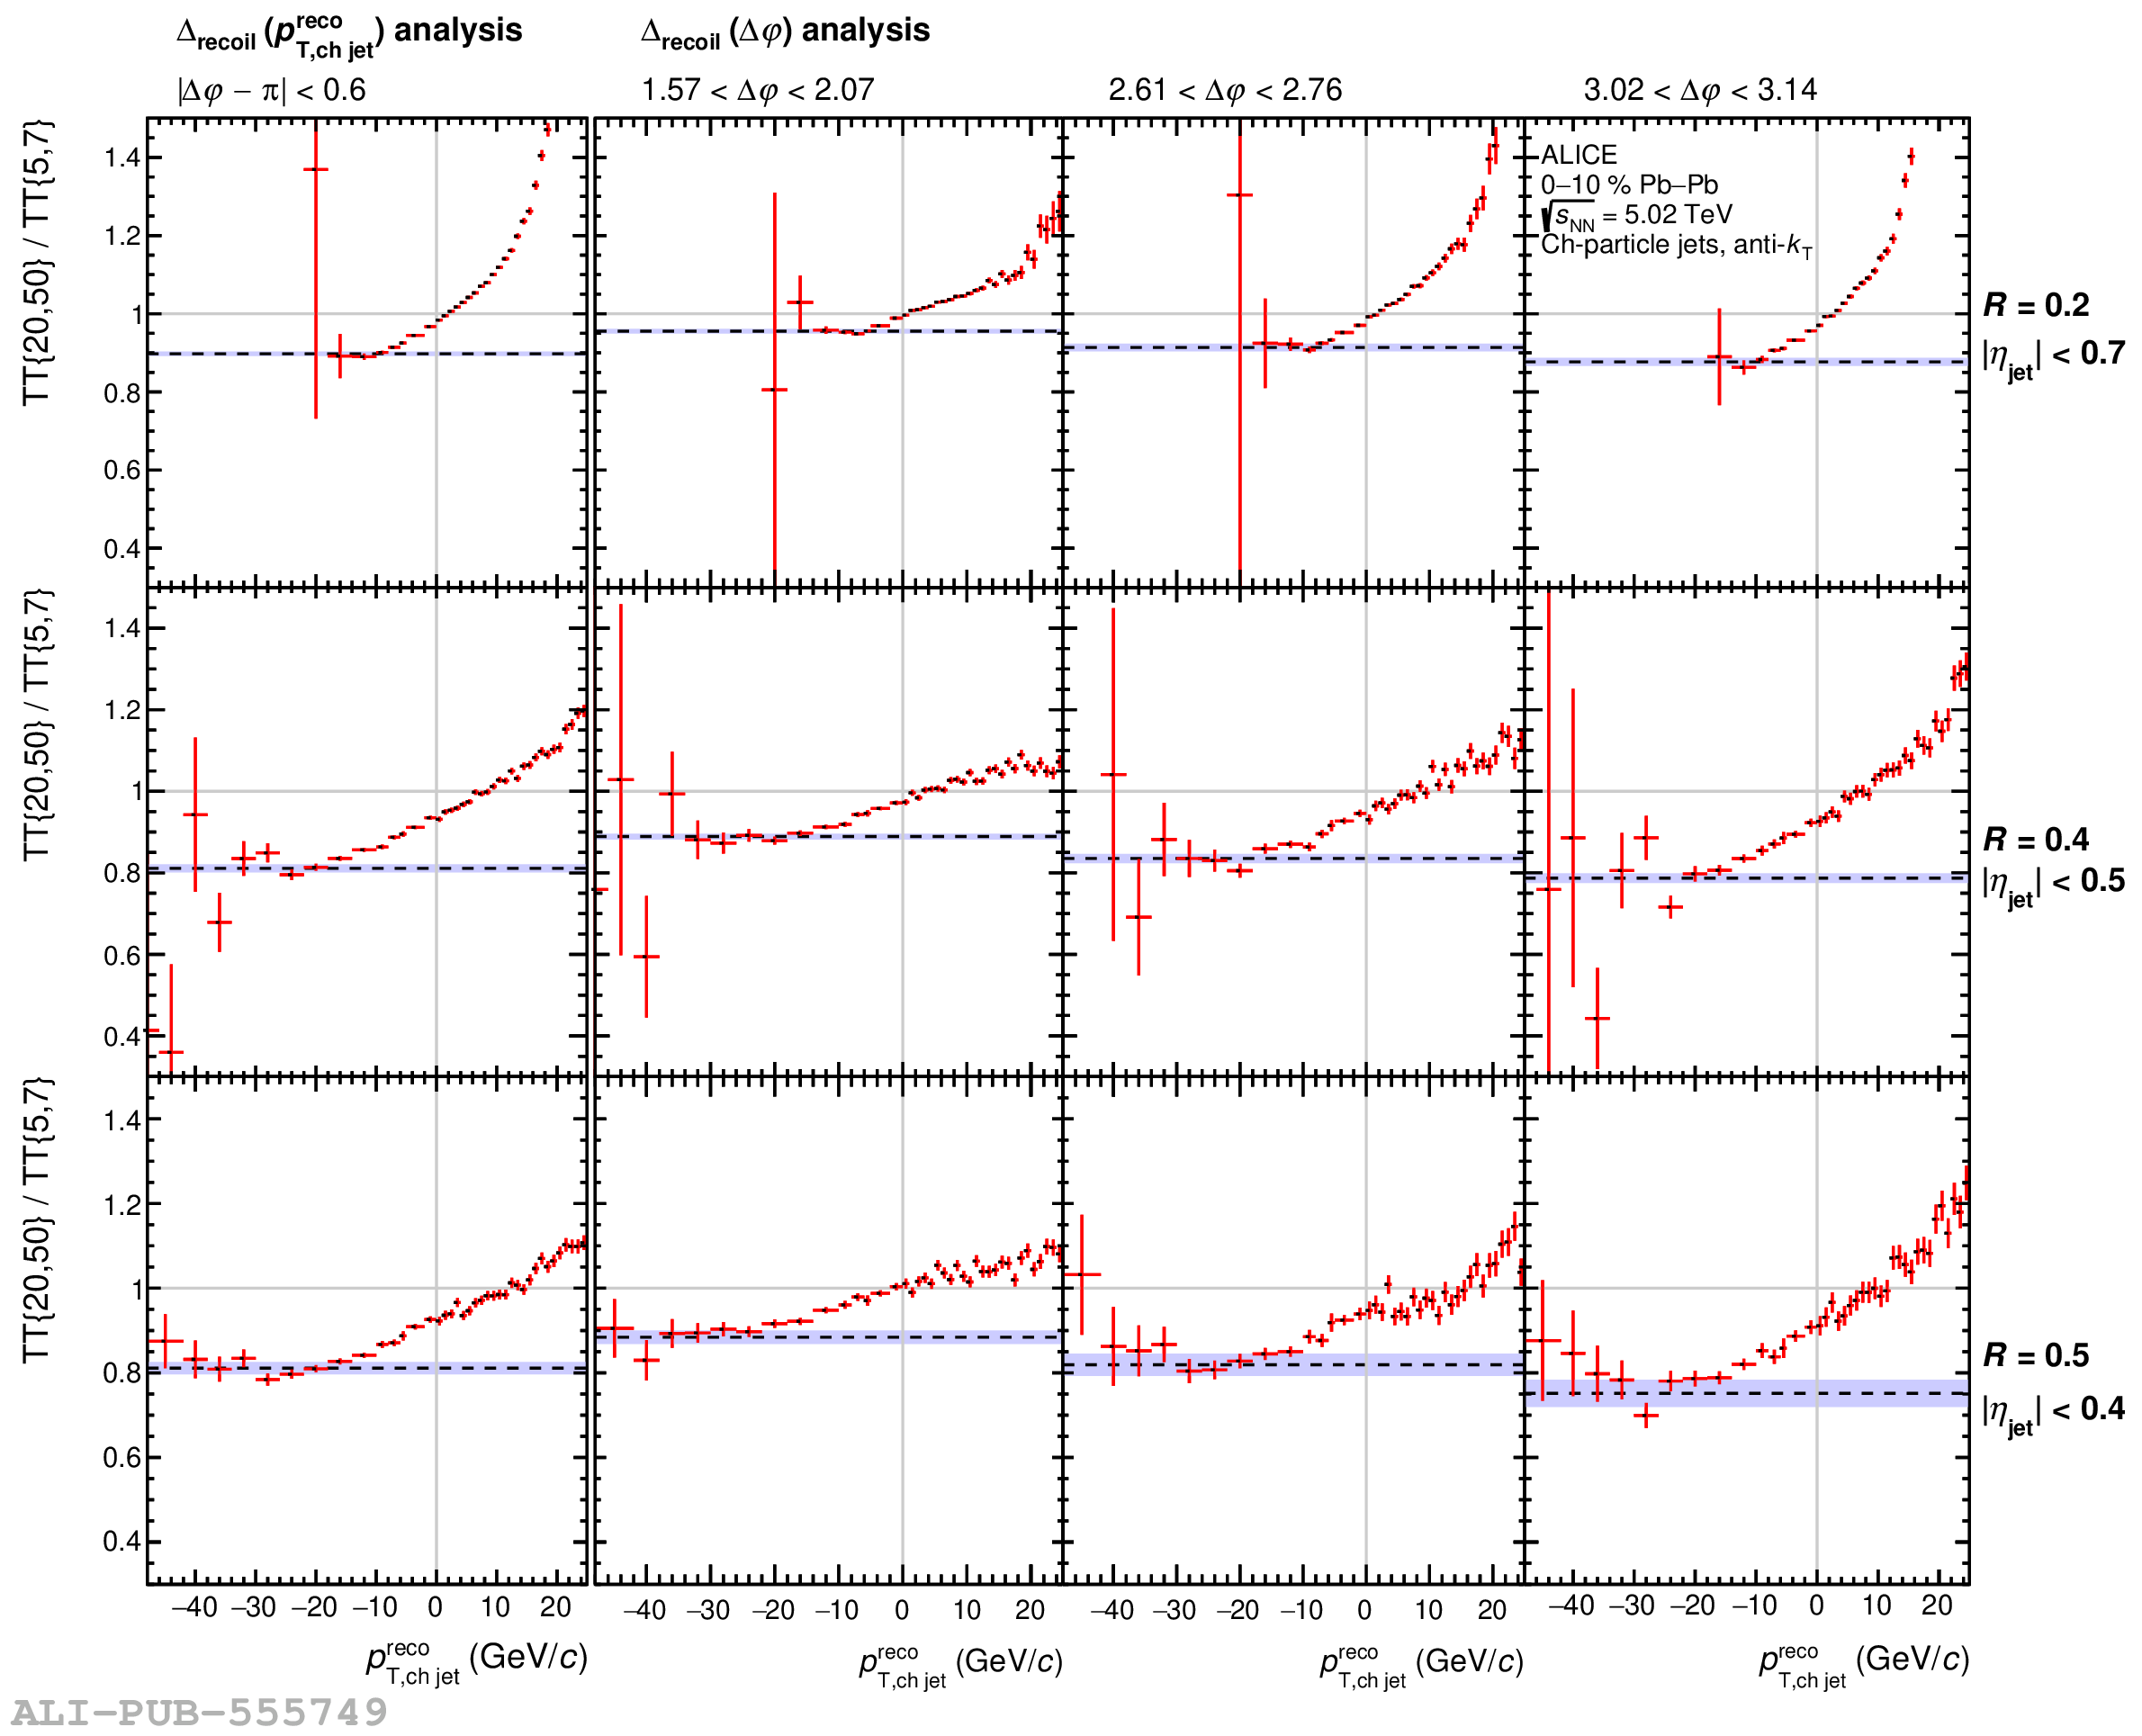 |