The Chiral Magnetic Wave (CMW) phenomenon is essential to provide insights into the strong interaction in QCD, the properties of the quark-gluon plasma, and the topological characteristics of the early universe, offering a deeper understanding of fundamental physics in high-energy collisions. Measurements of the charge-dependent anisotropic flow coefficients are studied in Pb-Pb collisions at center-of-mass energy per nucleon-nucleon collision $\sqrt{s_{\mathrm{NN}}}=$ 5.02 TeV to probe the CMW. In particular, the slope of the normalized difference in elliptic ($v_{2}$) and triangular ($v_{3}$) flow coefficients of positively and negatively charged particles as a function of their event-wise normalized number difference, is reported for inclusive and identified particles. The slope $r_{3}^{\rm Norm}$ is found to be larger than zero and to have a magnitude similar to $r_{2}^{\rm Norm}$, thus pointing to a large background contribution for these measurements. Furthermore, $r_{2}^{\rm Norm}$ can be described by a blast wave model calculation that incorporates local charge conservation. In addition, using the event shape engineering technique yields a fraction of CMW ($f_{\rm CMW}$) contribution to this measurement which is compatible with zero. This measurement provides the very first upper limit for $f_{\rm CMW}$, and in the 10-60% centrality interval it is found to be 26% (38%) at 95% (99.7%) confidence level.
JHEP 12 (2023) 067
HEP Data
e-Print: arXiv:2308.16123 | PDF | inSPIRE
CERN-EP-2023-191
Figure group
Figure 1
(Left panel): Raw $A_{\rm ch}$ distribution in Pb-Pb collisions at $\sqrt{s_{\rm NN}}$ = 5.02 TeV for the 40-50% centrality interval. Red dotted lines depict the edges of the ten $A_{\rm ch}$ classes. (Right panel): Correlation between true and raw $A_{\rm ch}$ obtained from HIJING simulations combined with a GEANT3 detector model for Pb-Pb collisions at $\sqrt{s_{\rm NN}}$ = 5.02 TeV in the 40--50% centrality interval. | 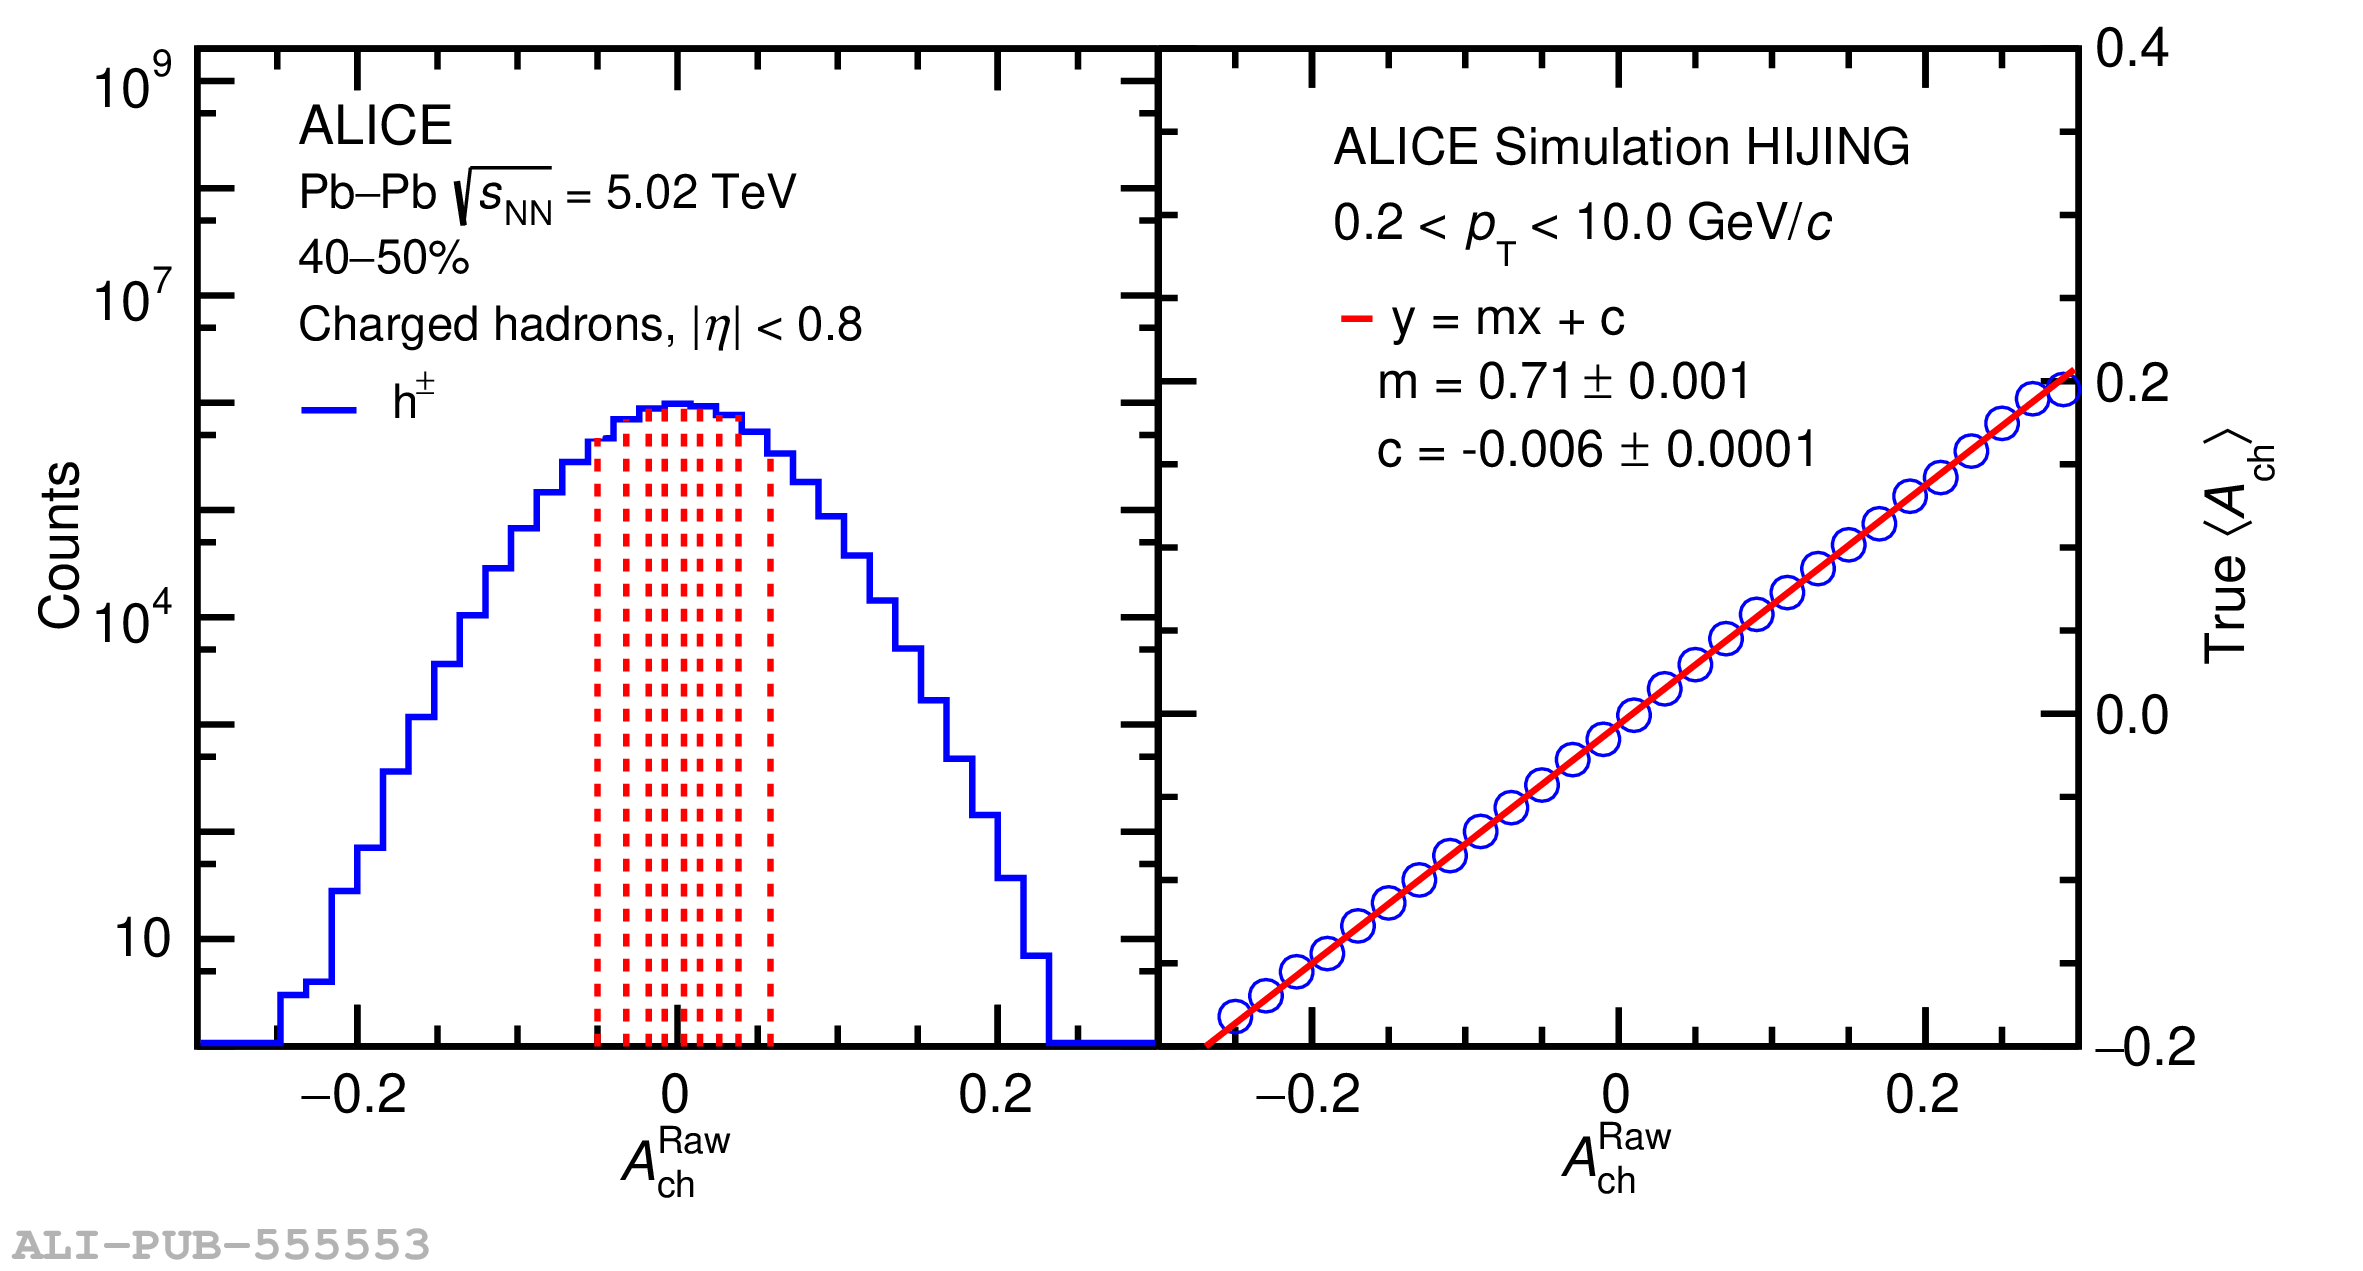 |
Figure 2
The top left panel shows the $v_2$ of positively (red markers) and negatively (blue markers) charged hadrons as a function of the corrected $A_{\rm ch}$, while the top right panel shows the same for $v_3$. Statistical uncertainties are shown by bars and uncorrelated (correlated) systematic uncertainties by open boxes (shaded bands). The bottom left panel shows $\Delta v_{2}/\langle v_{2} \rangle $ as a function of the corrected \Ach\xspace and bottom right panel shows the same for $\Delta v_{3}/\langle v_{3} \rangle $, all for the 40-50% centrality interval in Pb$-$Pb collisions at $\sqrt{s_{\rm NN}}$ = 5.02 TeV. The dotted blue line shows the linear fit to the data points to obtain the values of normalized slopes ($r^{\rm Norm}_2$ and $r^{\rm Norm}_3$). | 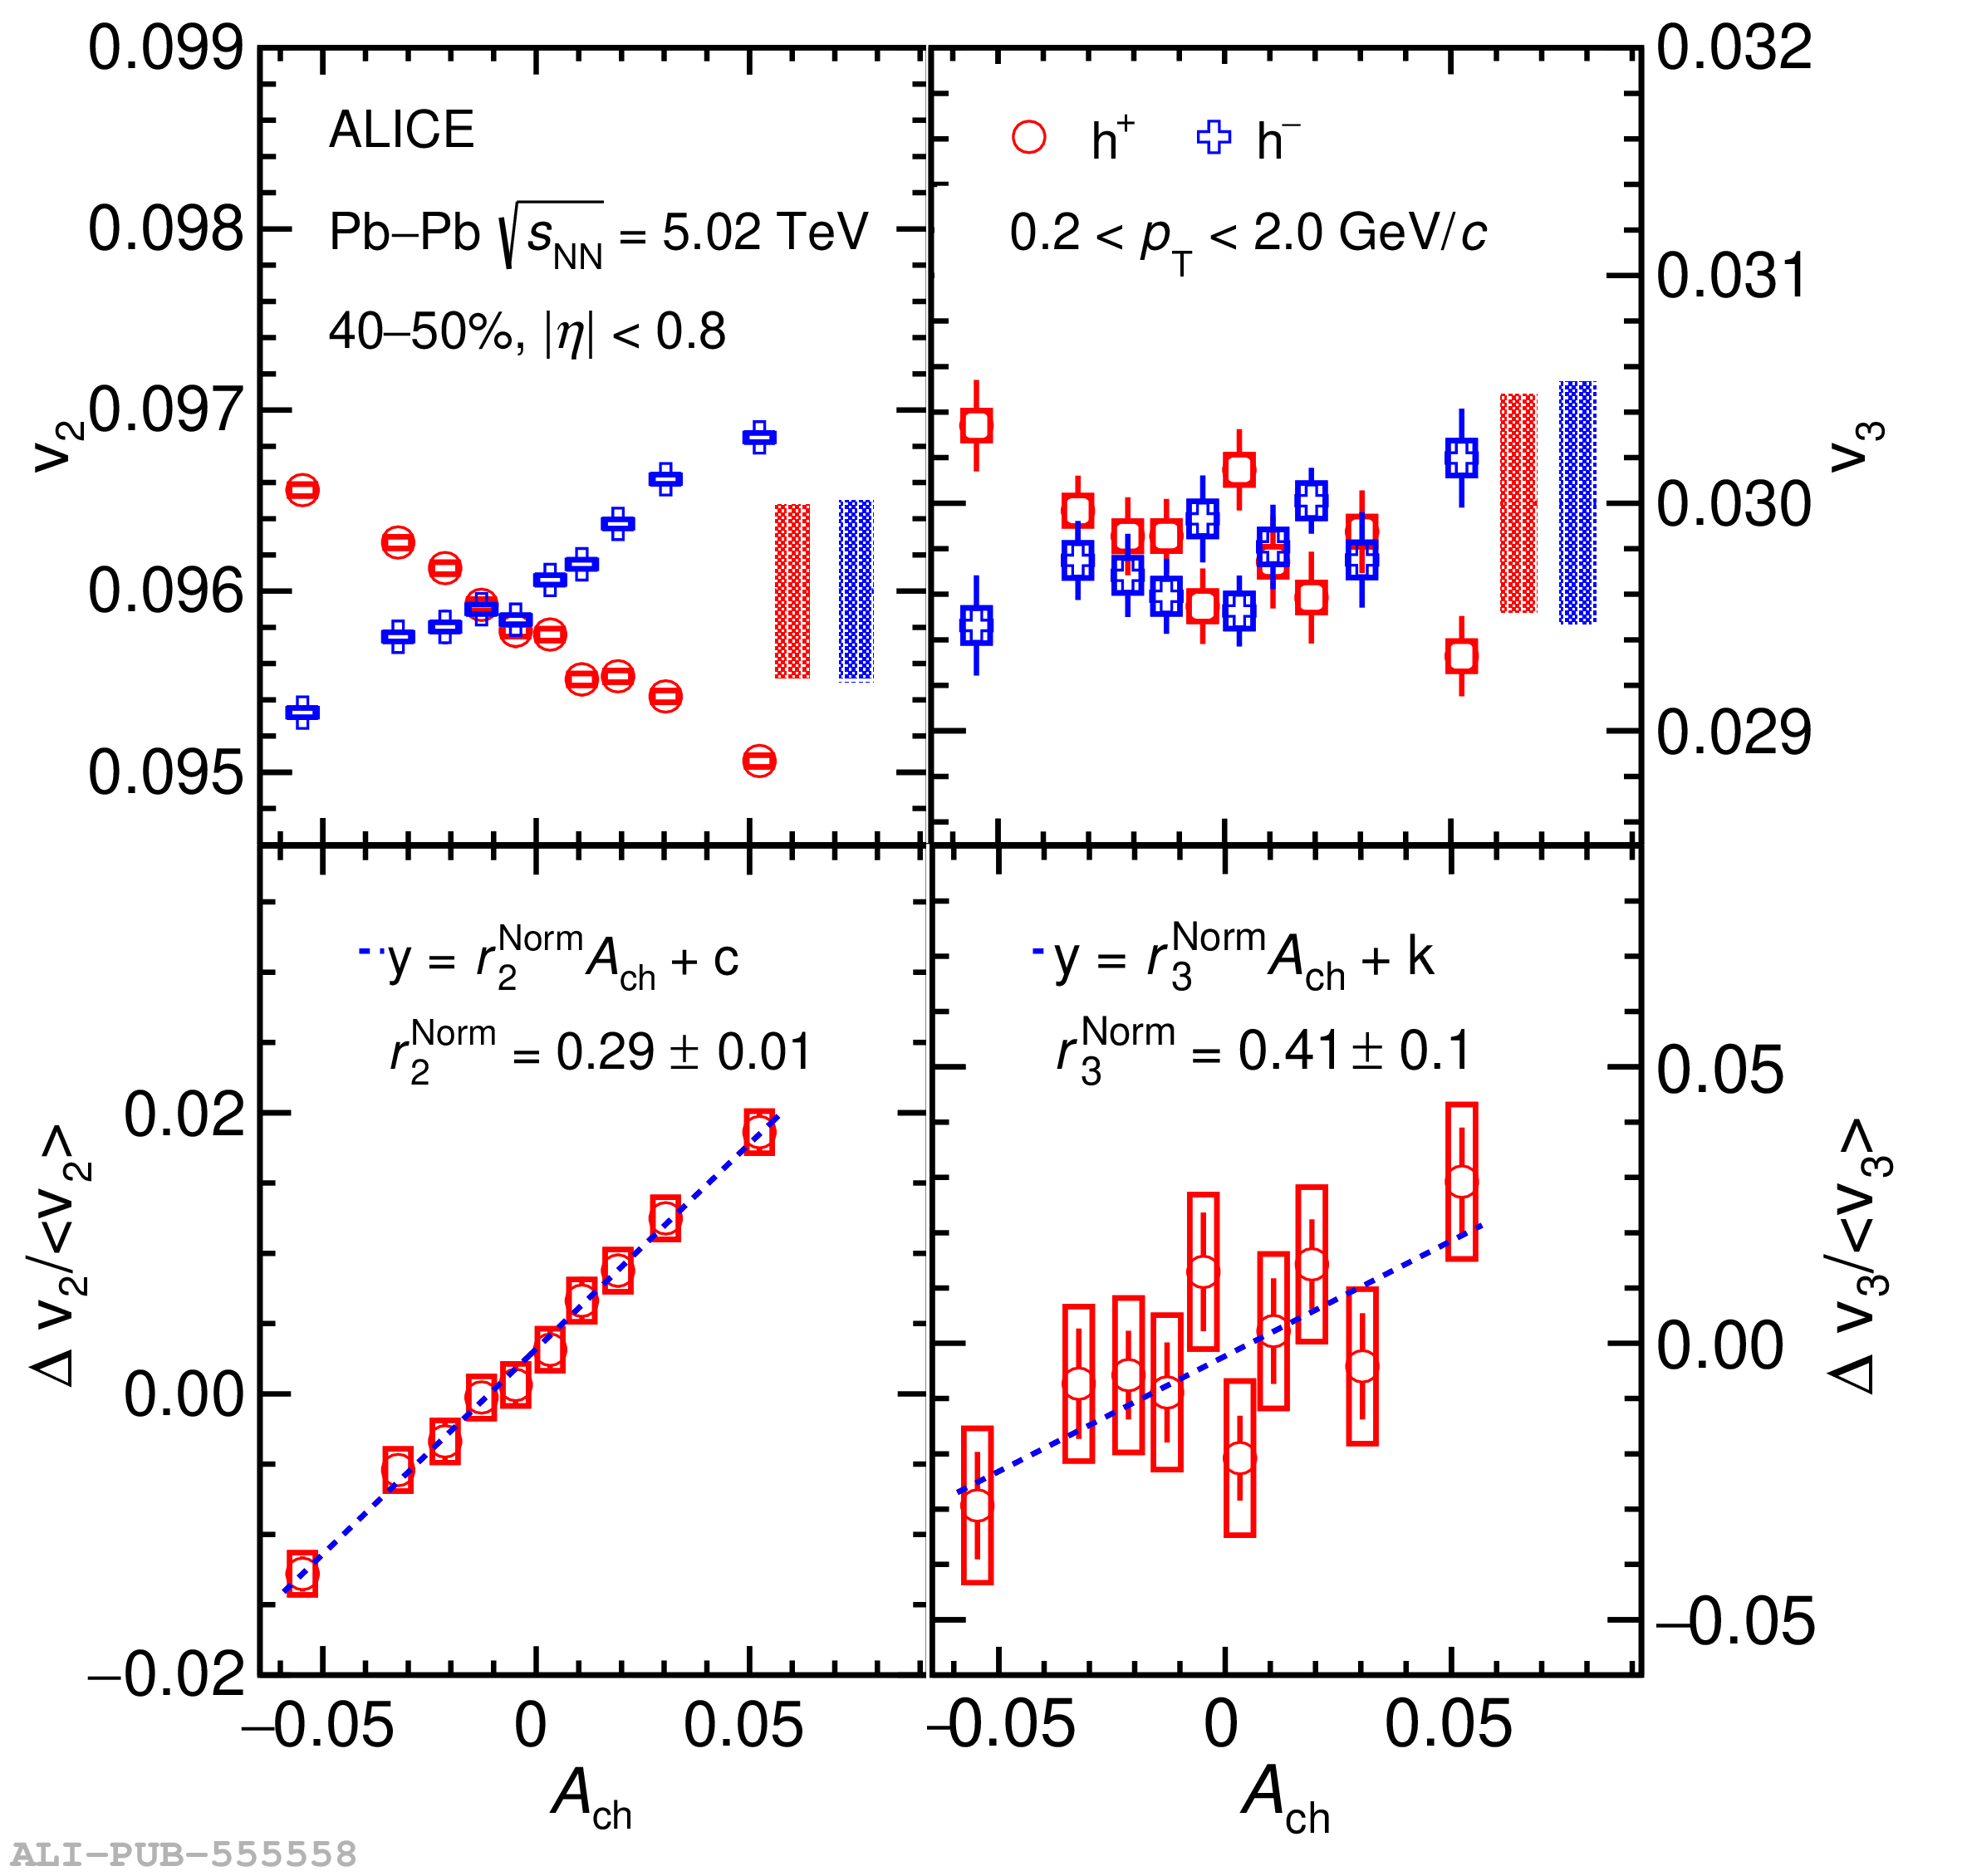 |
Figure 3
Centrality dependence of normalized slopes $r^{\rm Norm}_2$ and $r^{\rm Norm}_3$ for inclusive charged hadrons in Pb$-$Pb collisions at $\sqrt{s_{\rm NN}}$ = 5.02 TeV compared with CMS results and a BW+LCC model calculation . Statistical (systematic) uncertainties are depicted by bars (boxes). ALICE $r^{\rm Norm}_2$ and $r^{\rm Norm}_3$ and CMS $r^{\rm Norm}_2$ data points are slightly shifted horizontally for visibility. | 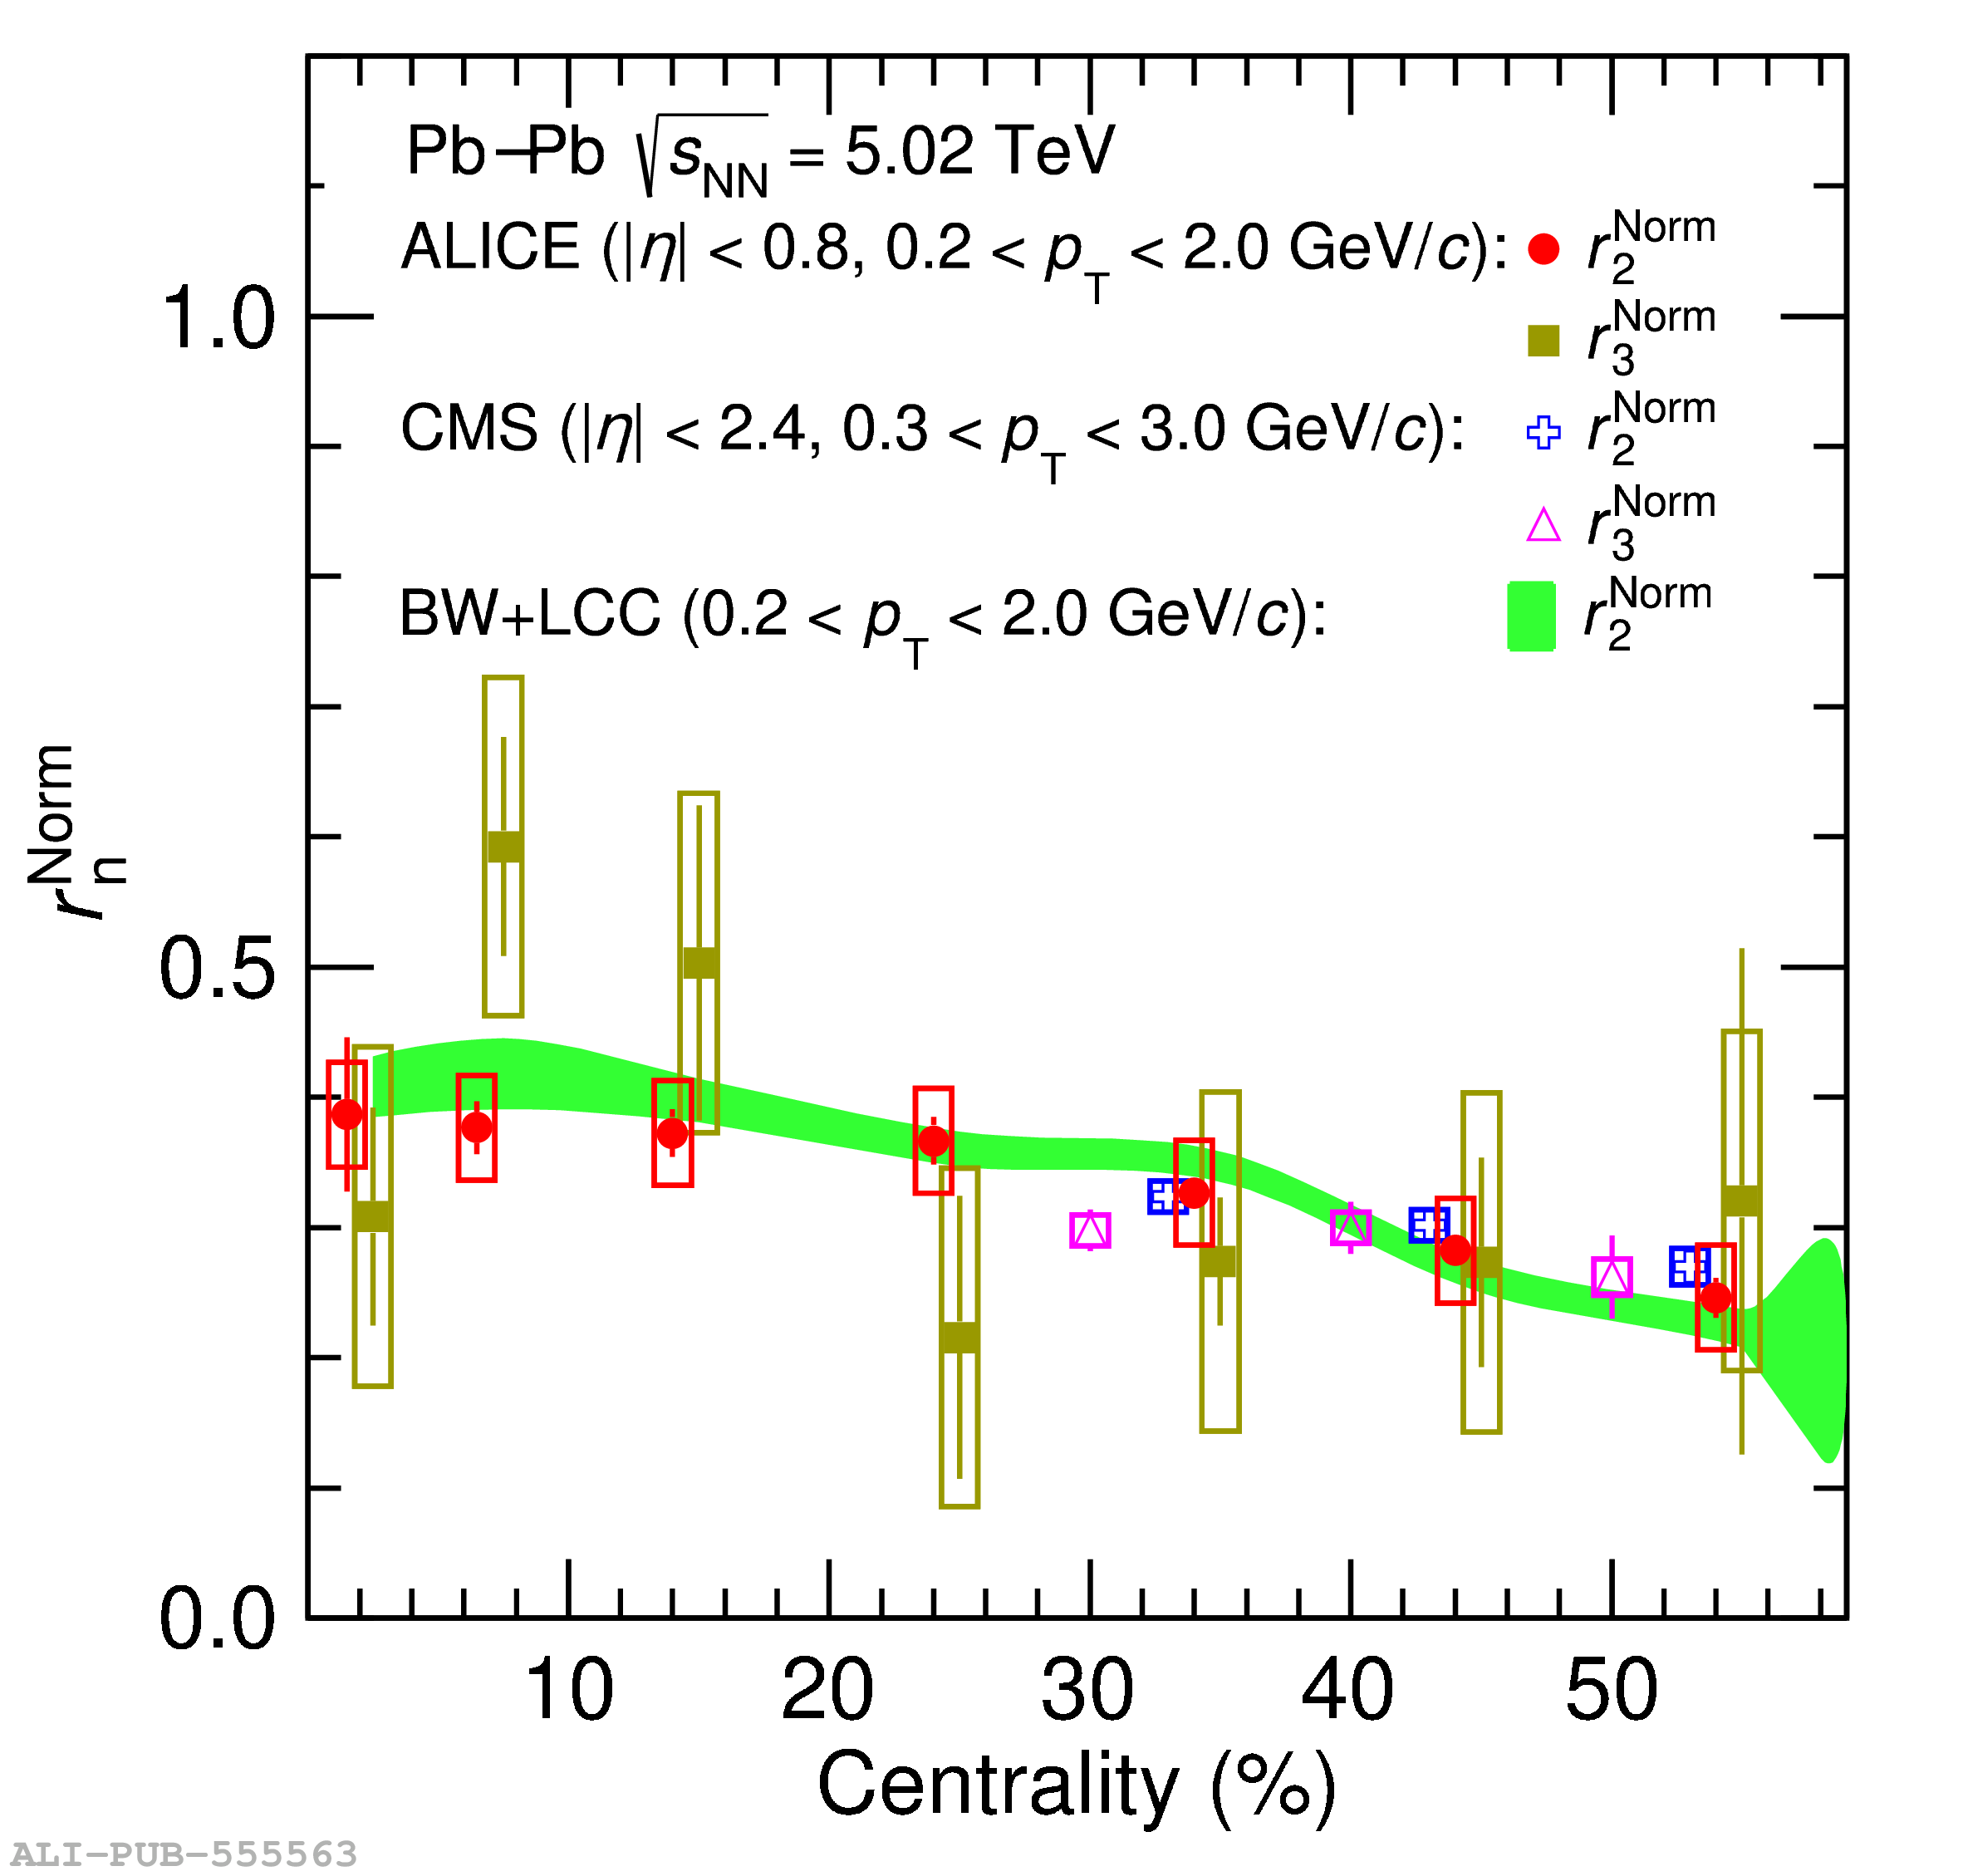 |
Figure 4
Centrality dependence of normalized slopes $r^{\rm Norm}_2$ (left panel) and $r^{\rm Norm}_3$ (right panel) for inclusive and identified charged hadrons in Pb-Pb collisions at $\sqrt{s_{\rm NN}}$ = 5.02 TeV. Statistical (systematic) uncertainties are depicted by bars (boxes). The data points for charged pions and kaons are slightly shifted horizontally for visibility. | 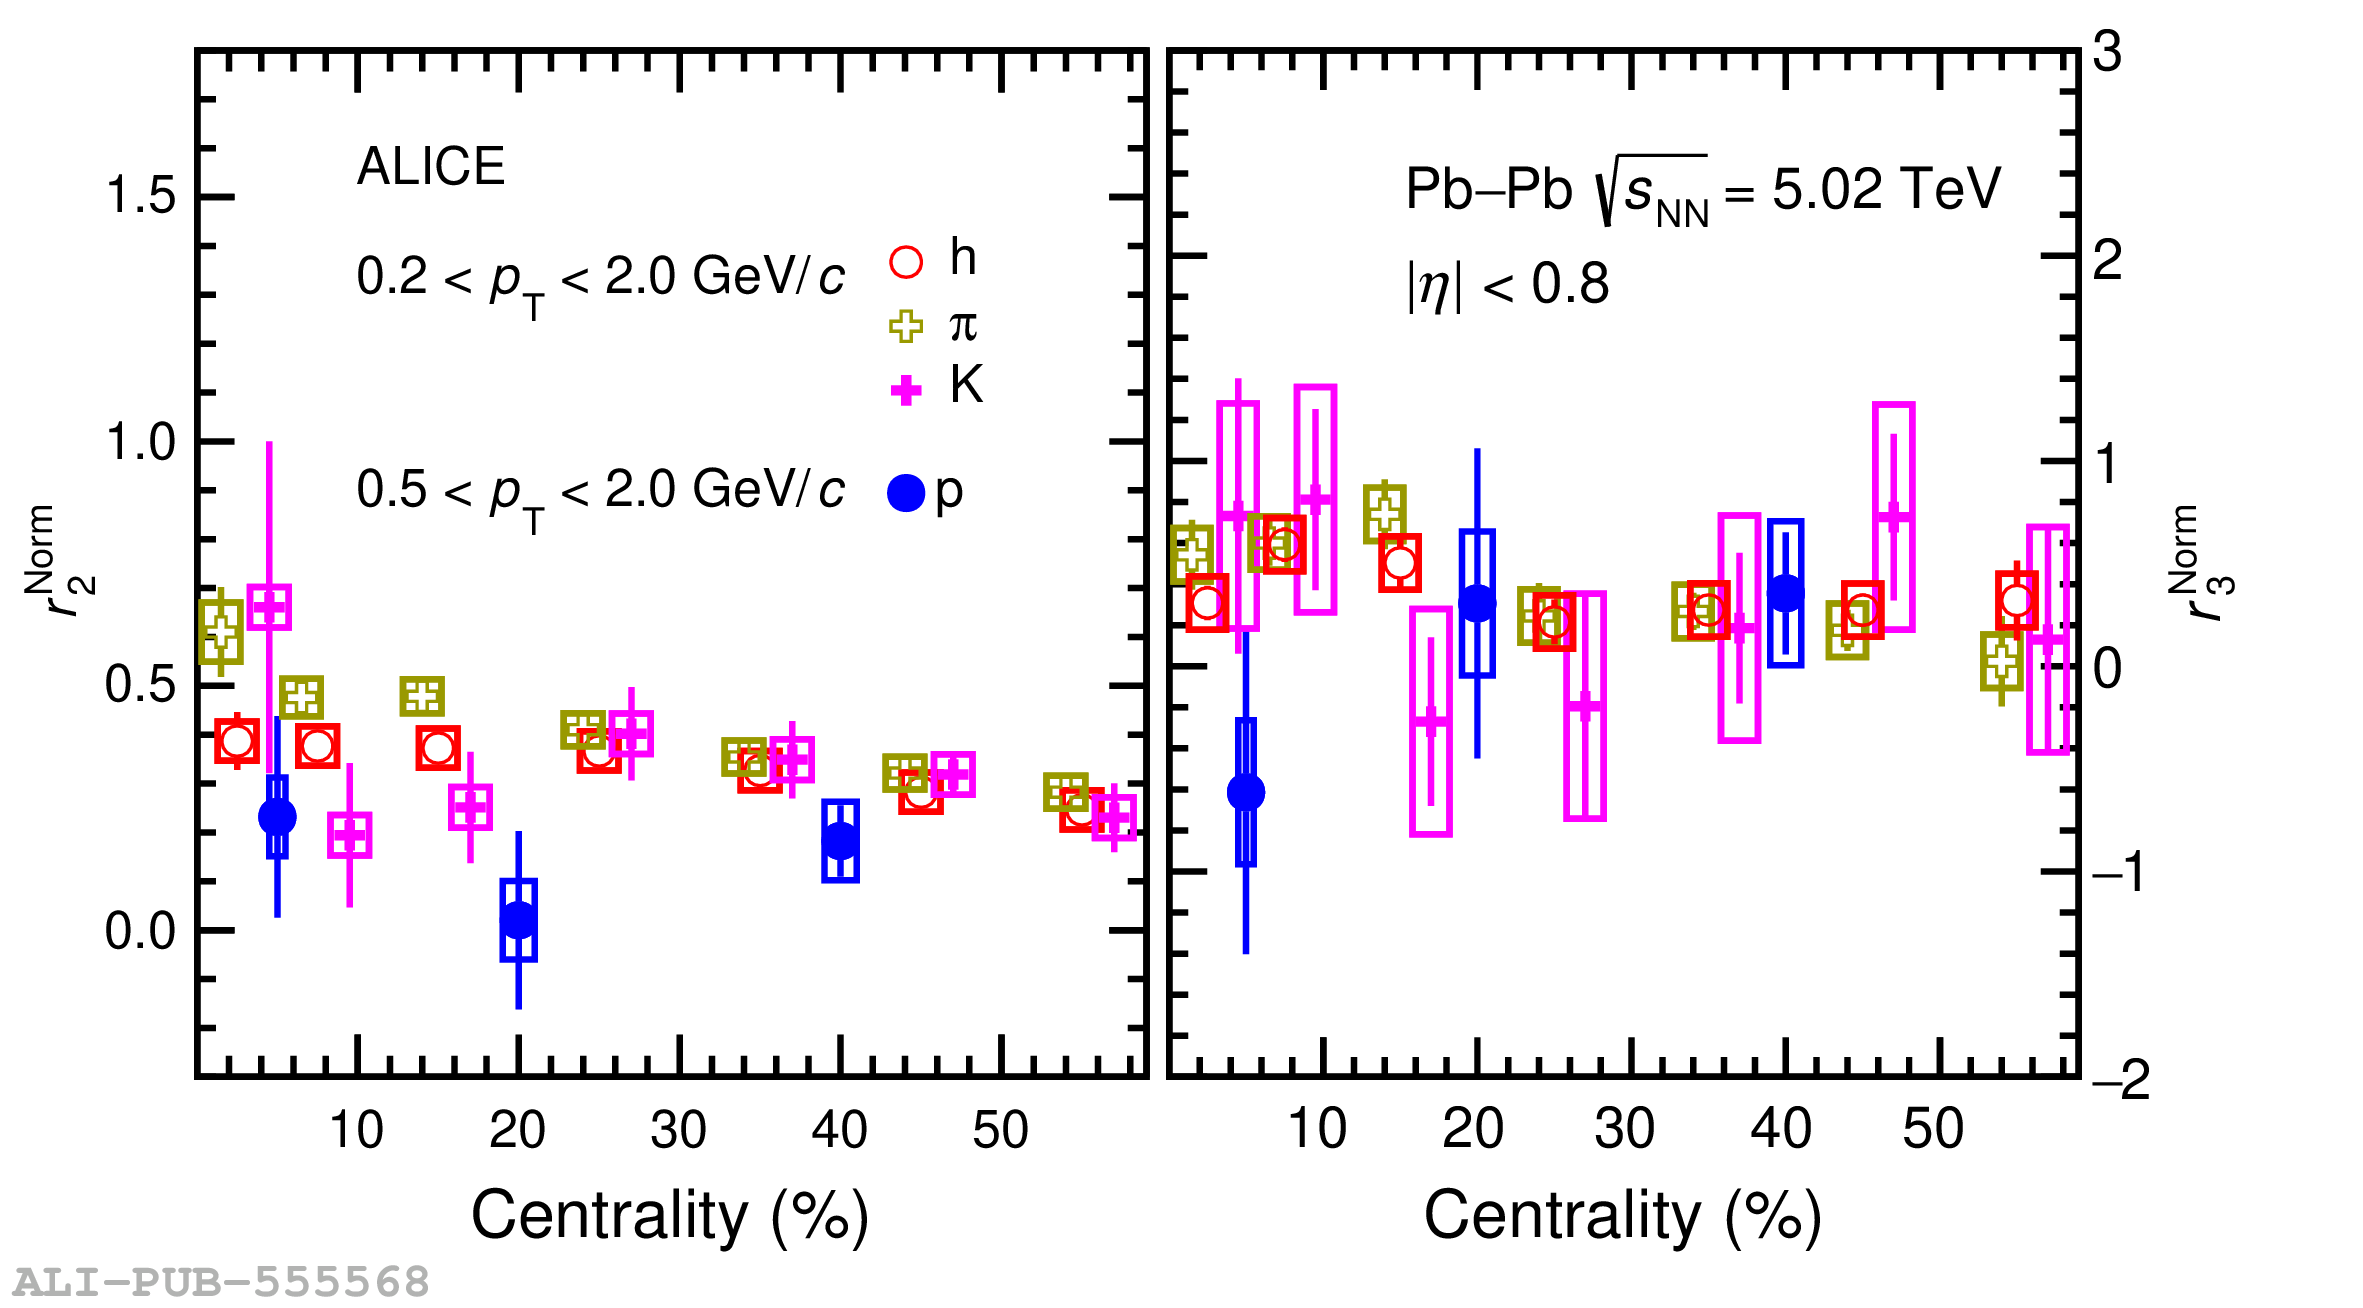 |
Figure 5
Dependence of $\Delta\rm{IC}$ on $v_2$ of shape-selected events from the 0-10% (top left panel) to the 50-60% (bottom right panel) centrality intervals of Pb-Pb collisions at $\sqrt{s_{\rm NN}}$ = 5.02 TeV. The solid lines are straight line fit to the data points. Only statistical uncertainties are shown. The bands represent the three standard deviation uncertainties from the linear fit. | 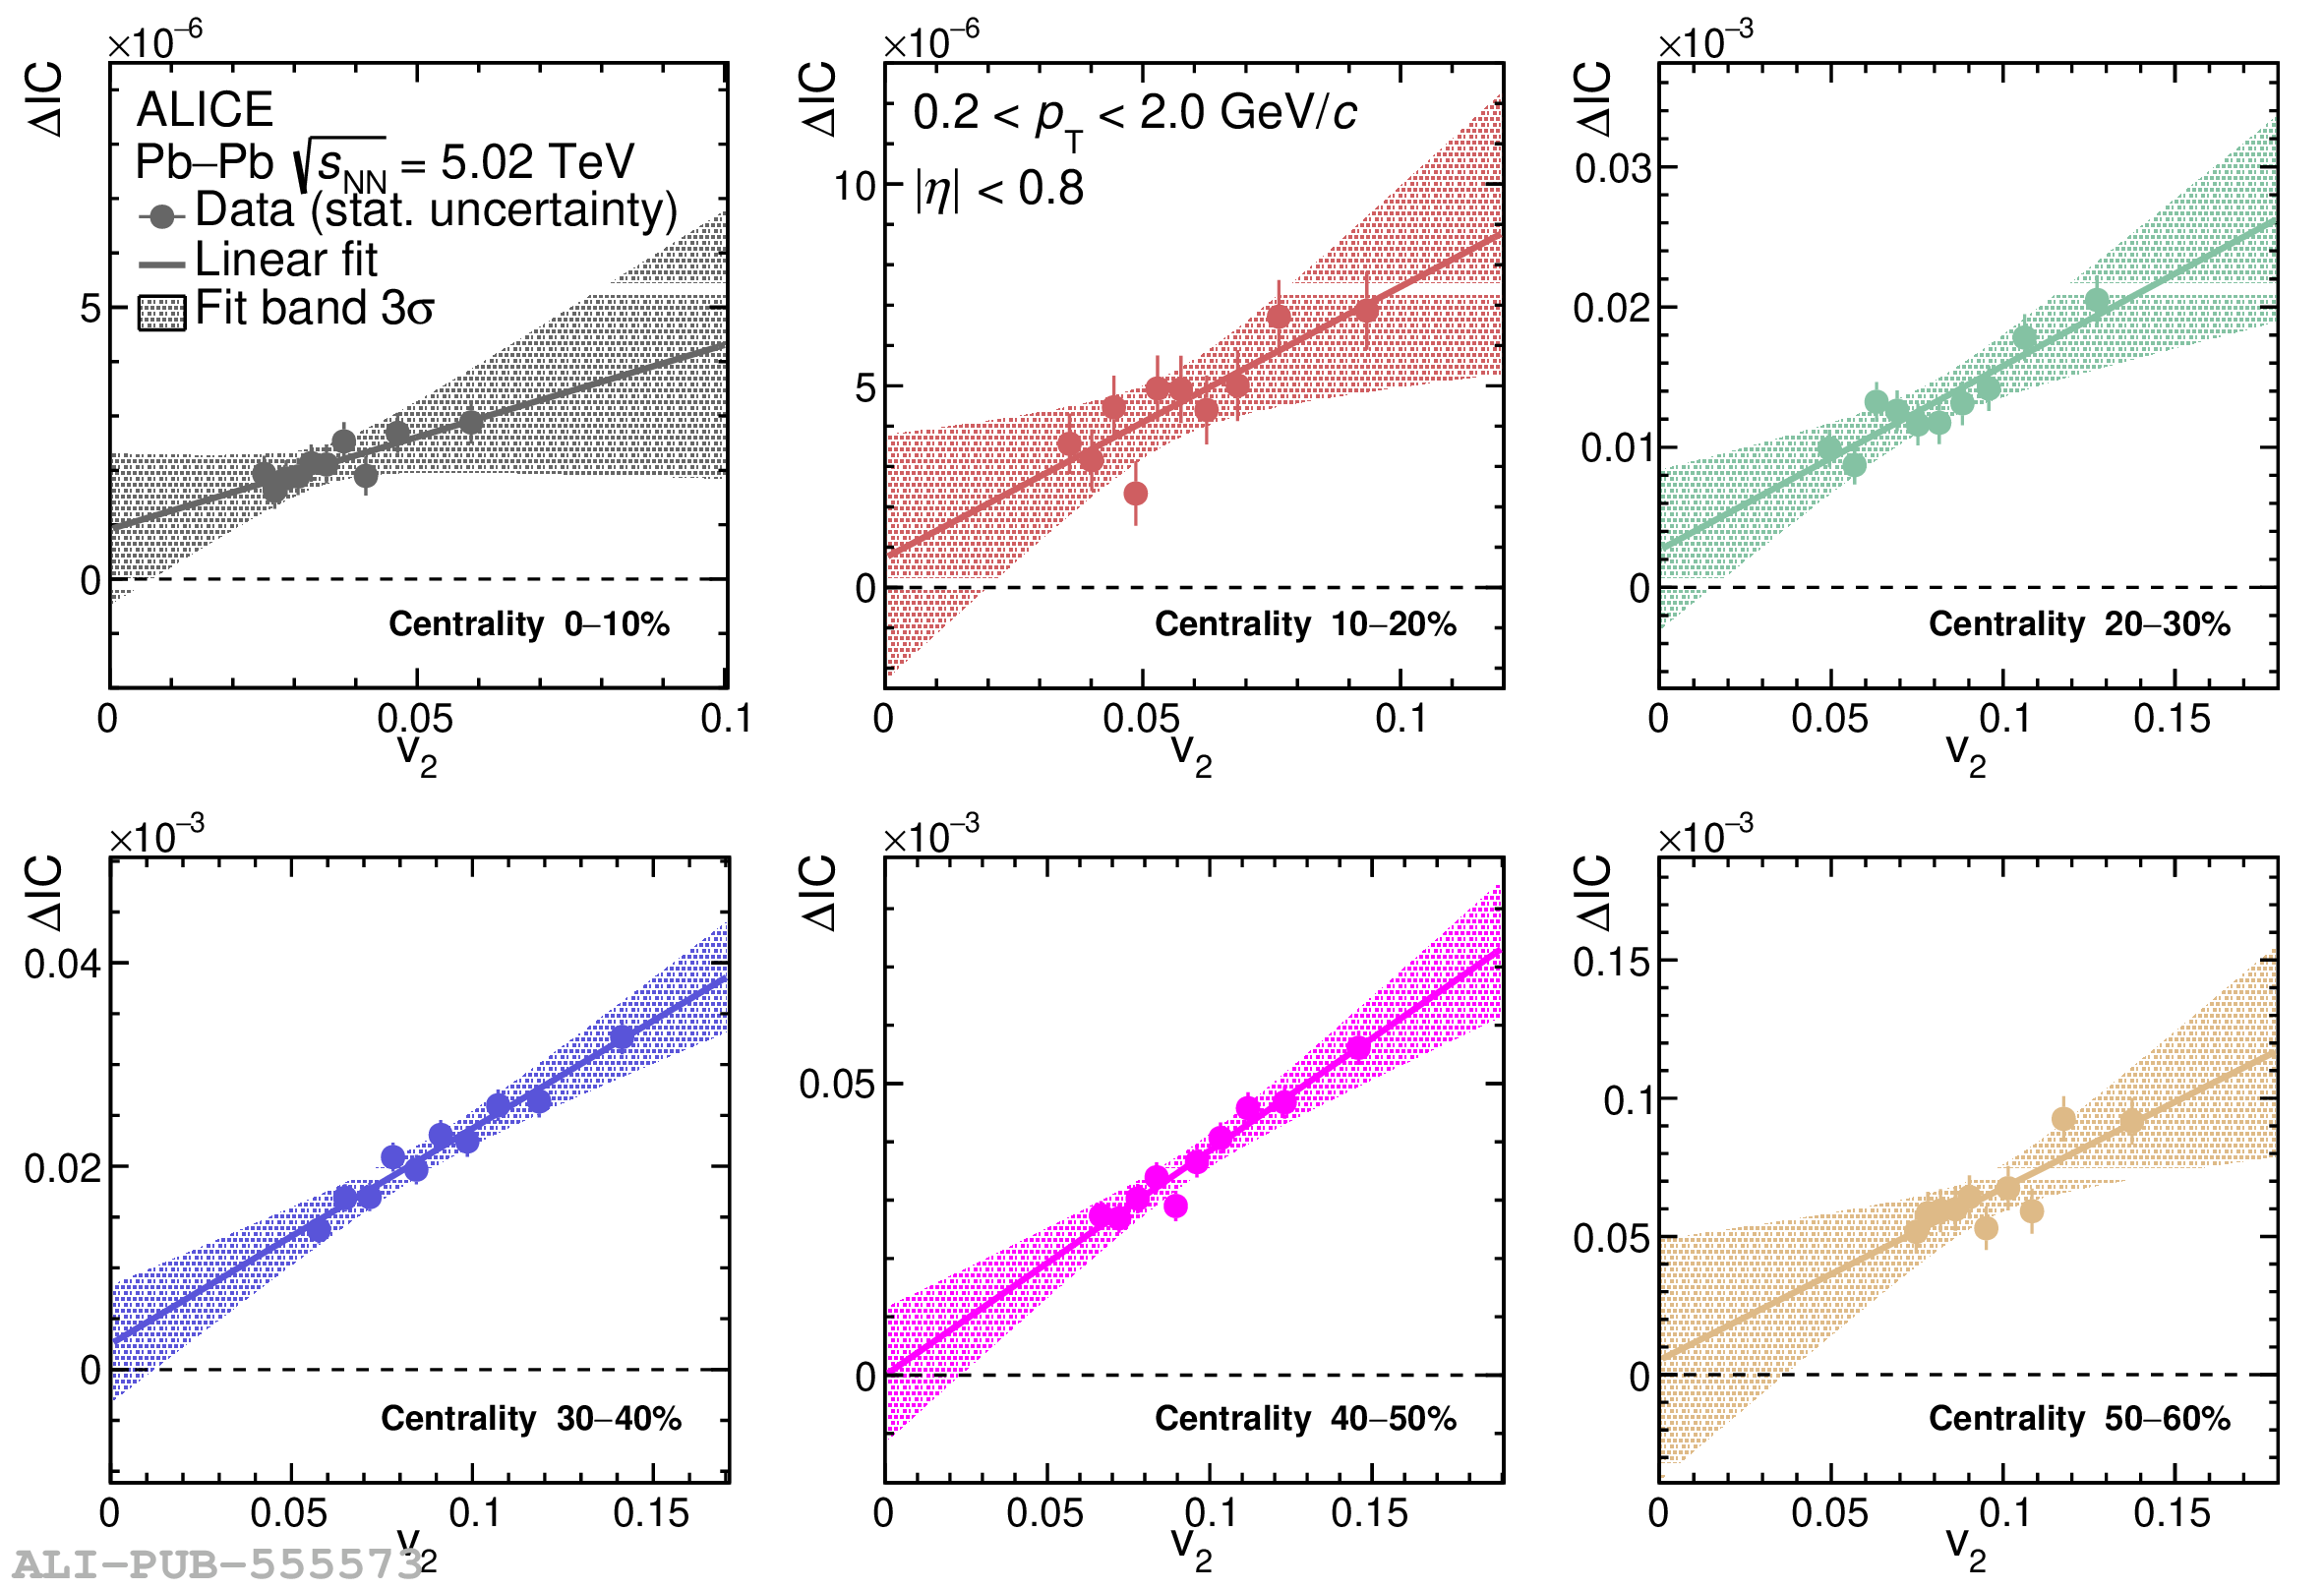 |
Figure 6
Centrality dependence of the extracted CMW fraction. The 95% confidence level of the upper limit is also shown by the dotted magenta line. Statistical uncertainties are depicted by bars, while the correlated systematic uncertainty is represented by a shaded band on the right edge. The blue line is the constant fit line of the data points points. | 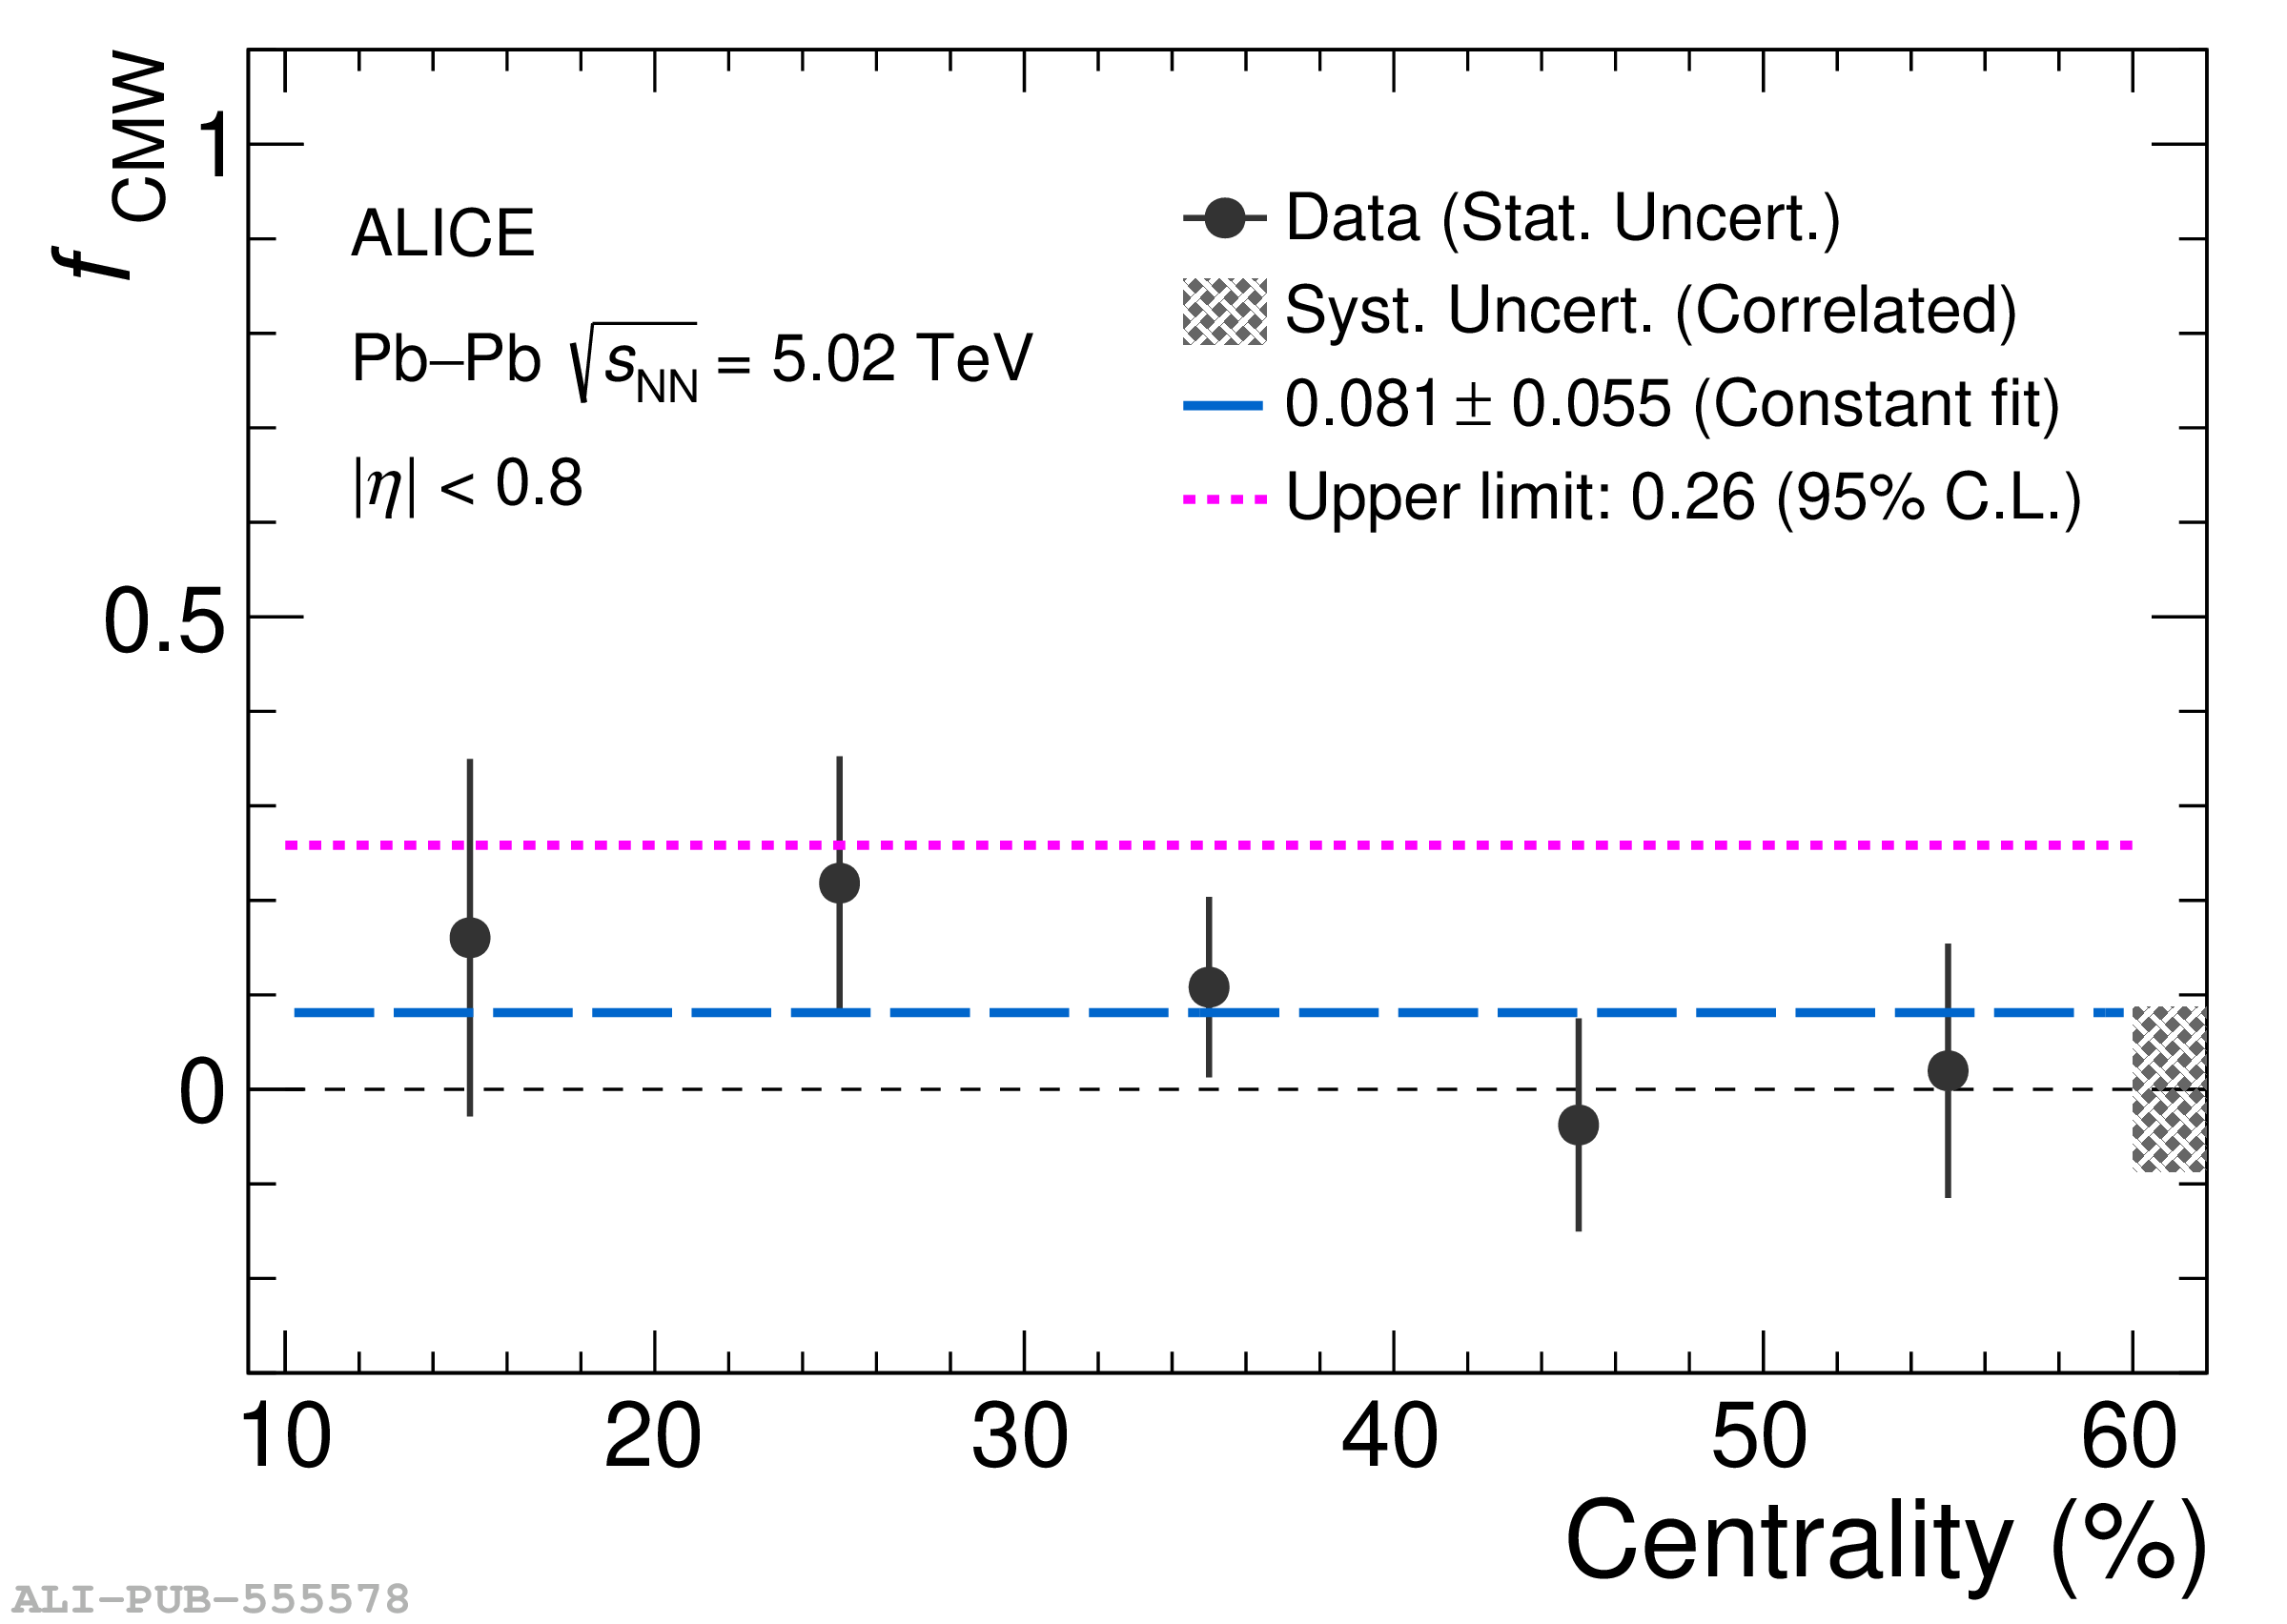 |