Dependence of $\Delta\rm{IC}$ on $v_2$ of shape-selected events from the 0-10% (top left panel) to the 50-60% (bottom right panel) centrality intervals of Pb-Pb collisions at $\sqrt{s_{\rm NN}}$ = 5.02 TeV. The solid lines are straight line fit to the data points. Only statistical uncertainties are shown. The bands represent the three standard deviation uncertainties from the linear fit. | 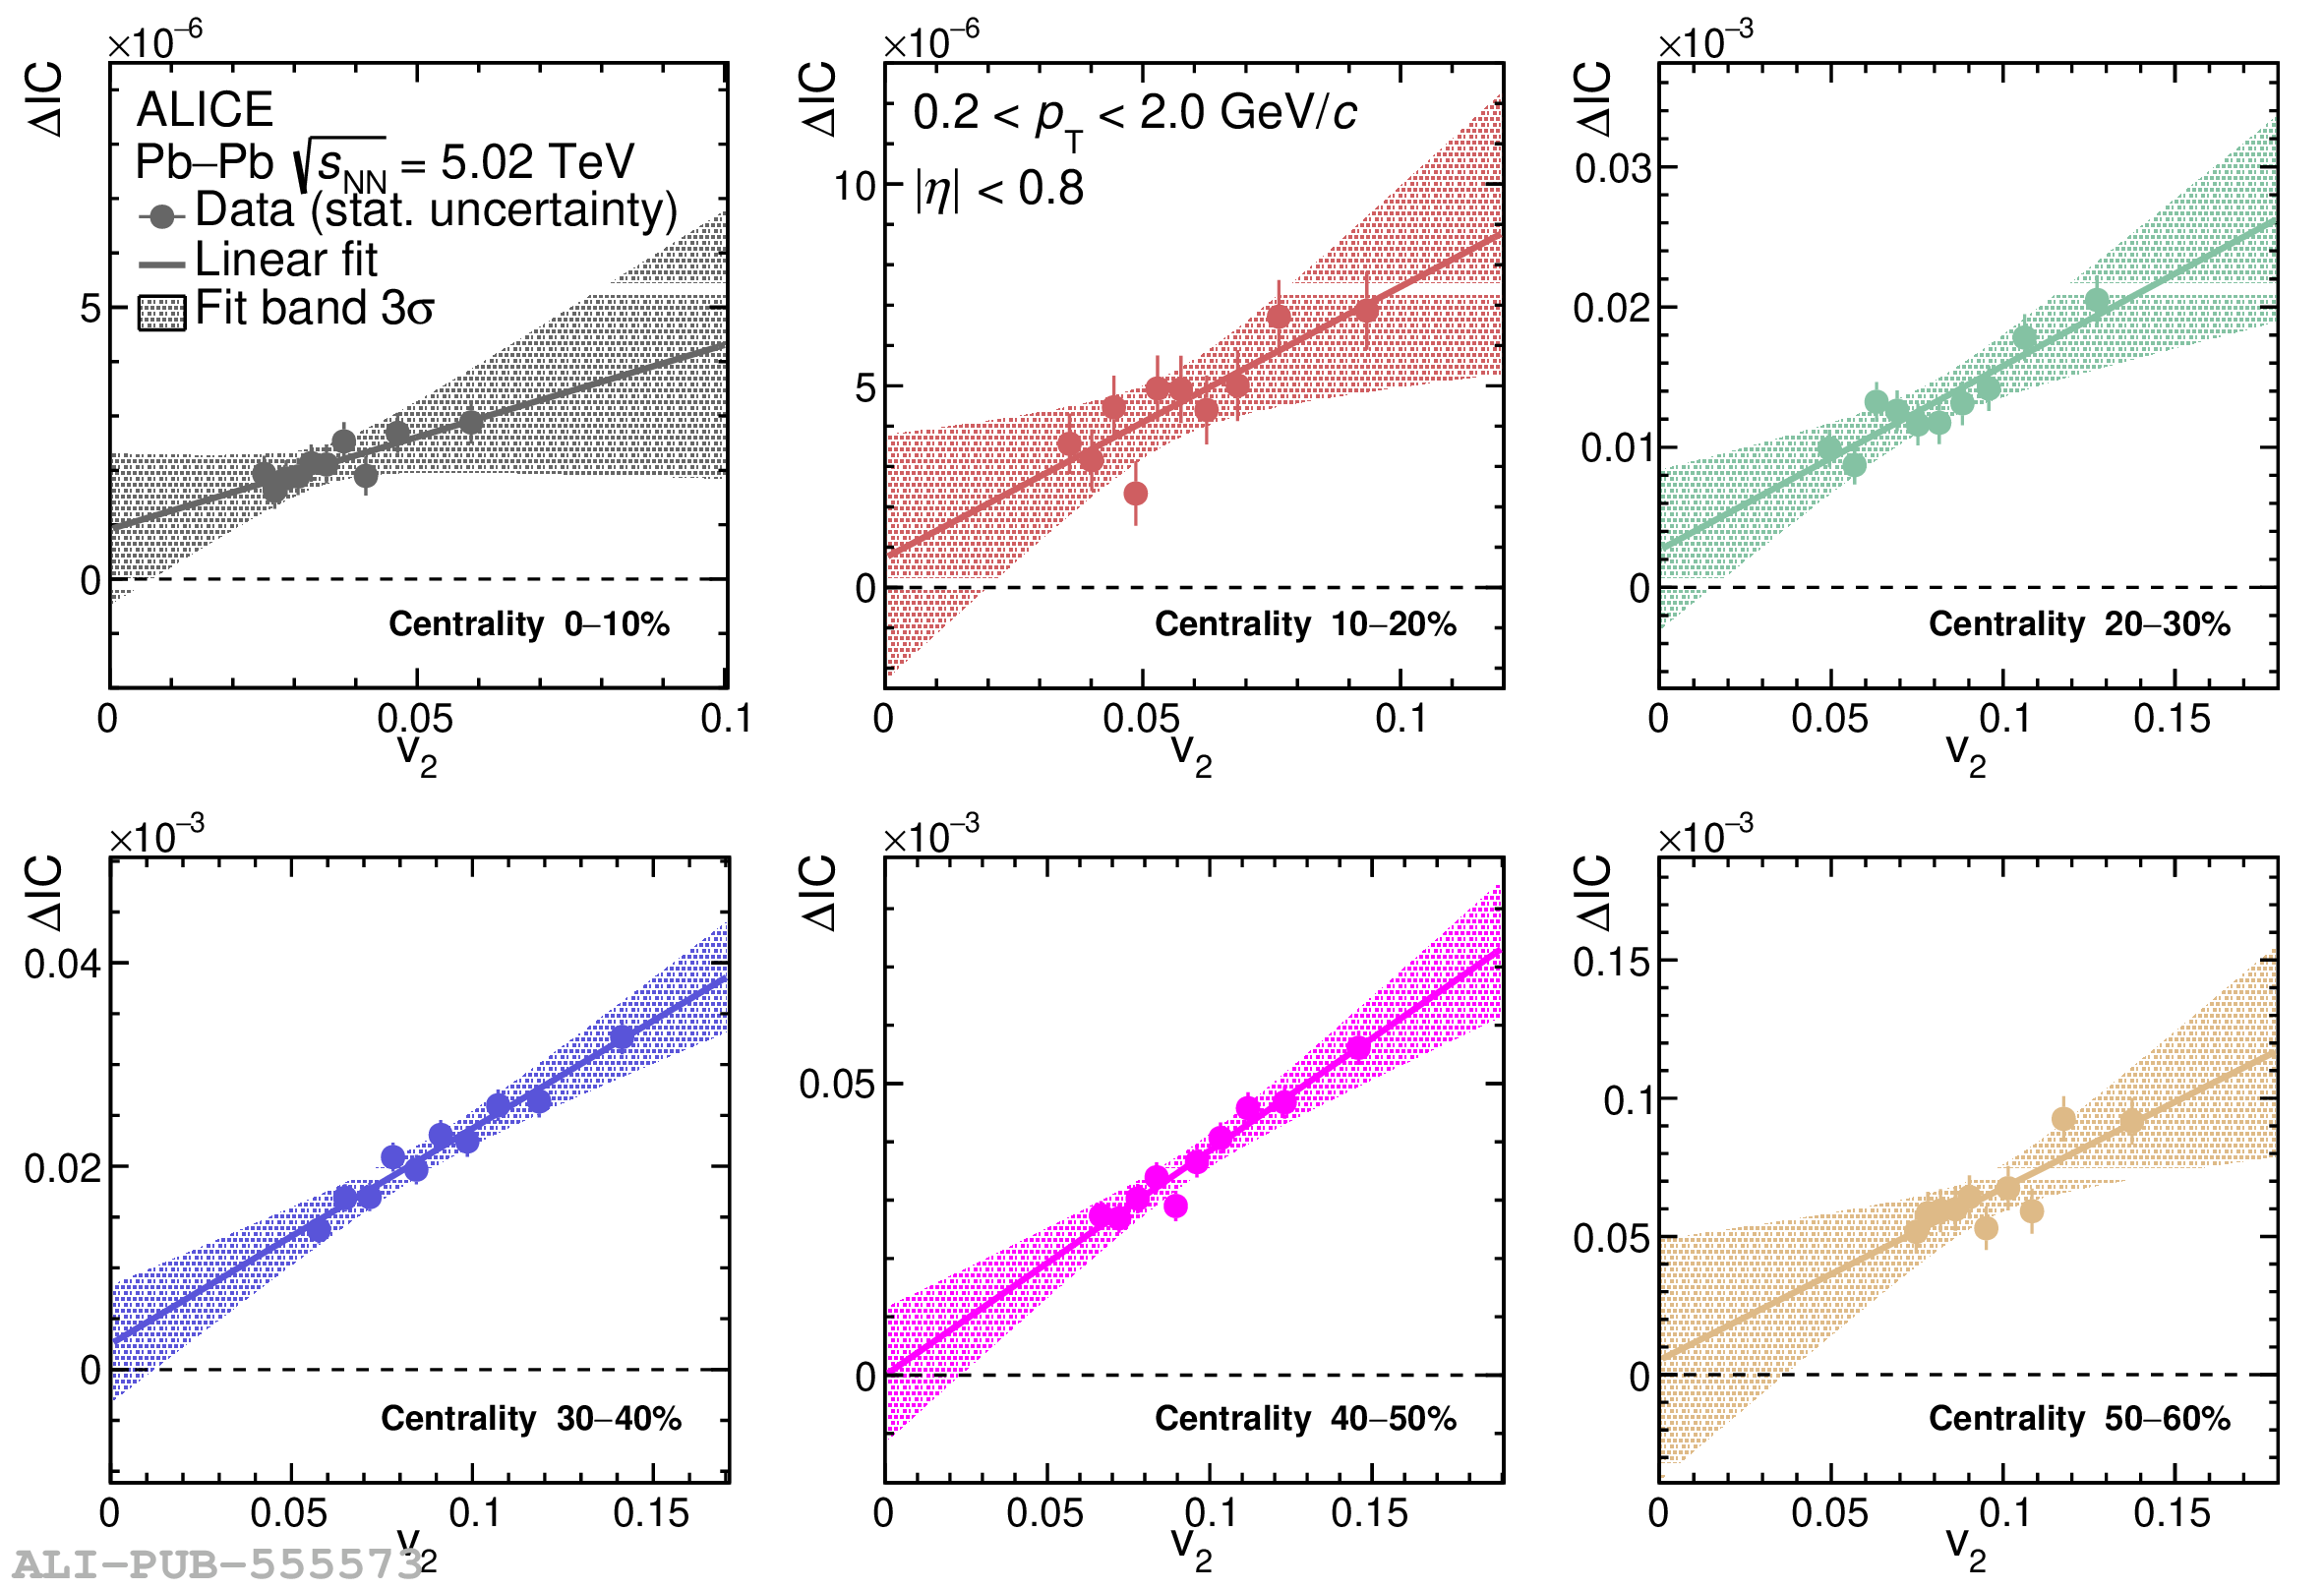 |