The top left panel shows the $v_2$ of positively (red markers) and negatively (blue markers) charged hadrons as a function of the corrected $A_{\rm ch}$, while the top right panel shows the same for $v_3$. Statistical uncertainties are shown by bars and uncorrelated (correlated) systematic uncertainties by open boxes (shaded bands). The bottom left panel shows $\Delta v_{2}/\langle v_{2} \rangle $ as a function of the corrected \Ach\xspace and bottom right panel shows the same for $\Delta v_{3}/\langle v_{3} \rangle $, all for the 40-50% centrality interval in Pb$-$Pb collisions at $\sqrt{s_{\rm NN}}$ = 5.02 TeV. The dotted blue line shows the linear fit to the data points to obtain the values of normalized slopes ($r^{\rm Norm}_2$ and $r^{\rm Norm}_3$). | 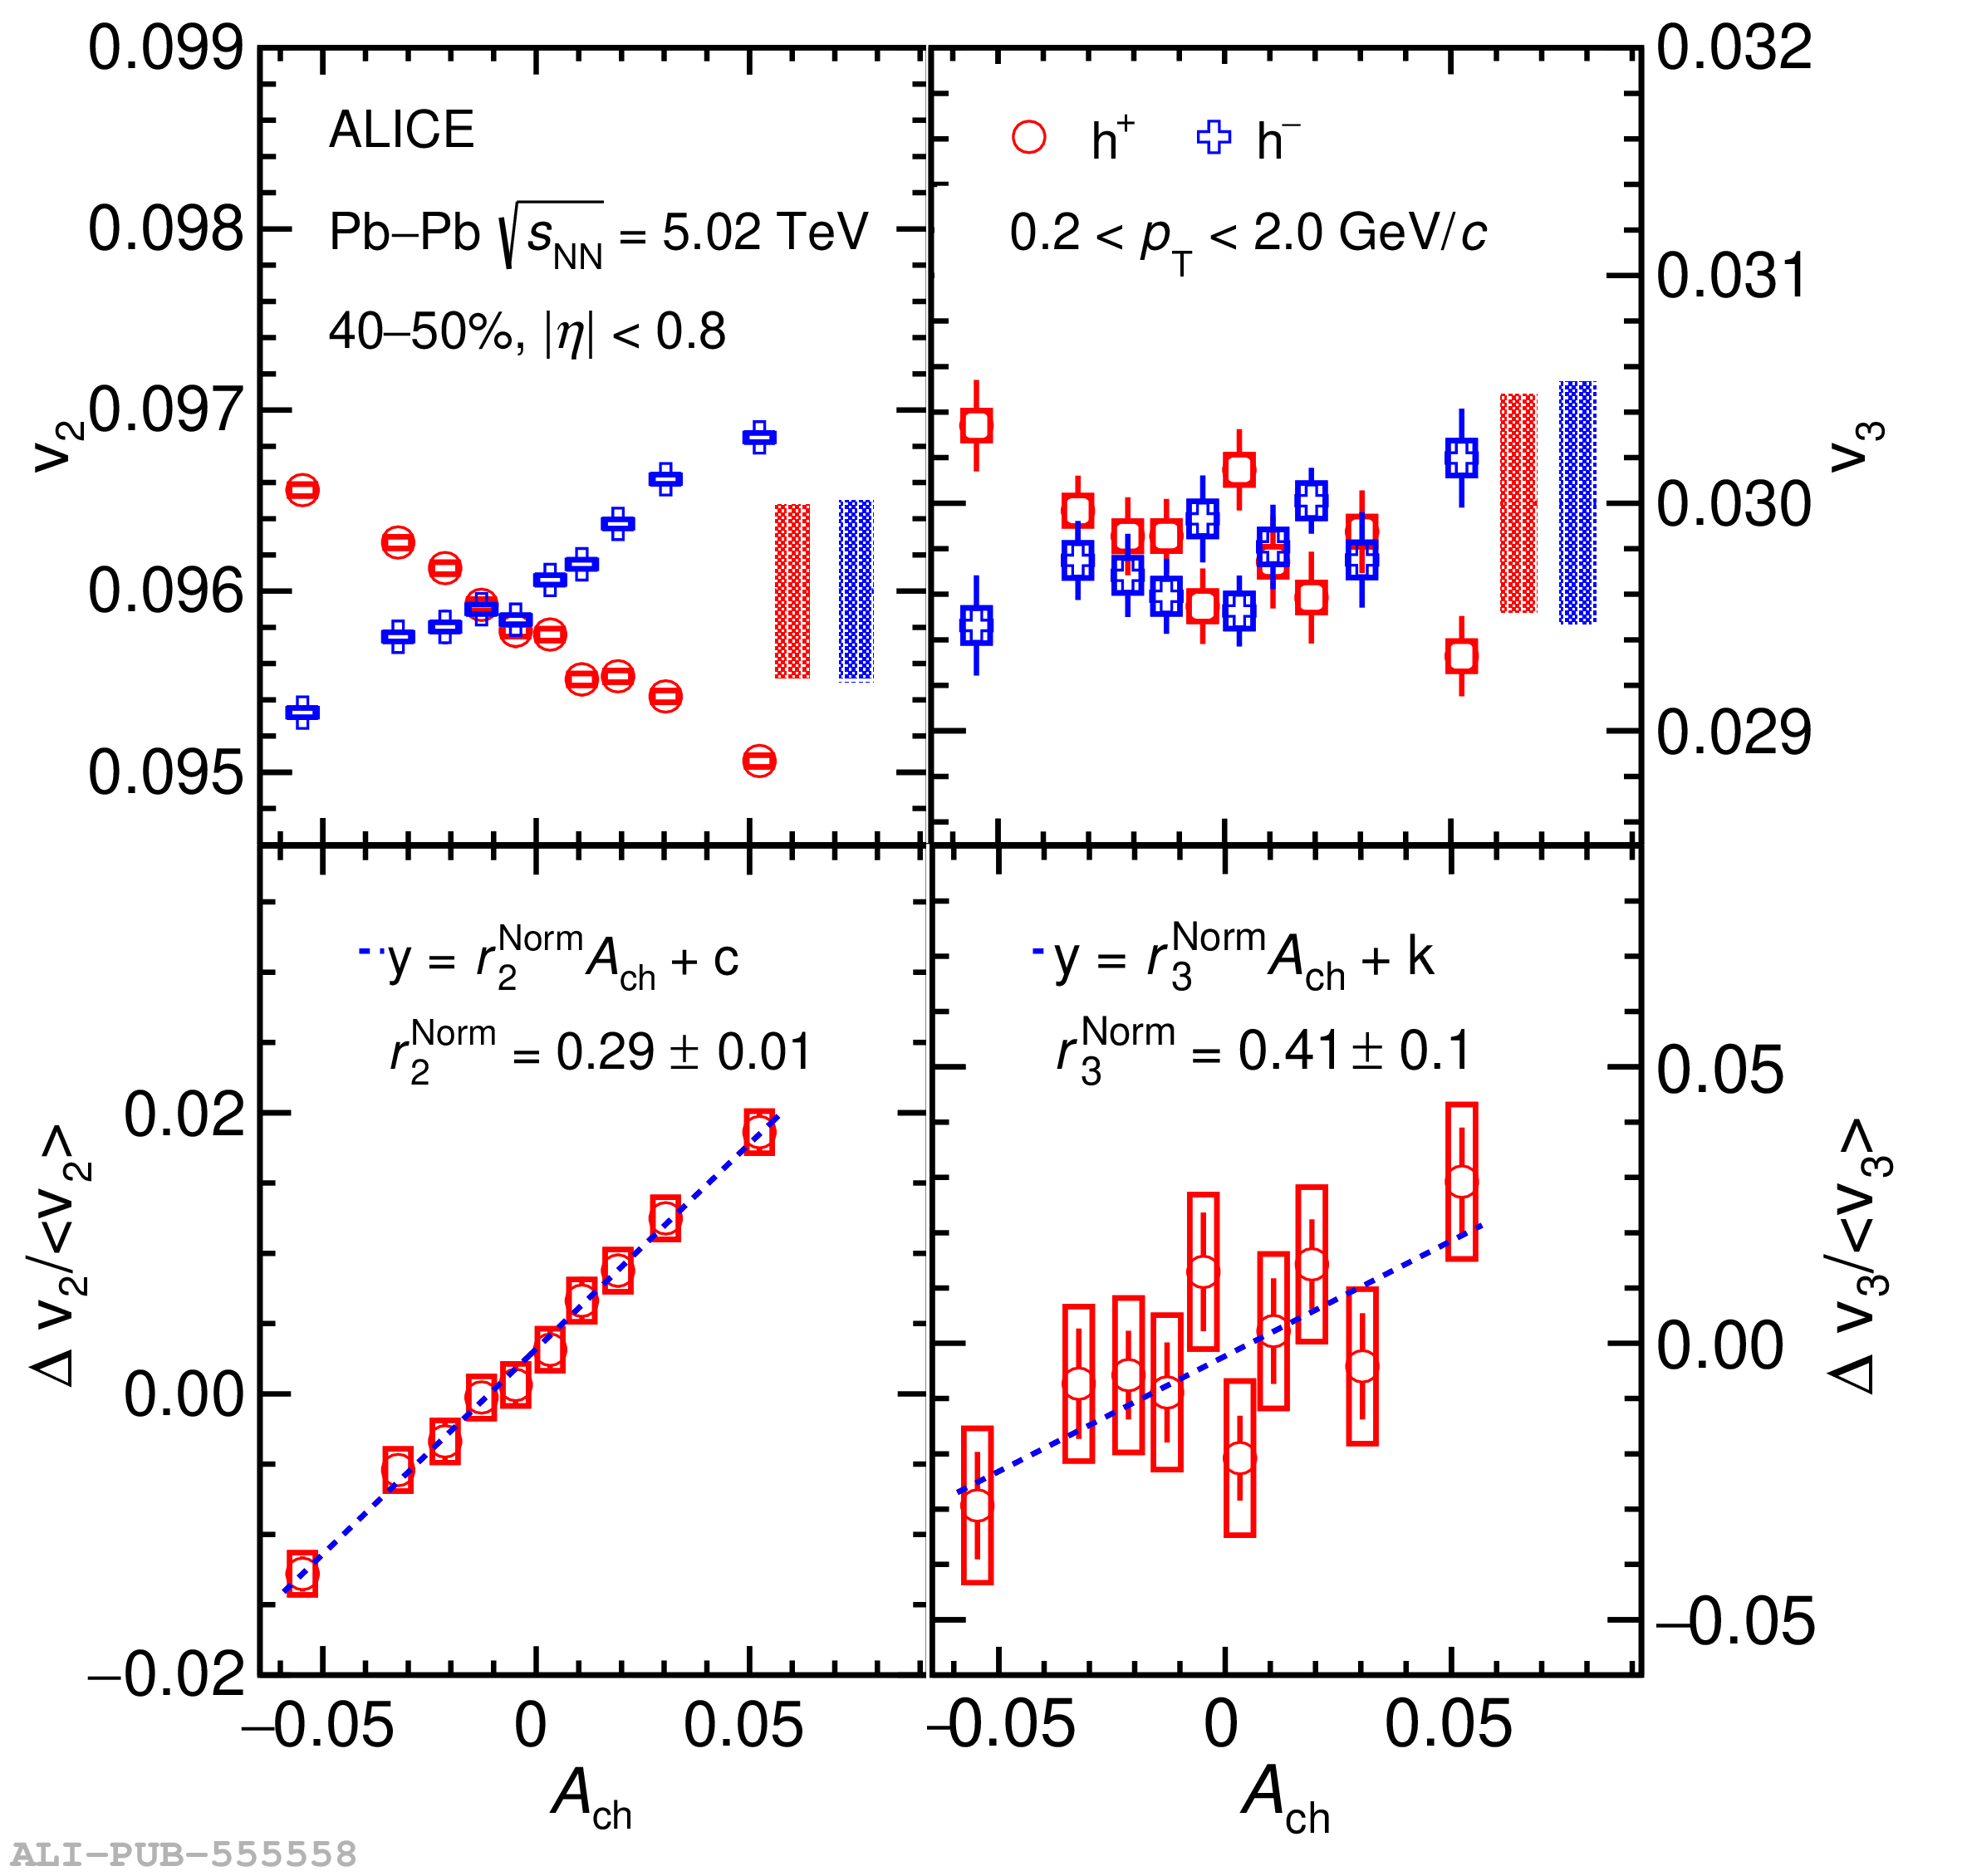 |