(Left panel): Raw $A_{\rm ch}$ distribution in Pb-Pb collisions at $\sqrt{s_{\rm NN}}$ = 5.02 TeV for the 40-50% centrality interval. Red dotted lines depict the edges of the ten $A_{\rm ch}$ classes. (Right panel): Correlation between true and raw $A_{\rm ch}$ obtained from HIJING simulations combined with a GEANT3 detector model for Pb-Pb collisions at $\sqrt{s_{\rm NN}}$ = 5.02 TeV in the 40--50% centrality interval. | 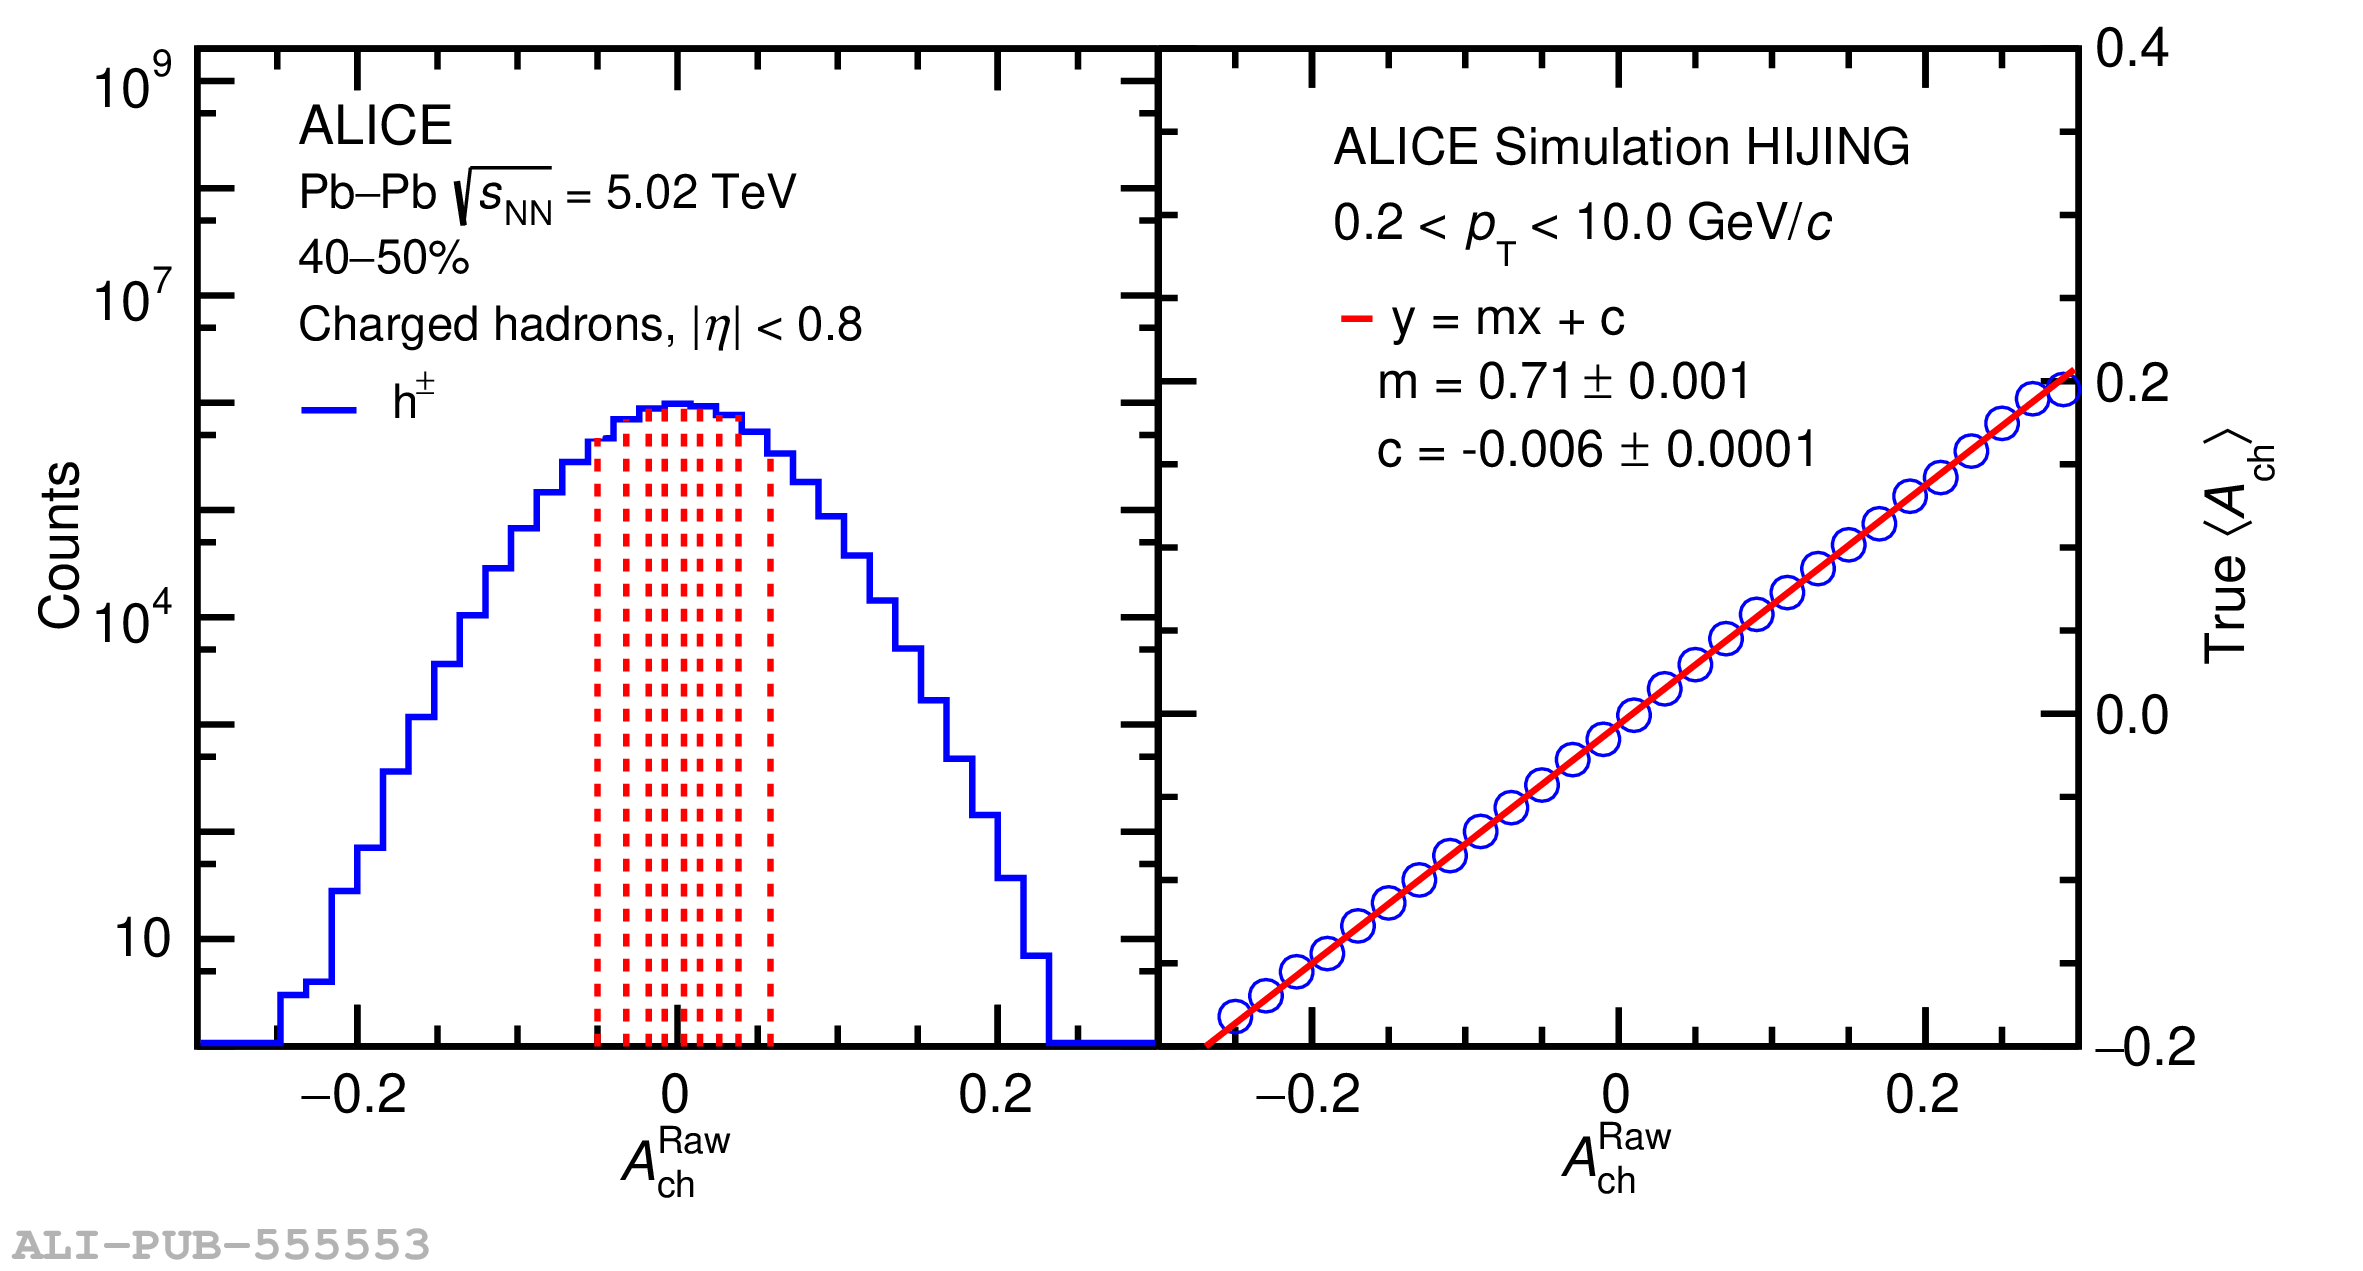 |