Measurement of inelastic, single- and double-diffraction cross sections in proton-proton collisions at the LHC with ALICE

Measurements of cross sections of inelastic and diffractive processes in proton--proton collisions at LHC energies were carried out with the ALICE detector. The fractions of diffractive processes in inelastic collisions were determined from a study of gaps in charged particle pseudorapidity distributions: for single diffraction (diffractive mass $M_X <~ 200$ GeV/$c^2$) $\sigma_{\rm SD}/\sigma_{\rm INEL} = 0.21 \pm 0.03, 0.20^{+0.07}_{-0.08}$, and $0.20^{+0.04}_{-0.07}$, respectively at centre-of-mass energies $\sqrt{s} = 0.9, 2.76$, and 7~TeV; for double diffraction (for a pseudorapidity gap $\Delta\eta > 3$) $\sigma_{\rm DD}/\sigma_{\rm INEL} = 0.11 \pm 0.03, 0.12 \pm 0.05$, and $0.12^{+0.05}_{-0.04}$, respectively at $\sqrt{s} = 0.9, 2.76$, and 7~TeV. To measure the inelastic cross section, beam properties were determined with van der Meer scans, and, using a simulation of diffraction adjusted to data, the following values were obtained: $\sigma_{\rm INEL} = 62.8^{+2.4}_{-4.0} (model) \pm 1.2 (lumi)$ mb at $\sqrt{s} =$ 2.76~TeV and $73.2^{+2.0}_{-4.6} (model) \pm 2.6 (lumi)$ mb at $\sqrt{s}$ = 7~TeV. The single- and double-diffractive cross sections were calculated combining relative rates of diffraction with inelastic cross sections. The results are compared to previous measurements at proton--antiproton and proton--proton colliders at lower energies, to measurements by other experiments at the LHC, and to theoretical models.


Eur. Phys. J. C 73 (2013) 2456
e-Print: arXiv:1208.4968 | PDF | inSPIRE
CERN-PH-EP-2012-238

Figure 1

Lowest order Pomeron exchange graphs contributing to elastic (left), to single- (middle) and to double-diffractive (right) proton-proton scattering. $\mathbb{P}$ stands for Pomeron, p for proton and $X$ ($X_1$, $X_2$) for the diffractive system(s).

Figure 2

Schematic rapidity ($y$) distribution of outgoing particles in elastic (left), in single- (middle), and in double-diffraction (right) events,showing the typical rapidity-gap topology.

Figure 3

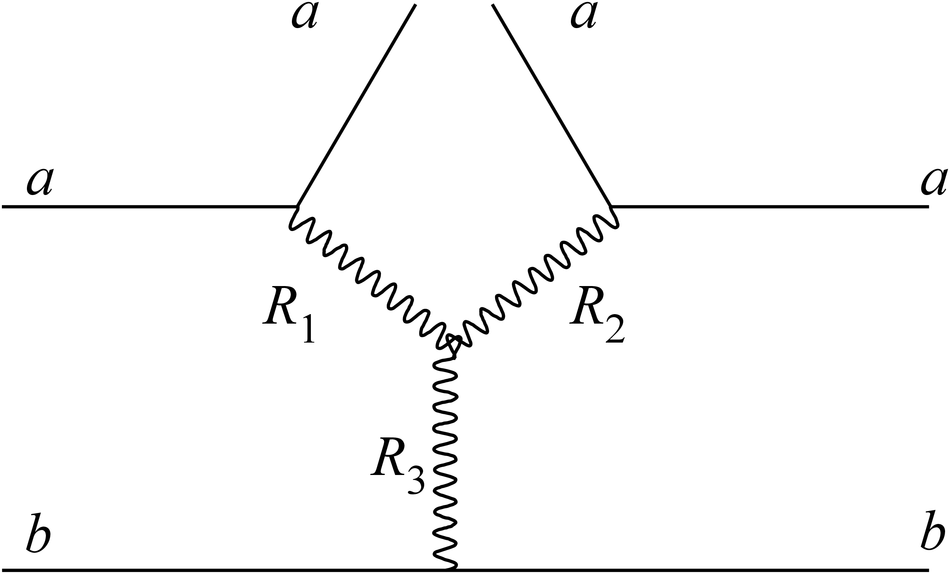
Triple-Reggeon Feynman diagram occurring in the calculation of the amplitude for single diffraction, corresponding tothe dissociation of hadron b in the interaction with hadron a. (See Ref.1). Each of the Reggeon legscan be a Pomeron or a secondary Reggeon (e.g. $f$-trajectories), resulting in eight different combinations of Pomerons andReggeons. In the text, we use the notation $(R_1R_2)R_3$ for the configuration shown in this figure.

Figure 4

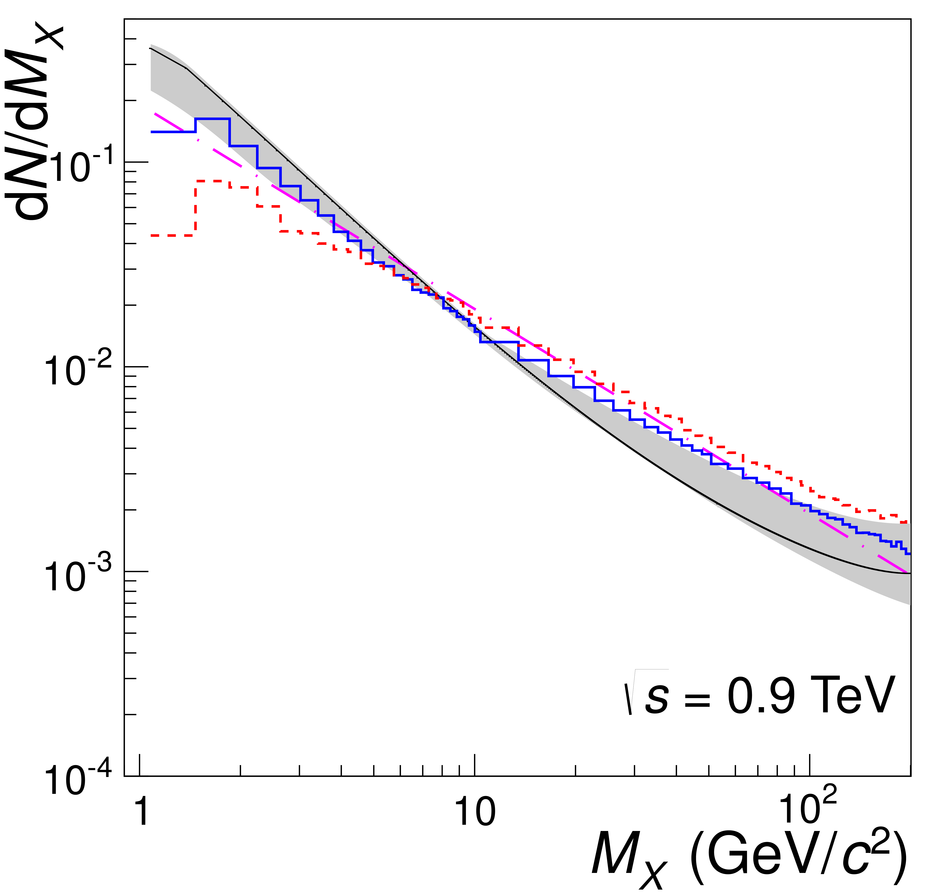
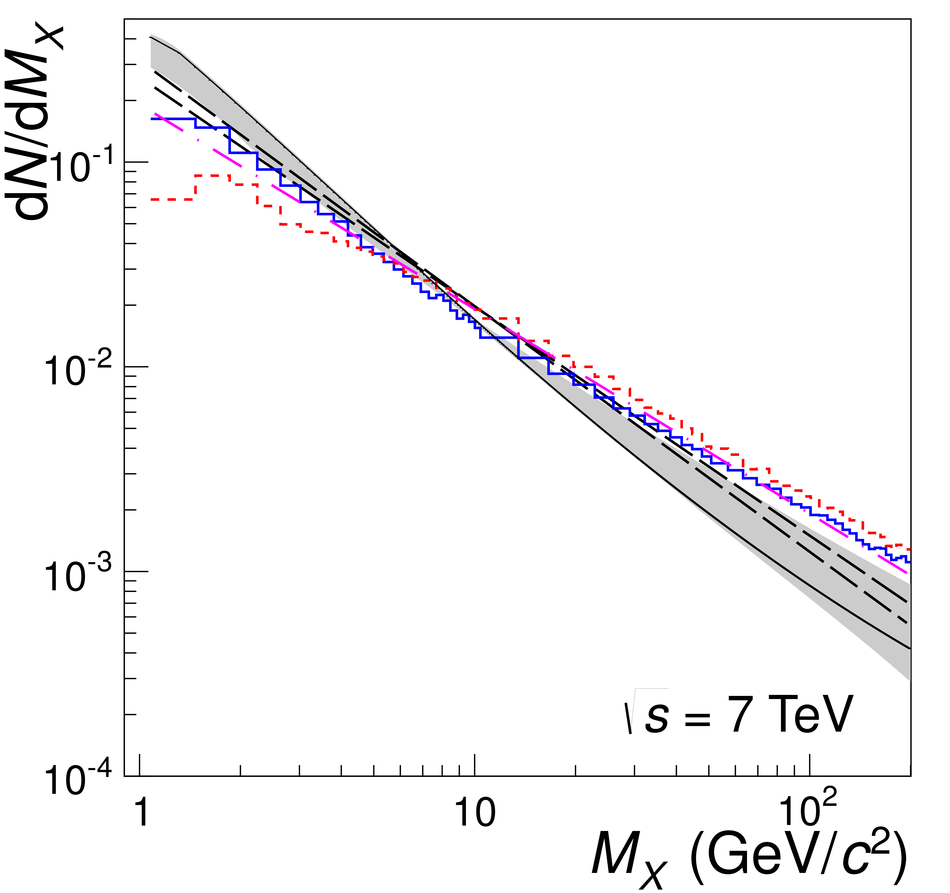
Diffractive-mass distributions, normalized to unity, for the SD process in pp collisions at $\sqrt{s}$ = 0.9 TeV (left) and $\sqrt{s}$ = 7 TeV (right), from Monte Carlo generators PYTHIA6 (blue histogram), PHOJET (red dashed-line histogram), and model (black line) --- used in this analysis for central-value estimate. The shaded area around the black line is delimited by (above at lower masses, below at higher masses) variation of the model , multiplying the distribution by a linear function which increases the probability at the threshold mass by a factor 1.5 (keeping the value at upper-mass cut-off unchanged, and then renormalizing the distribution back to unity), and by (below at lower masses, above at higher masses) Donnachie-Landshoff parametrization. This represents the variation used for systematic-uncertainty estimates in the present analysis. A $1/M_X$ line is shown for comparison (magenta dotted-dashed line). At $\sqrt{s}$ = 7 TeV (right) black dashed-lines show $1/M_X^{1+2\Delta}$ distributions with $\Delta = 0.085$ and $0.1$ also used with PYTHIA8 event generator in the ATLAS measurement of inelastic cross section

Figure 5

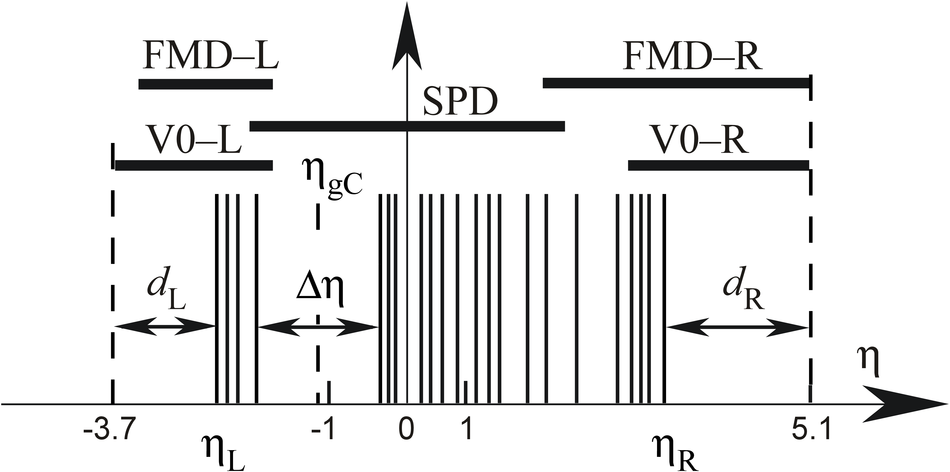
Pseudorapidity ranges covered by FMD, SPD and VZERO (V0-L and V0-R) detectors, with an illustration of the distances$d_{\rm L}$ and $d_{\rm R}$ from the edges ($\eta_{\mathrm{L}}$ and $\eta_{\mathrm{R}}$, respectively) of the particle pseudorapidity distribution to the edges of the ALICEdetector acceptance (vertical dashed lines --- for the nominal interaction point position) and the largest gap $\Delta\eta$ between adjacent tracks. The centre of the largest gap is denoted $\eta_{\rm gC}$. L and R stand for Left and Right, respectively, following the convention defined in Section 3

Figure 6

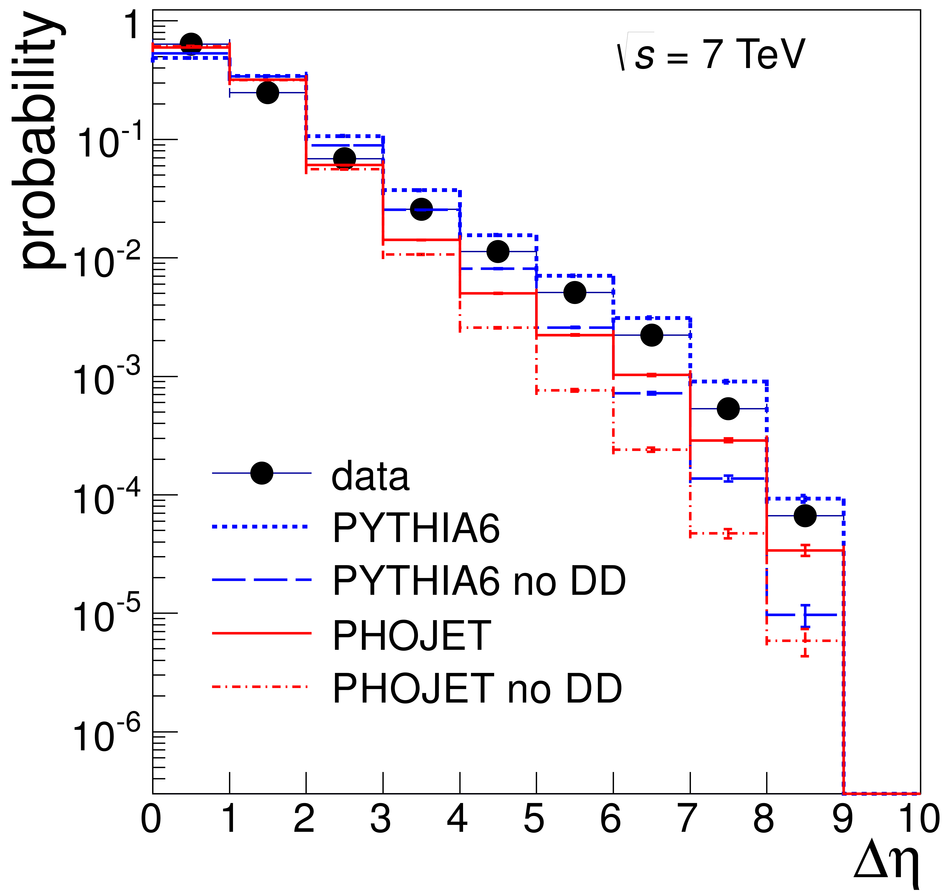
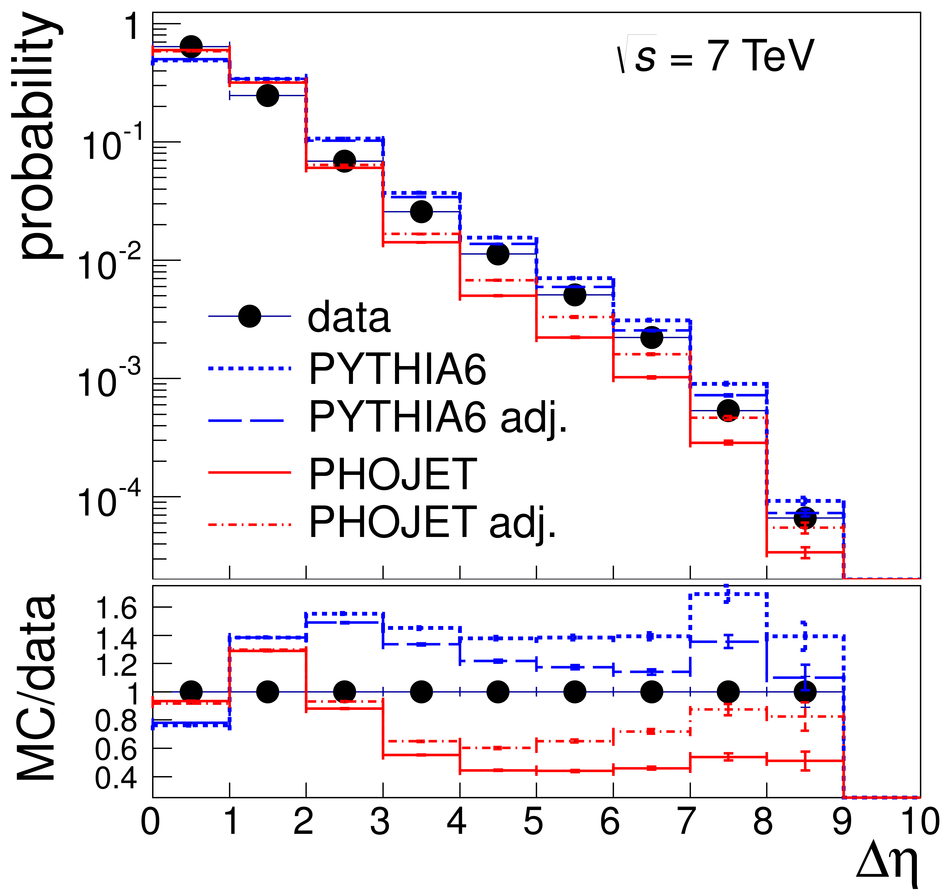
Largest pseudorapidity gap width distribution for 2-armevents, comparison between the data (black points) and various simulations (stage $d$). Left: dotted blue and solid red lines were obtained from default PYTHIA6 and PHOJET, respectively;dashed blue and dashed-dotted red lines were obtained by setting the DD fraction to zero in PYTHIA6 and PHOJET, respectively. Right: dotted blue and solid red lines are the same as on the left side; dashed blue and dashed-dotted red lines are for adjusted PYTHIA6 and PHOJET, respectively; the ratio of simulation to data is shown below with the same line styles for the four Monte Carlo calculations

Figure 7

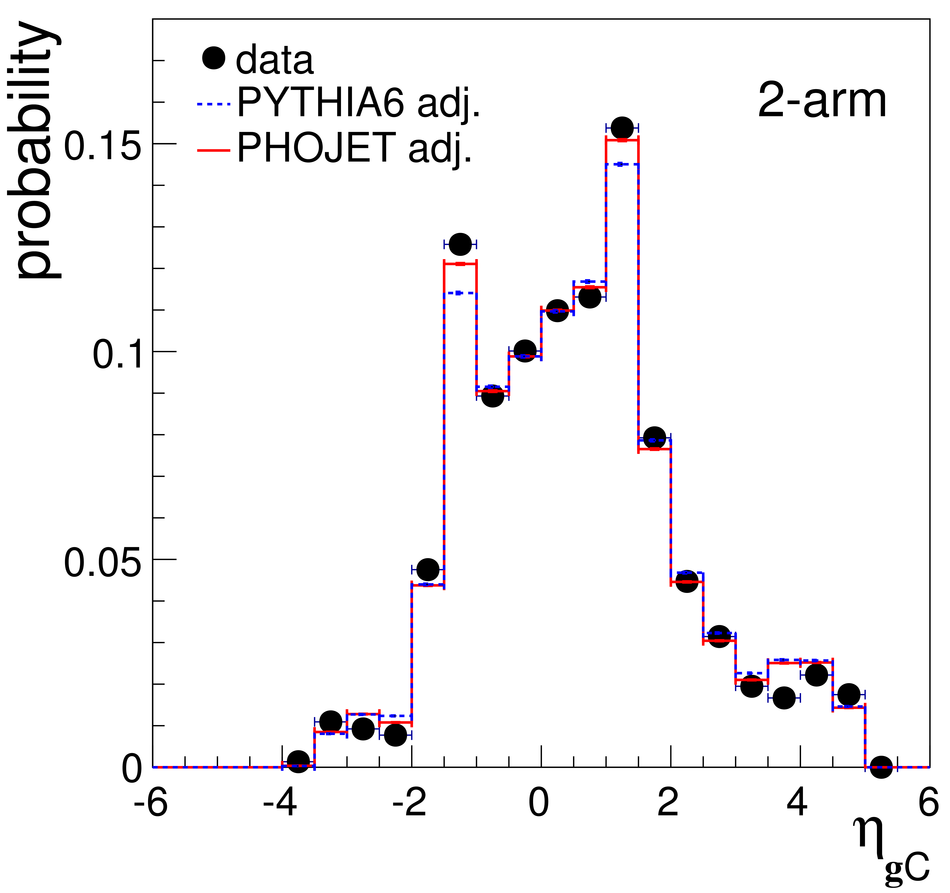
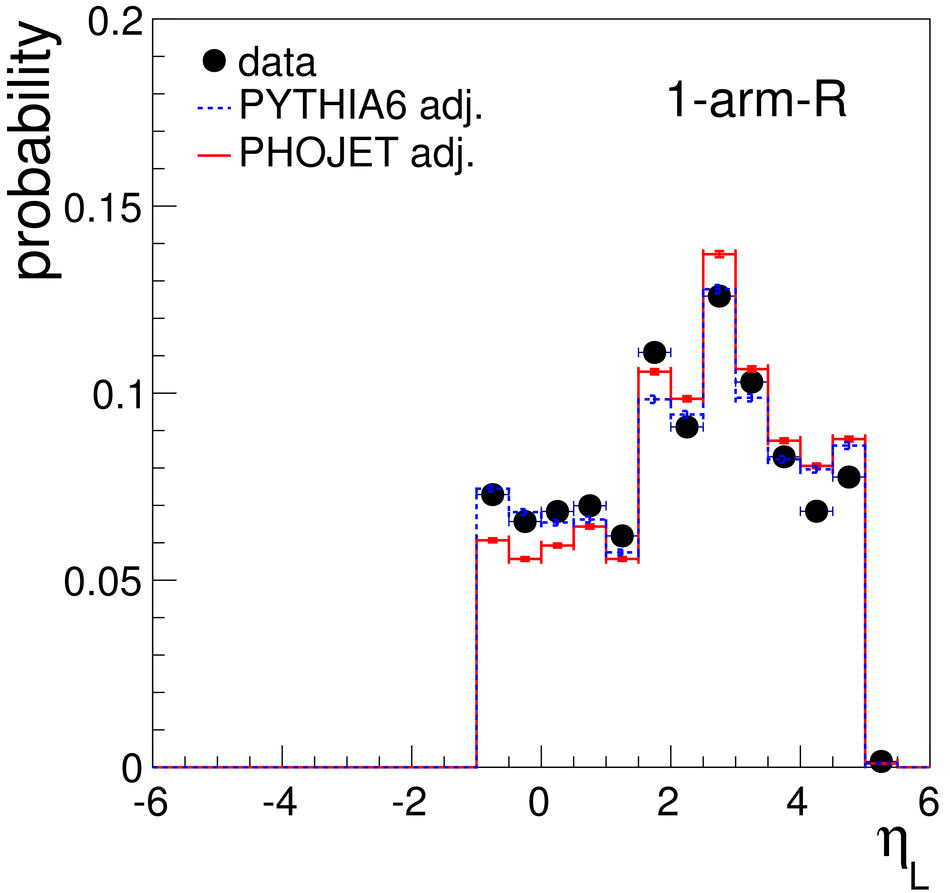
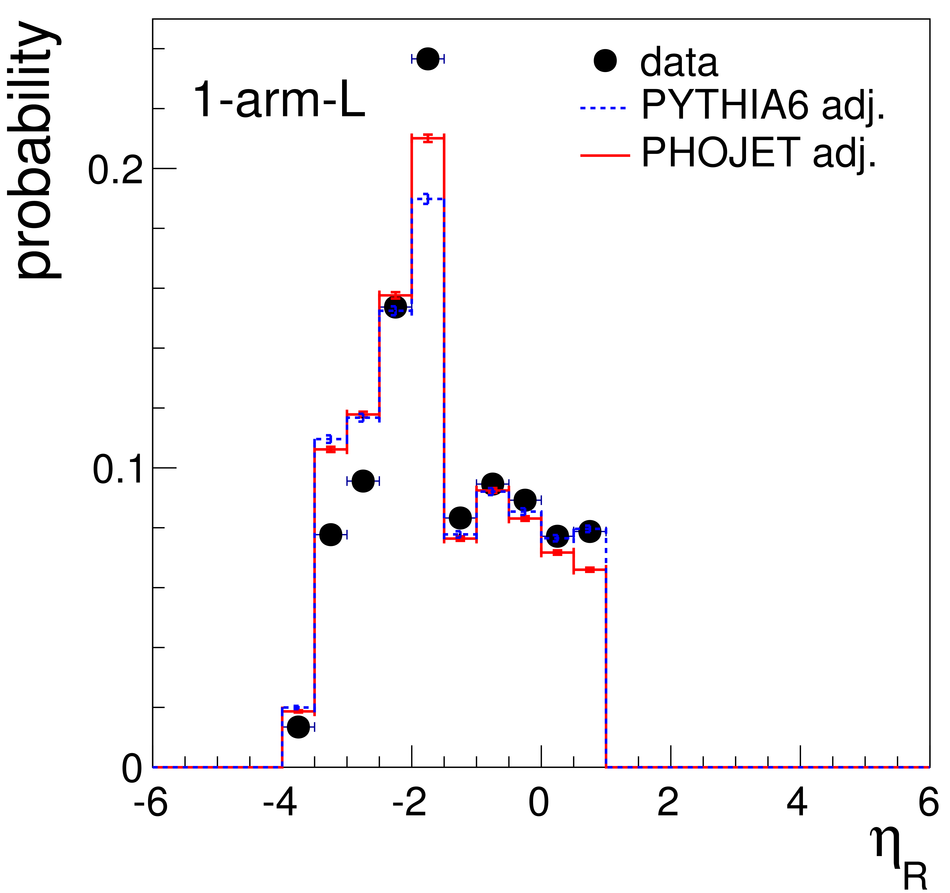
Comparison of reconstructed data versus adjusted Monte Carlo simulations (stage $d$), at $\sqrt{s}$ = 7 TeV. For 2-arm event class (top),pseudorapidity distributions of centre position ($\eta_{\rm gC}$) of the largest pseudorapidity gap;distribution for 1-arm-L (middle) and 1-arm-R (bottom) event classes, respectively of the pseudorapidity of the right edge ($\eta_{\rm R}$)and left edge ($\eta_{\rm L}$) of the pseudorapidity distribution

Figure 8

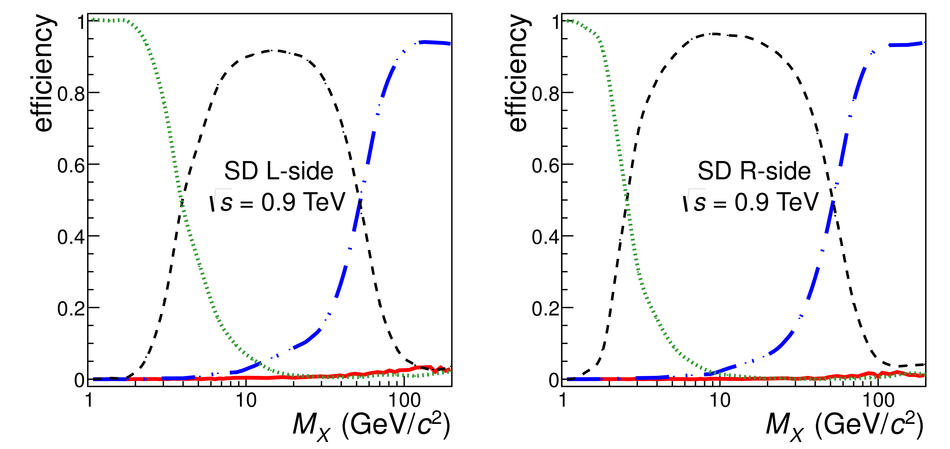
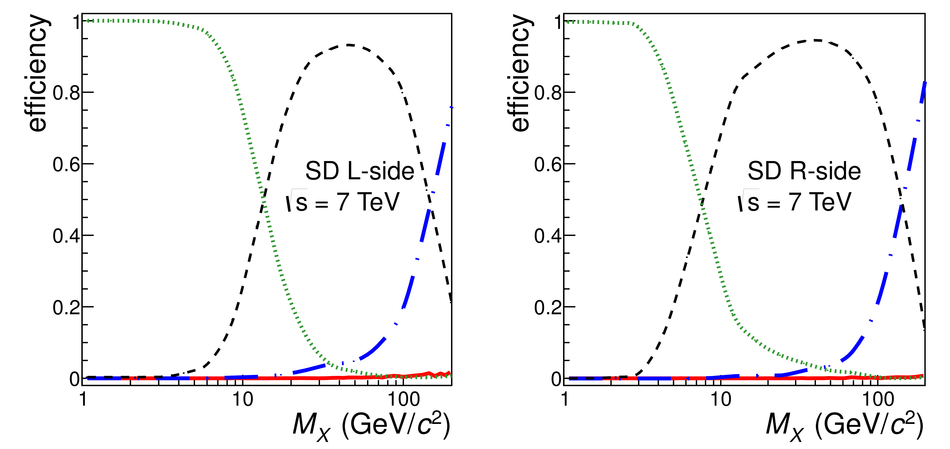
Detection efficiencies for SD events as a function of diffractive mass $M_X$ obtained by simulations with PYTHIA6, at $\sqrt{s}$ = 0.9 TeV (top), and 7 TeV (bottom) L-side and R-side refer to the detector side at which SD occurred. Green dotted lines show the probability of not detecting the event at all Black dashed lines show the selection efficiency for an SD event on L(R)-side to be classified as the 1-arm-L(R) event. Blue dashed-dotted lines show the efficiency to be classified as a 2-arm event. Red continuous linesshow the (small) probability of L(R)-side single diffraction satisfying the 1-arm-R(L) selection, $\it i.e.$ the opposite side condition

Figure 9

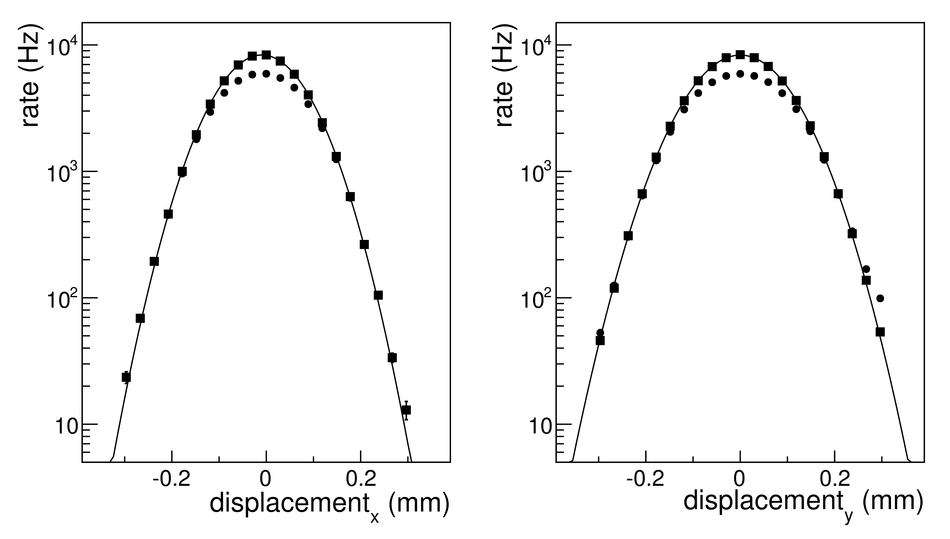
$\mathrm{MB}_\mathrm{AND}$ trigger rates for horizontal (left) and vertical (right) relative displacements of the proton beams, for van der Meer scan IIperformed at 7 TeV. Dots are raw trigger rates, squares are interaction rates after corrections discussed in the text. The linesare to guide the eye. Only statistical errors are shown

Figure 10

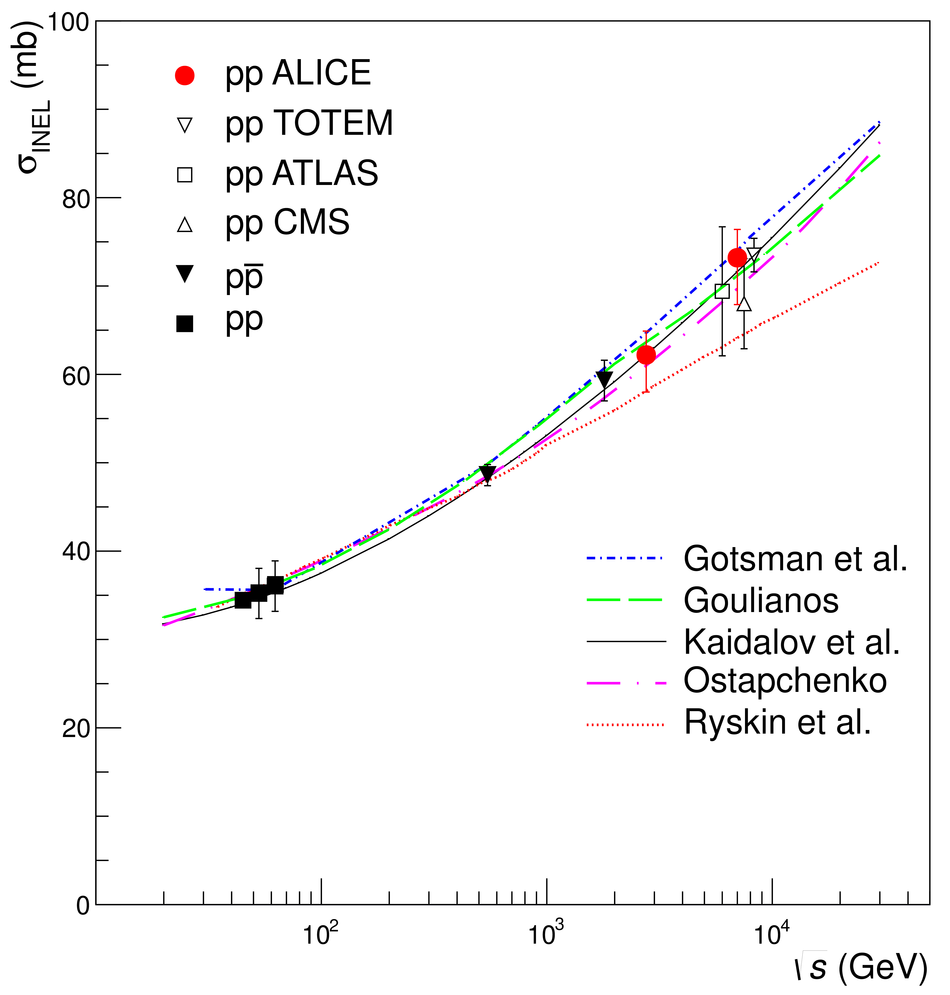
Inelastic cross sections as a function of centre-of-mass energy, in proton-proton or proton-antiproton collisions, compared withpredictions (short dot-dashed blue line), (dashed green line), (solid black line), (long dot-dashed pink line), and (dotted red line) LHC data are from ALICE [this publication], ATLAS ,CMS and TOTEM . Data points for ATLAS, CMS and TOTEM wereslightly displaced horizontally for visibility. Data from other experiments are taken from

Figure 11

Single-diffractive cross section as a function of centre-of-mass energy. Data from other experiments are for $M_X^2 < 0.05s$ ALICE measured points are shown with full red circles, and, in order to compare with data from other experiments, were extrapolated to$M_X^2 < 0.05s$ (open red circles), when needed. The predictions of theoretical models correspond to $M_X^2 < 0.05s$ and are defined as in Fig.10

Figure 12

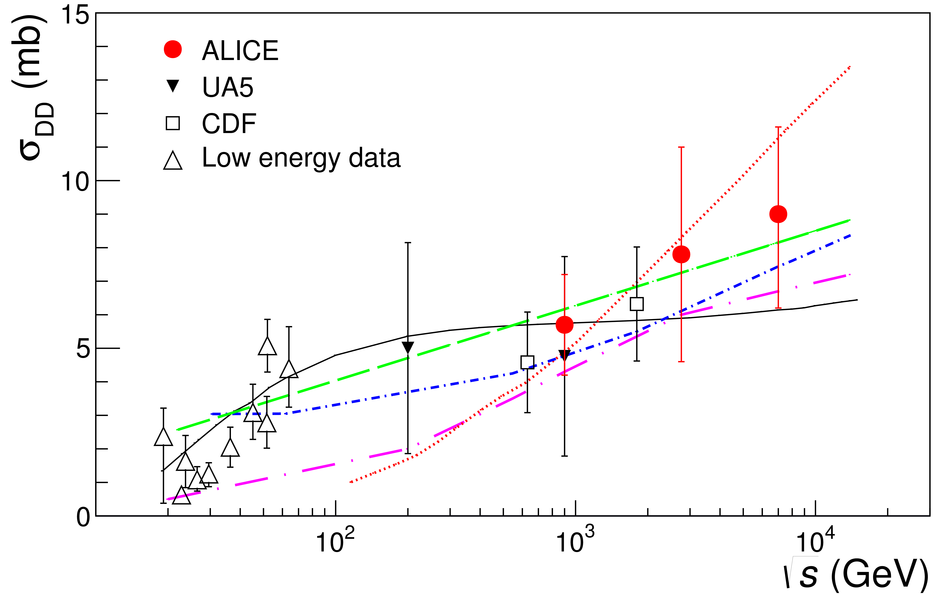
Double-diffractive cross section as a function of centre-of-mass energy. The theoretical model predictions represented as lines arefor $\Delta\eta > 3$ and are defined as in Fig.10. Data from other experiments are taken from