Diffractive-mass distributions, normalized to unity, for the SD process in pp collisions at $\sqrt{s}$ = 0.9 TeV (left) and $\sqrt{s}$ = 7 TeV (right), from Monte Carlo generators PYTHIA6 (blue histogram), PHOJET (red dashed-line histogram), and model (black line) --- used in this analysis for central-value estimate. The shaded area around the black line is delimited by (above at lower masses, below at higher masses) variation of the model , multiplying the distribution by a linear function which increases the probability at the threshold mass by a factor 1.5 (keeping the value at upper-mass cut-off unchanged, and then renormalizing the distribution back to unity), and by (below at lower masses, above at higher masses) Donnachie-Landshoff parametrization. This represents the variation used for systematic-uncertainty estimates in the present analysis. A $1/M_X$ line is shown for comparison (magenta dotted-dashed line). At $\sqrt{s}$ = 7 TeV (right) black dashed-lines show $1/M_X^{1+2\Delta}$ distributions with $\Delta = 0.085$ and $0.1$ also used with PYTHIA8 event generator in the ATLAS measurement of inelastic cross section | 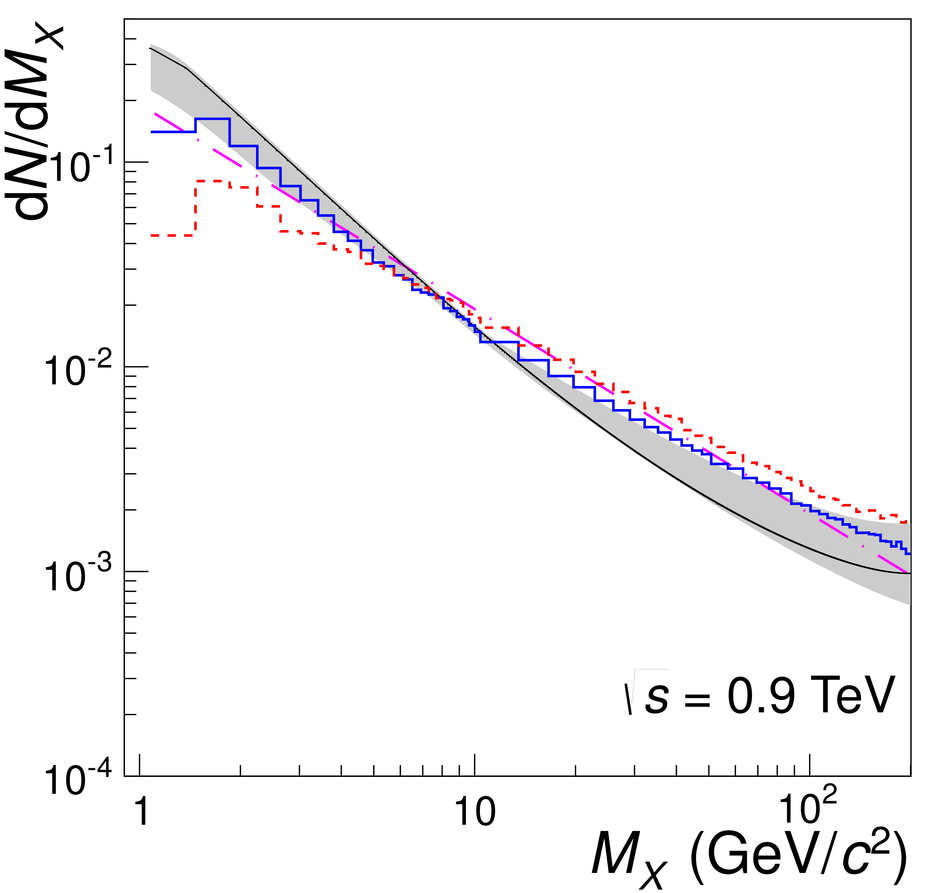 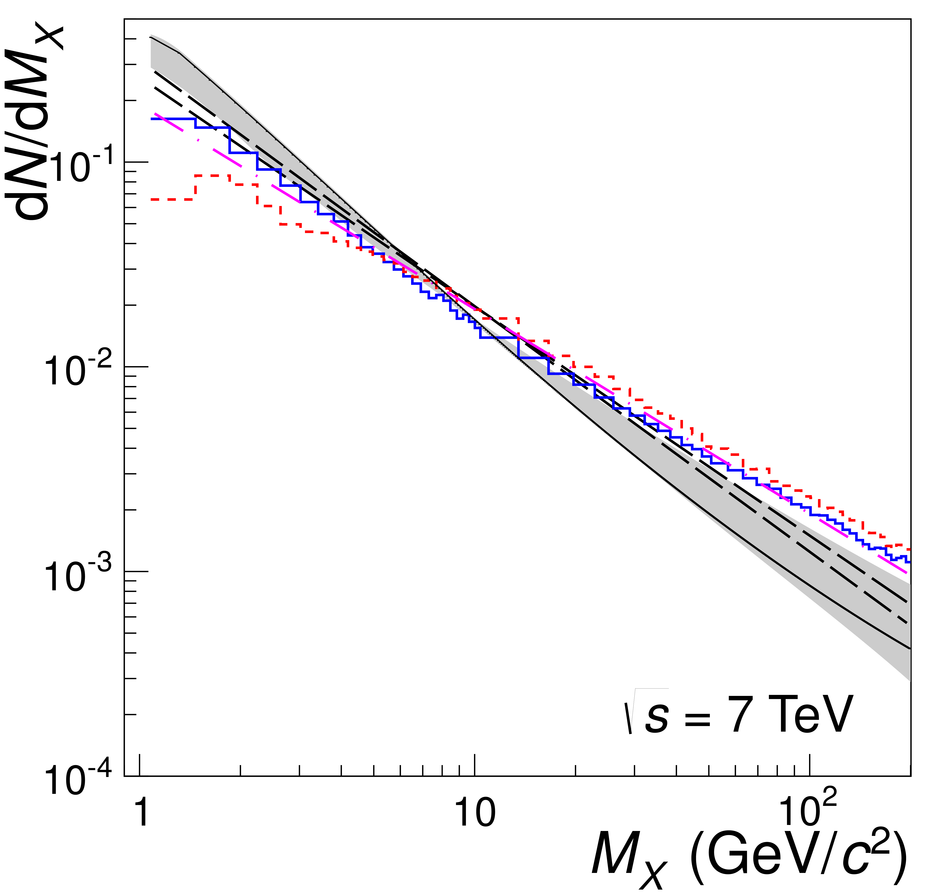 |