Detection efficiencies for SD events as a function of diffractive mass $M_X$ obtained by simulations with PYTHIA6, at $\sqrt{s}$ = 0.9 TeV (top), and 7 TeV (bottom) L-side and R-side refer to the detector side at which SD occurred. Green dotted lines show the probability of not detecting the event at all Black dashed lines show the selection efficiency for an SD event on L(R)-side to be classified as the 1-arm-L(R) event. Blue dashed-dotted lines show the efficiency to be classified as a 2-arm event. Red continuous linesshow the (small) probability of L(R)-side single diffraction satisfying the 1-arm-R(L) selection, $\it i.e.$ the opposite side condition | 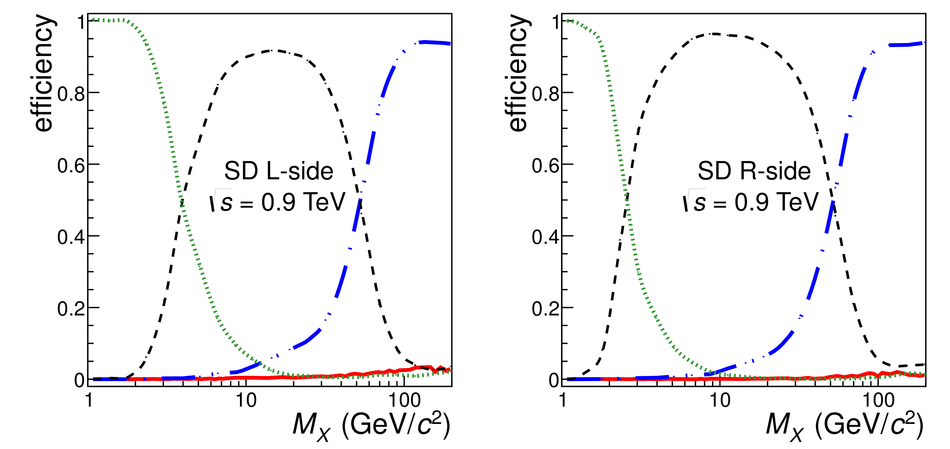 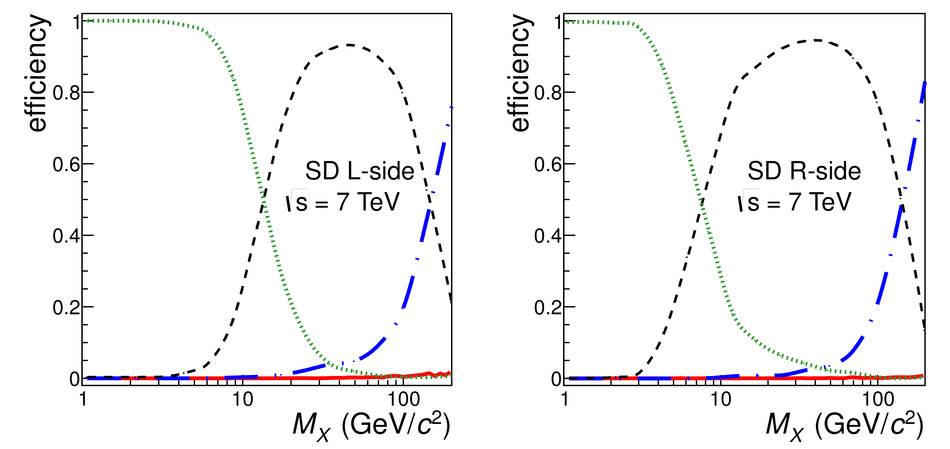 |