Comparison of reconstructed data versus adjusted Monte Carlo simulations (stage $d$), at $\sqrt{s}$ = 7 TeV. For 2-arm event class (top),pseudorapidity distributions of centre position ($\eta_{\rm gC}$) of the largest pseudorapidity gap;distribution for 1-arm-L (middle) and 1-arm-R (bottom) event classes, respectively of the pseudorapidity of the right edge ($\eta_{\rm R}$)and left edge ($\eta_{\rm L}$) of the pseudorapidity distribution | 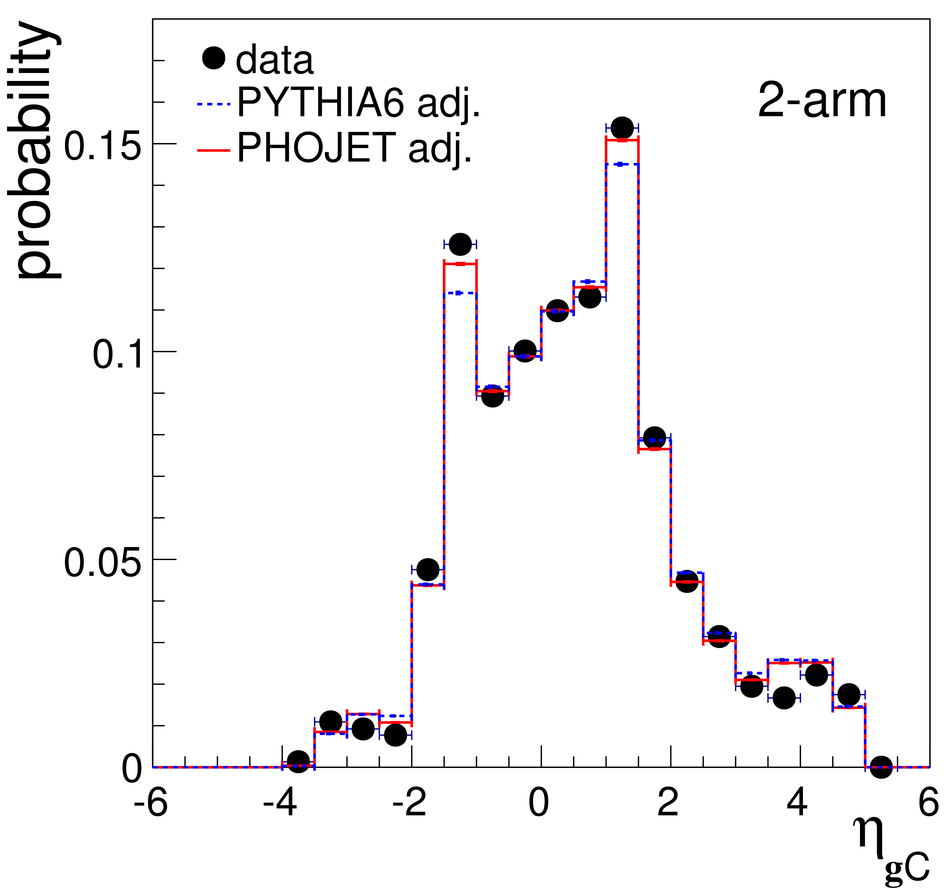  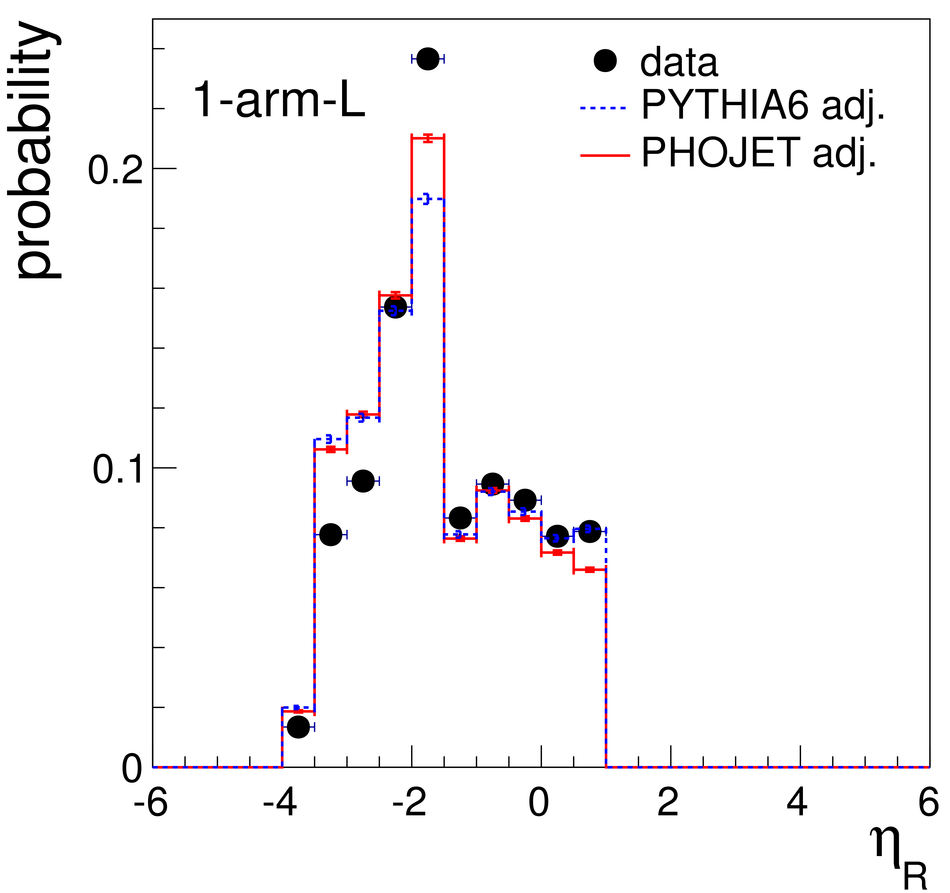 |