Transverse momentum ($p_{\rm{T}}$) spectra of pions, kaons, and protons up to $p_{\rm{T}} = 20$ GeV/$c$ have been measured in Pb-Pb collisions at $\sqrt{s_{\rm NN}} = 2.76$ TeV using the ALICE detector for six different centrality classes covering 0-80%. The proton-to-pion and the kaon-to-pion ratios both show a distinct peak at $p_{\rm{T}} \approx 3$ GeV/$c$ in central Pb-Pb collisions that decreases towards more peripheral collisions. For $p_{\rm{T}} > 10$ GeV/$c$, the nuclear modification factor is found to be the same for all three particle species in each centrality interval within systematic uncertainties of 10-20%. This suggests there is no direct interplay between the energy loss in the medium and the particle species composition in the hard core of the quenched jet. For $p_{\rm{T}} <~ 10$ GeV/$c$, the data provide important constraints for models aimed at describing the transition from soft to hard physics.
Phys. Rev. C 93 (2016) 034913
HEP Data
e-Print: arXiv:1506.07287 | PDF | inSPIRE
CERN-PH-EP-2015-152
Figure 1
The $\dedx$ as a function of the momentum $p$ at mid-rapidity $|\eta|< 0.2$ for 0-5% (left panel) and 60-80% (right panel) Pb-Pb collisions. In each momentum bin, the $\dedx$ spectra have been normalized to have unit integrals and only bins with more than 0.1% of the counts are shown (making electrons not visible in this plot except at very low momentum). The curves show the final $\mdedx$ responses for pions, kaons, and protons. | 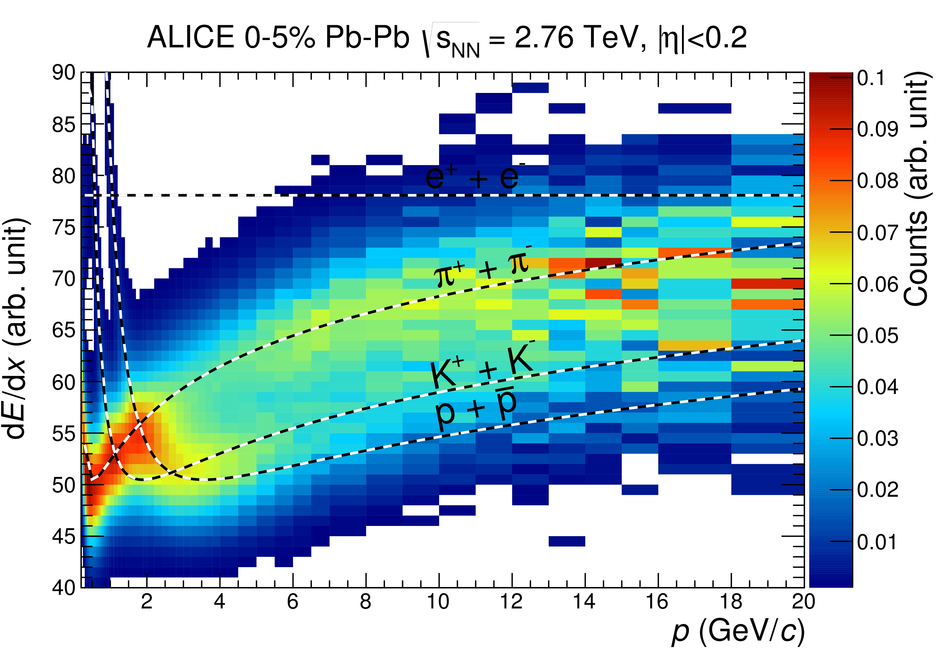 |
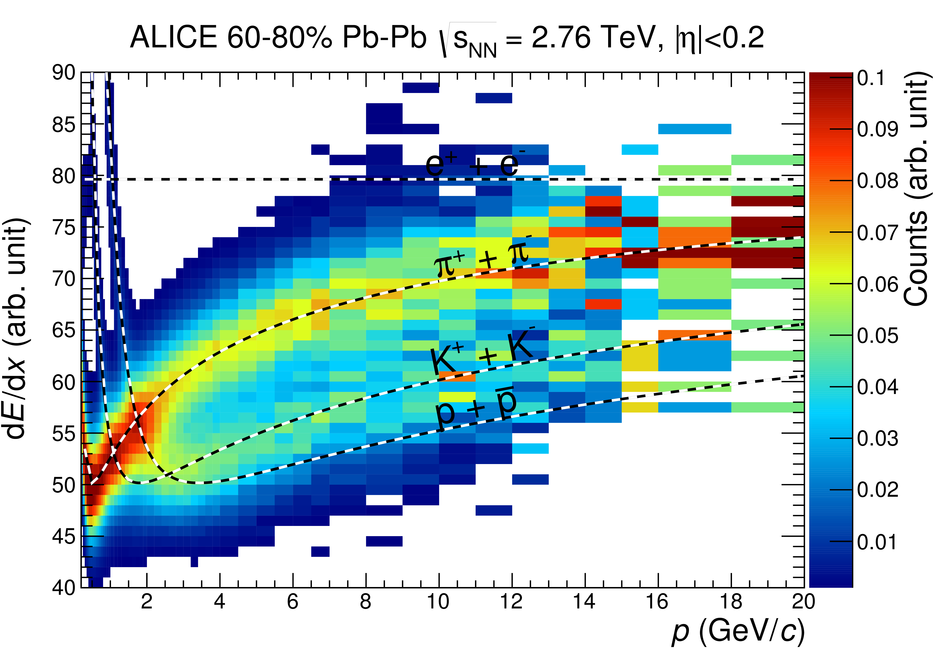
Figure 2
Separation in number of standard deviations ($S_\sigma$) as a function of momentum between: pions and protons (upper panels), pions and kaons (middle panels), and kaons and protons (lower panels). Results are shown for 0-5% (left panels) and 40-60% (middle panels) $\pbpb$; and pp (right panels) collisions. Because the TPC response is track-length dependent, the separation is better for tracks at forward pseudorapidities (solid lines) than for those at smaller $\eta$ (dashed lines). The degradation in separation power in more central collisions is expected from occupancy effects - in the most peripheral collisions an average of $149$ clusters are assigned to tracks with $\pt > 2\gevc$, while in the most central collisions only $127$ clusters are assigned. |  |
Figure 3
The $\dedx$ as a function of $\eta$ for electrons on the Fermi Plateau (upper panel) and MIP pions (middle panel); the selection criteria are described in the text. The solid round markers indicate the average, $\mdedx$, and the height of the boxes is given by the standard deviation, $\sigma$. The lower panel shows the ratio between the Plateau and MIP $\mdedx$. The statistical uncertainty is smaller than the marker sizes. These results were obtained for pp collisions at $\sqrt{s}=$2.76 TeV. | 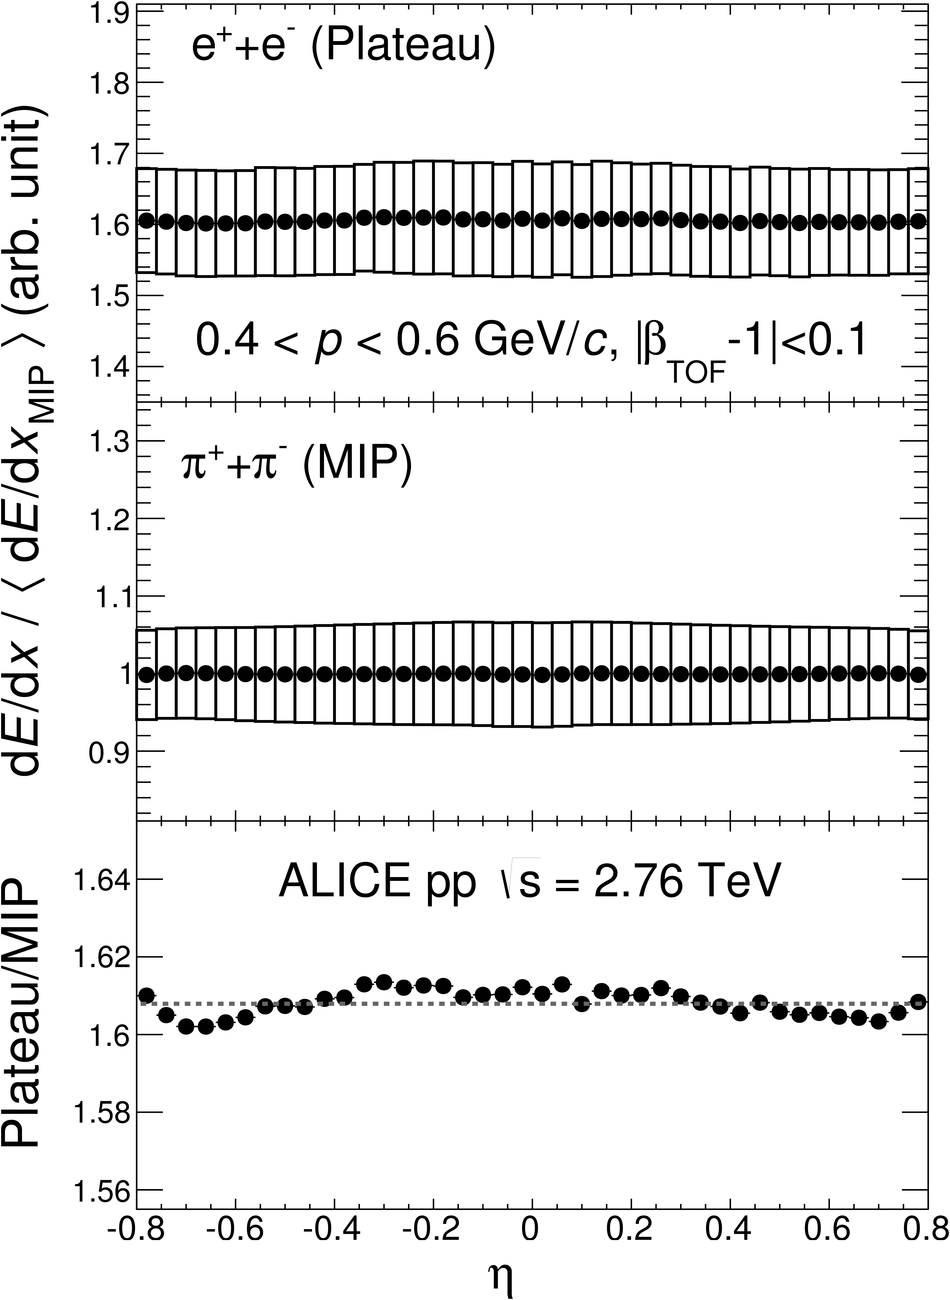 |
Figure 4
Number of clusters used in the $\dedx$ calculation for $\pt>2 \gevc$ without (squares) and with (circles) the geometric cut. Results are presented for pp (upper panel) and central $\pbpb$ (lower panel) collisions at $\sqrt{s_{\rm NN}}=$ 2.76 TeV. The minimum number of clusters on a track is 70. | 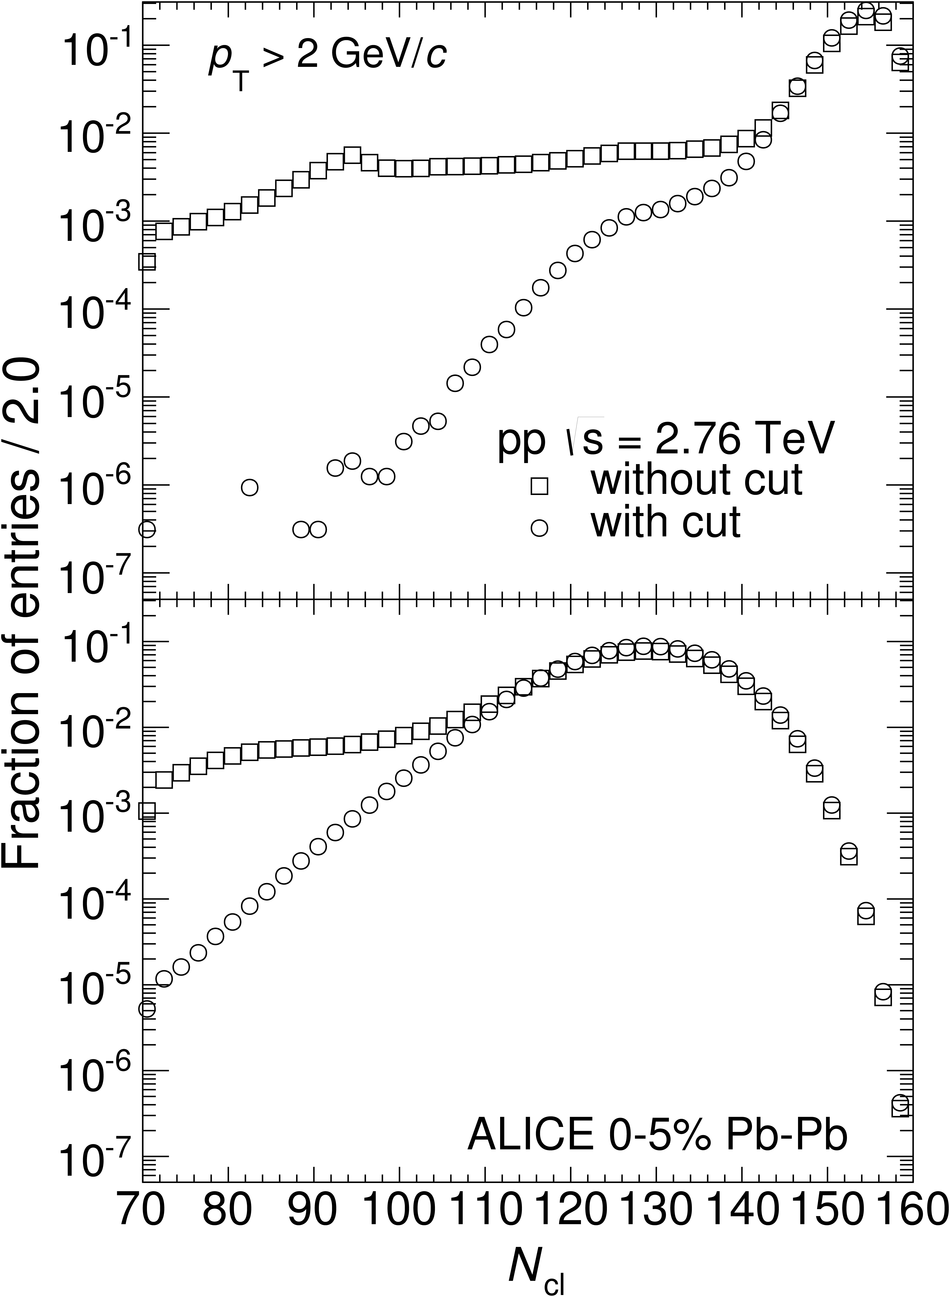 |
Figure 5
Four-Gaussian fits (line) to the $\dedx$ spectra (markers) for tracks having momentum in the range 3.4-3.6 $\gevc$ (upper figure) and 8.0-9.0 $\gevc$ (lower figure) with $|\eta|< 0.2$. In each panel, the signals of pions (rightmost Gaussian), kaons, and protons (leftmost Gaussian) are shown as red, green, and blue dashed areas, respectively. The contribution of electrons is small ($< 1\%$) and therefore not visible in the figure. Results for all six $\pbpb$ centrality classes are presented. The $\dedx$ spectra have all been normalized to have unit integrals. | 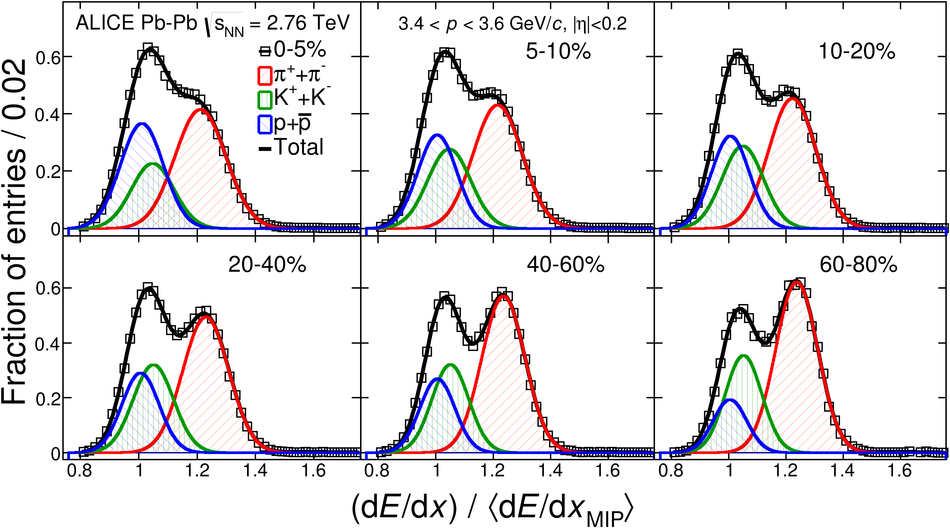 |
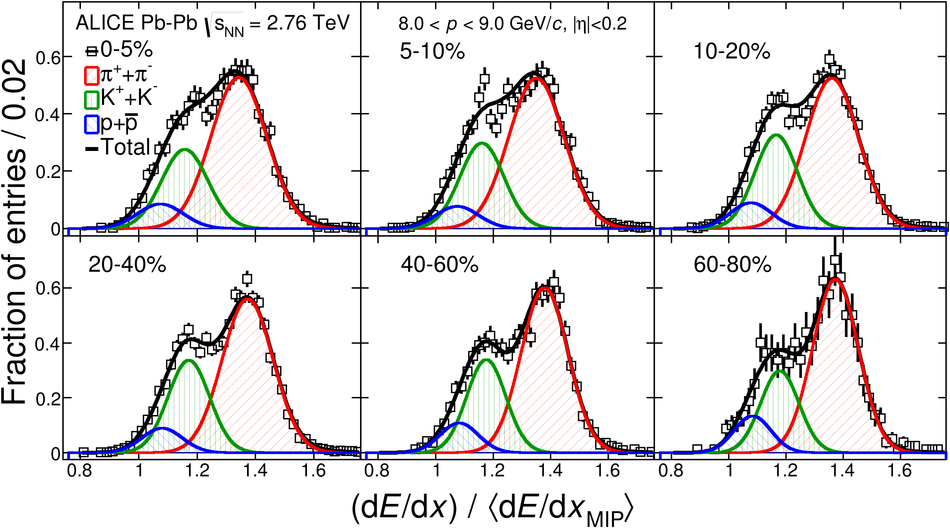
Figure 6
$\dedx$ spectra for secondary pions (top panel) and protons (bottom panel) identified via the reconstruction of the weak decay topology of ${\rm K_{S}^{0}}$ and $\Lambda$, respectively. A narrow invariant-mass cut reducing statistics was applied to select clean samples (but the pion sample still contains a small visible proton background). The curves are single Gaussian fits to the data and the reduced $\chi^2$ is calculated in the range indicated by the fit curves only. | 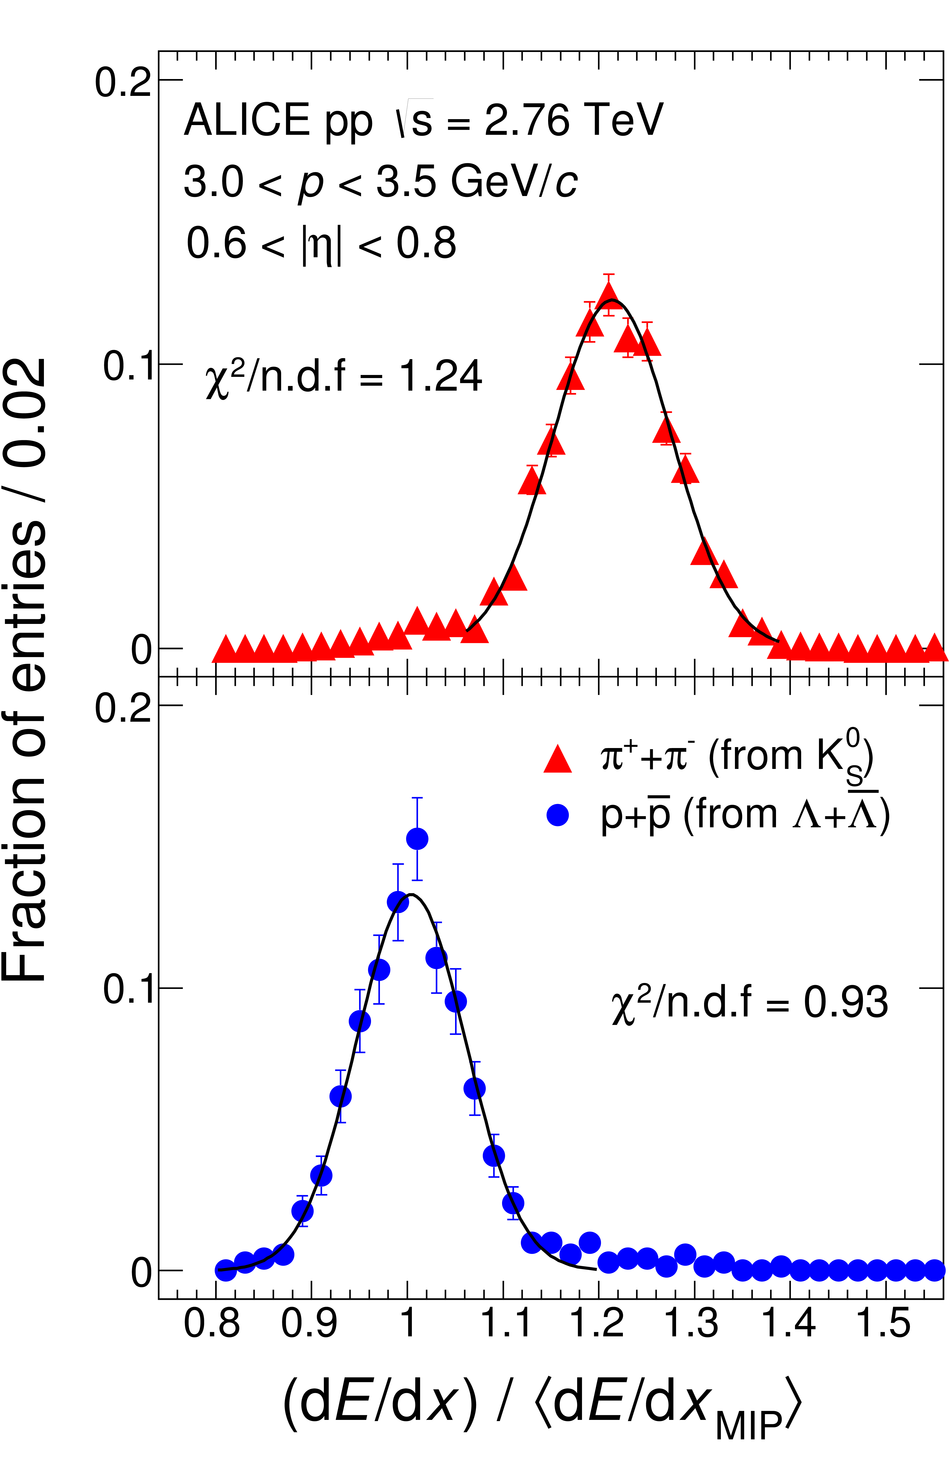 |
Figure 7
$\dedx$ spectra for secondary pions (open triangles) and protons (full circles) identified via the reconstruction of the weak decay topology of ${\rm K_{S}^{0}}$ and $\Lambda$, respectively. The spectra have been normalized to have the same integrals. The spectrum for primary pions (full triangles) is obtained by requiring $\beta_{\rm TOF} > 1$. Results for peripheral (upper panel) and central (lower panel) $\pbpb$ collisions are shown. The tracks were chosen in the momentum (pseudorapidity) interval $5< p< \gevc{7}$ ($0.6\leq|\eta|< 0.8$). Note that most spectra also contain a well-understood background. | 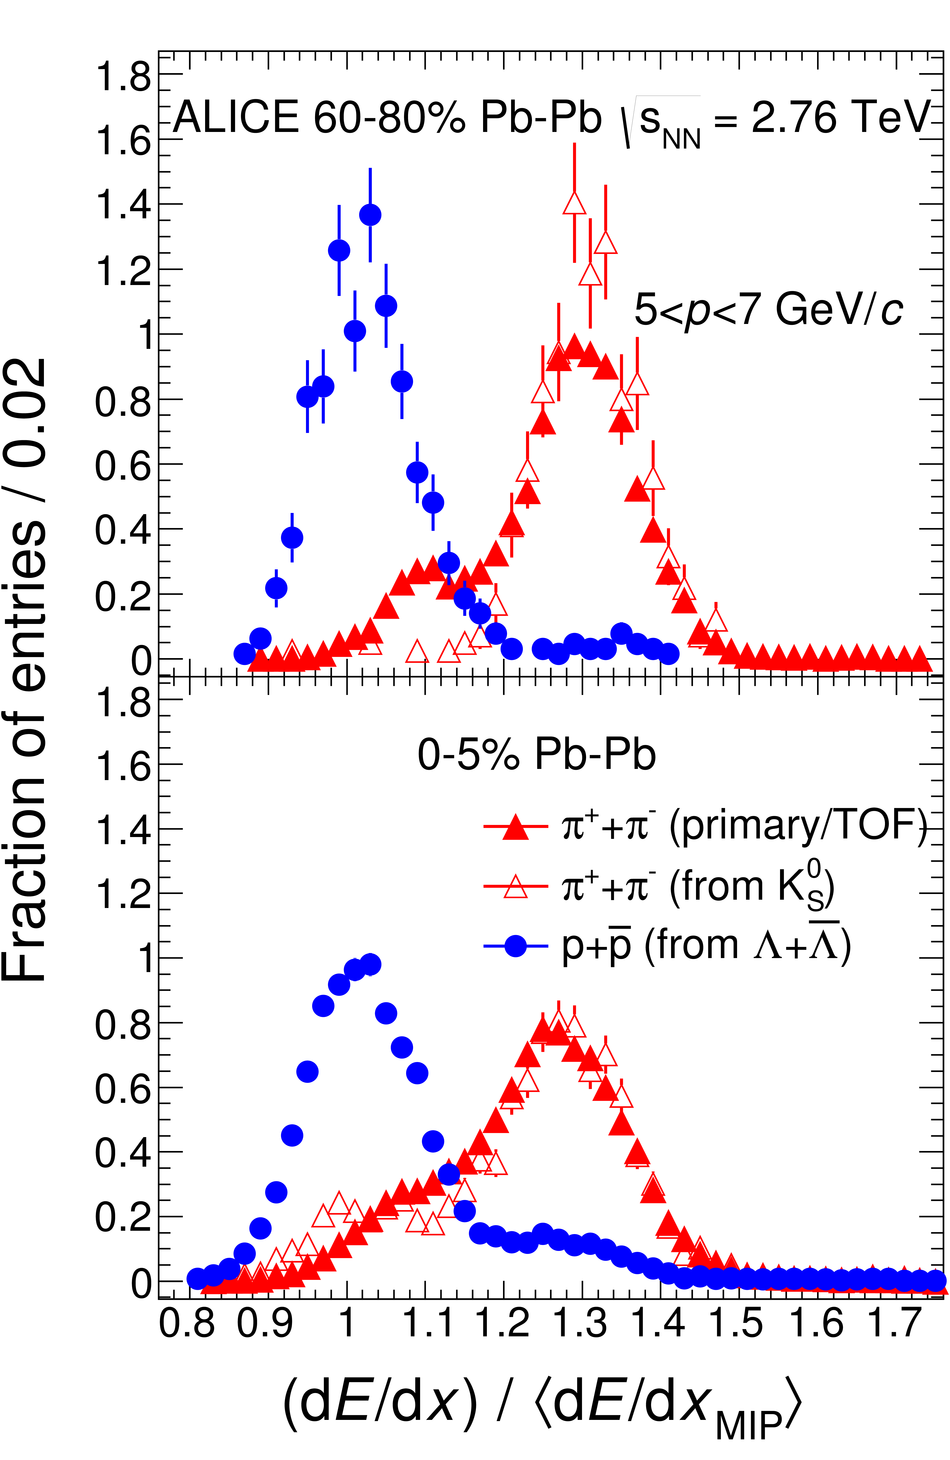 |
Figure 8
Final Bethe-Bloch (upper figure) and resolution (lower figure) curves obtained as described in the text. Results are shown for pp (left panels) and 0-5% $\pbpb$ (right panels) collisions. The Bethe-Bloch curve is shown in the region relevant for pions, kaons, and protons in this analysis. The external PID data samples of pions, protons and electrons are used to obtain the parameterizations, these data are plotted as markers. The shaded areas represent the systematic uncertainty of the parameterizations. | 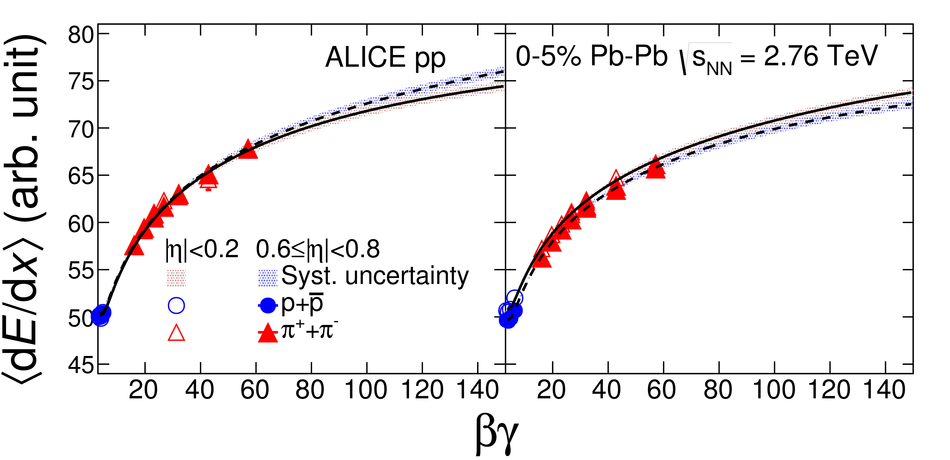 |
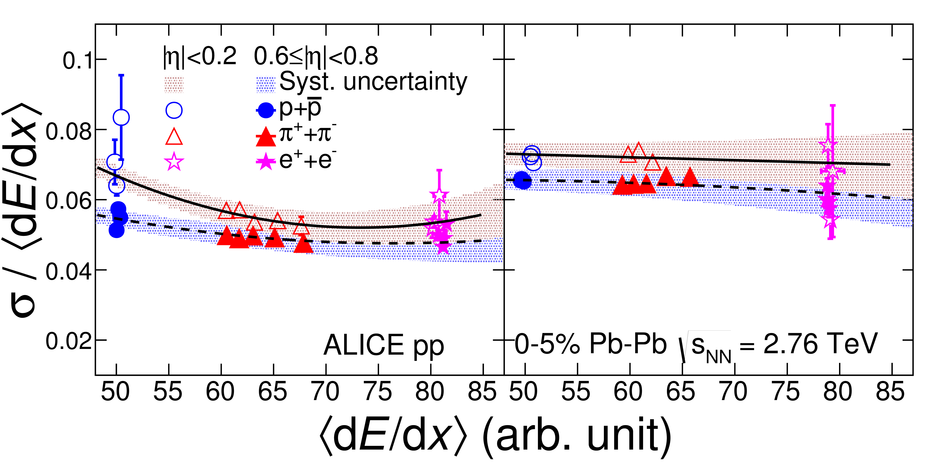
Figure 9
Uncorrected particle fractions as a function of momentum (upper figure) and as a function of $\pt$ (lower figure) for $|\eta|< 0.2$ (full markers) and $0.6\leq|\eta|< 0.8$ (empty markers). Charged pions, kaons, and (anti)protons are plotted with circles, squares, and triangles, respectively. The error bars indicate the statistical uncertainty Results for six centrality classes are presented. | 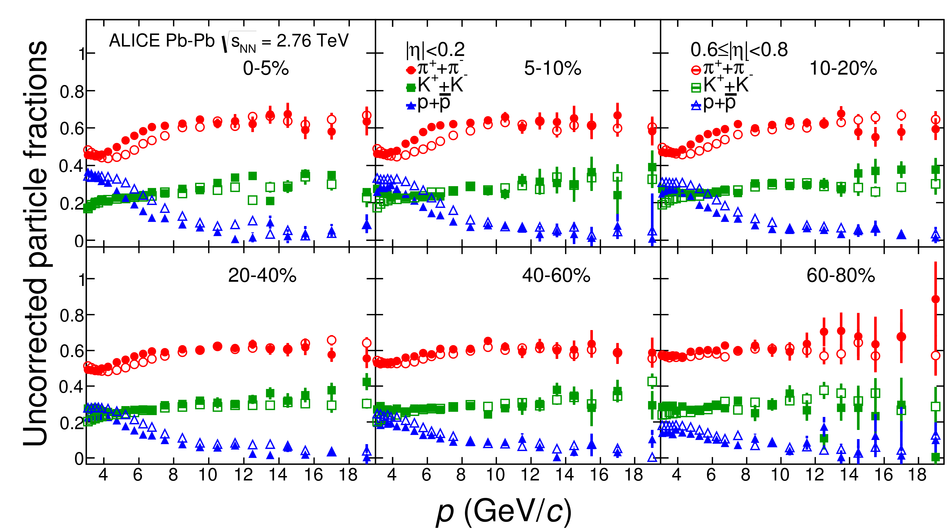 |

Figure 10
Correction factors as a function of $\pt$. These are applied to the fractions of pions (left panels), kaons (middle panels), and protons (right panels). Results are presented for peripheral (upper figure) and central (lower figure) $\pbpb$ collisions. The correction to the pion fraction due to the muon contamination is not drawn, but is $\leq 1\%$. Only pions and protons are corrected for feed-down. | 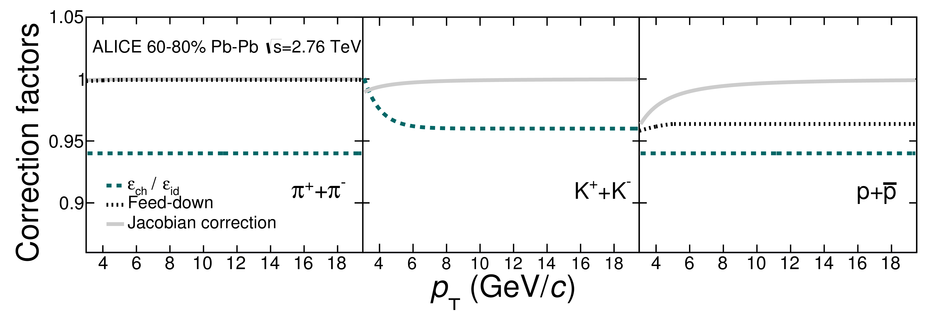 |

Figure 11
Upper figure: Relative variation of the width parameterizations with respect to the measured values in different $\dedx / \langle \dedx_{\rm MIP} \rangle$ intervals. Lower figure: Relative variation of the Bethe-Bloch $\mdedx$ parameterization with respect to the measured values in different $\dedx / \langle \dedx_{\rm MIP} \rangle$ intervals. The distributions were constructed using all the available data, six centrality classes and pp collisions with four sub-samples ($|\eta|$ intervals) each. | 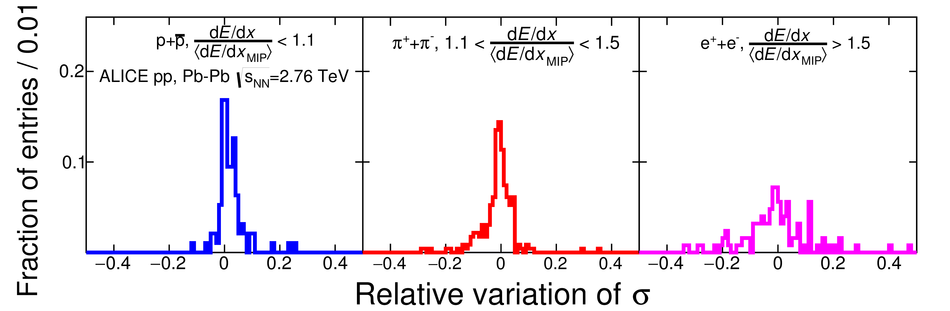 |
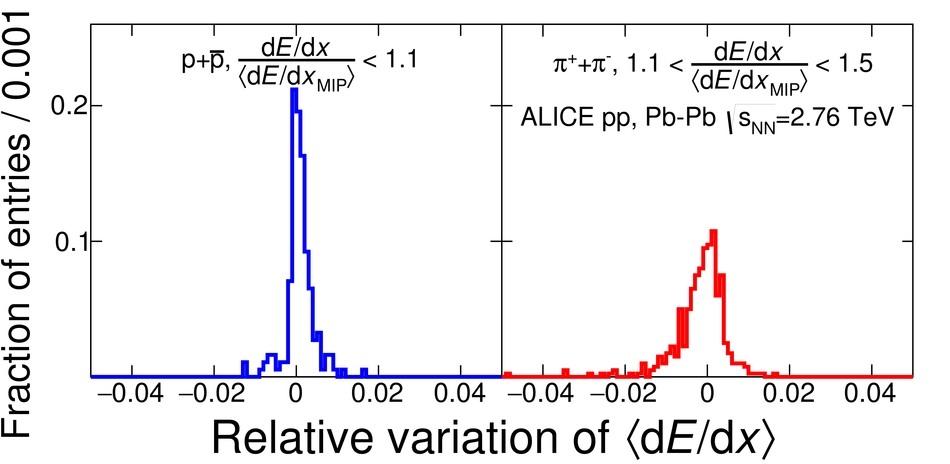
Figure 12
An example of the systematic uncertainty estimation in 0-5% $\pbpb$ and pp collisions for $3.4 < p \leq 3.6 \gevc$. Upper figure: From left to right: the variation of extracted fractional yields for pions (left panel), kaons (middle panel), and protons (right panel) when the fixed values for the $\mdedx$ and the resolution are randomly varied. Lower figure: the corresponding variation of the particle ratios. | 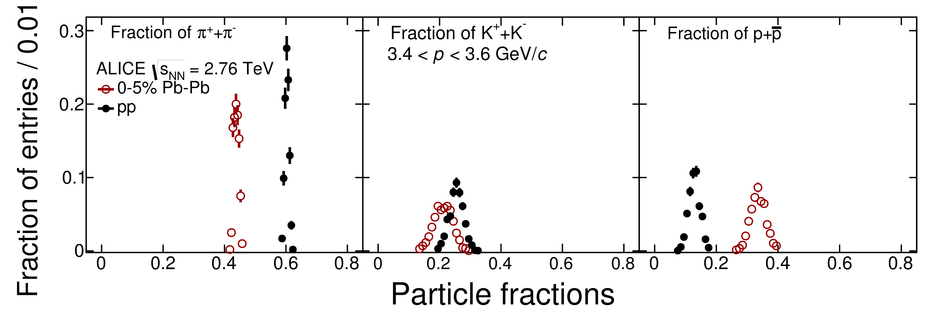 |

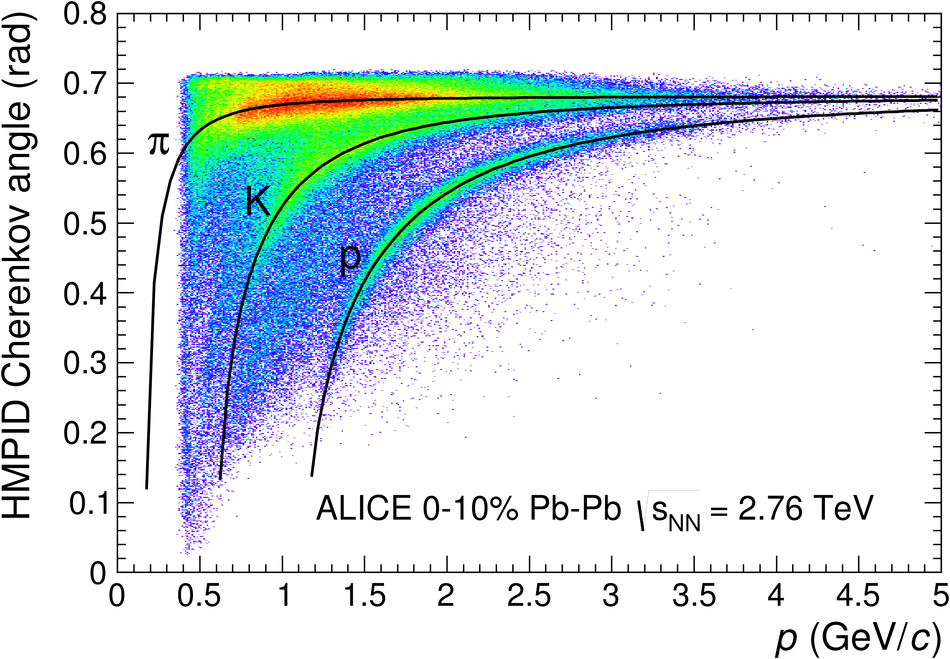
Figure 14
Distribution of the $X$ (left panel) and $Y$ (right panel) residuals between the matched cluster position and the closest extrapolated track point at the HMPID chamber plane (HMPID module 2), for positive and negative tracks with $\pt > 1.5 \gevc$ in $\pbpb$ collisions (0-50% centrality). The histograms have been scaled to have a similar maximum value. The small shift between positive and negative tracks in the $Y$ residuals is due to a radial residual misalignment and an imperfect estimate of the energy loss in the material traversed by the track and is not corrected for in the calculation of the residual distance. | 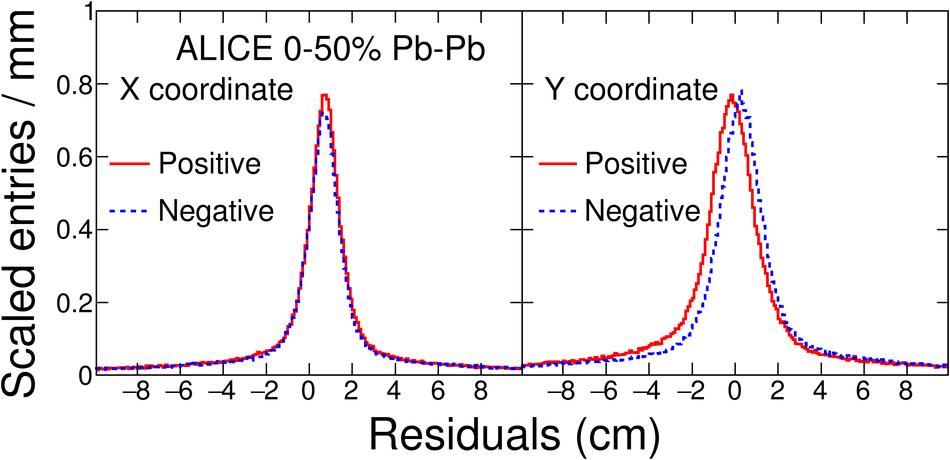 |
Figure 17
Distributions of the Cherenkov angle measured in the HMPID for positive tracks having $\pt$ in the range 2.6-2.7$ \gevc$ (upper figure) and in the range 3.8-4.0 $\gevc$ (lower figure), for six different centrality classes, 0-5%, 5-10%, 10-20%, 20-30%, 30-40%, and 40-50%. The histograms have been scaled to have a similar maximum value. The shoulder in the distributions starting at 0.7 rad is a boundary effect due to the finite chamber geometrical acceptance. | 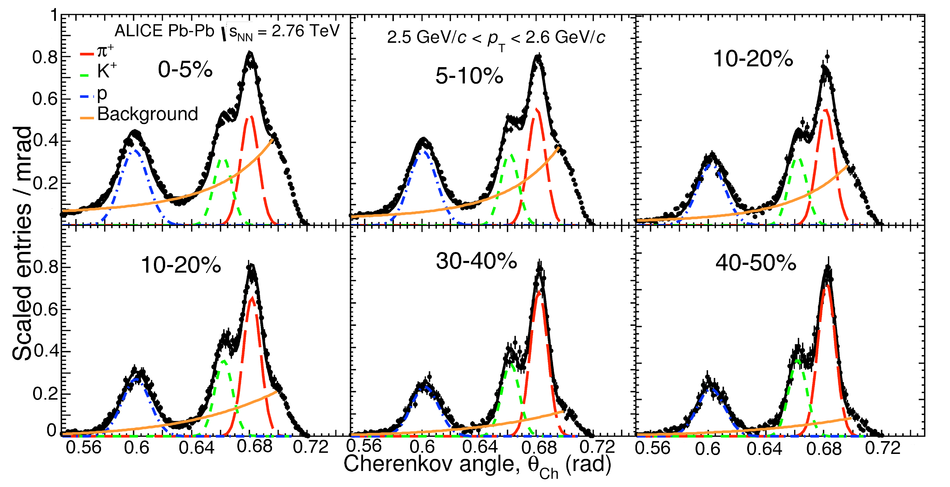 |
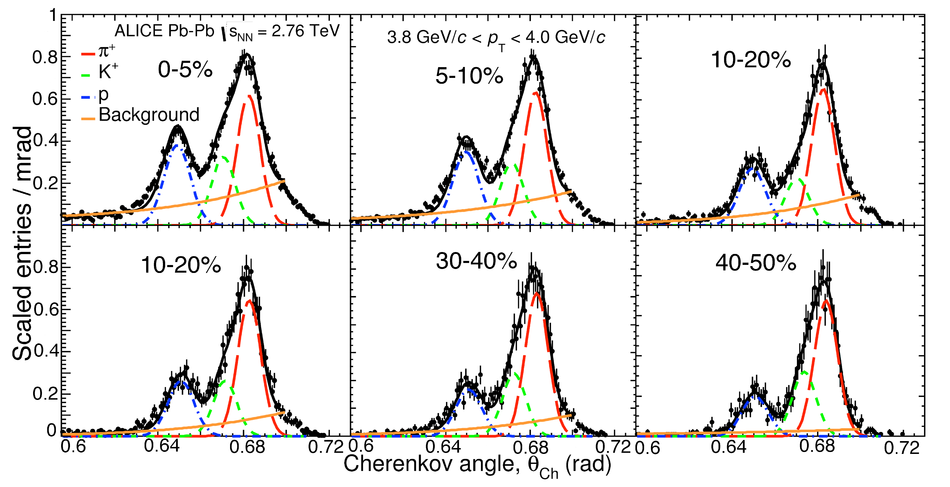
Figure 18
Mean Cherenkov angle (upper panel) and standard deviation (lower panel) values for pions, kaons, and protons obtained by the three-Gaussian fitting procedure as a function of $\pt$ for 0-5% and 40-50% centrality $\pbpb$ collisions. The data points from the two different centrality classes overlap such that the difference is smaller than the size of the symbols used. | 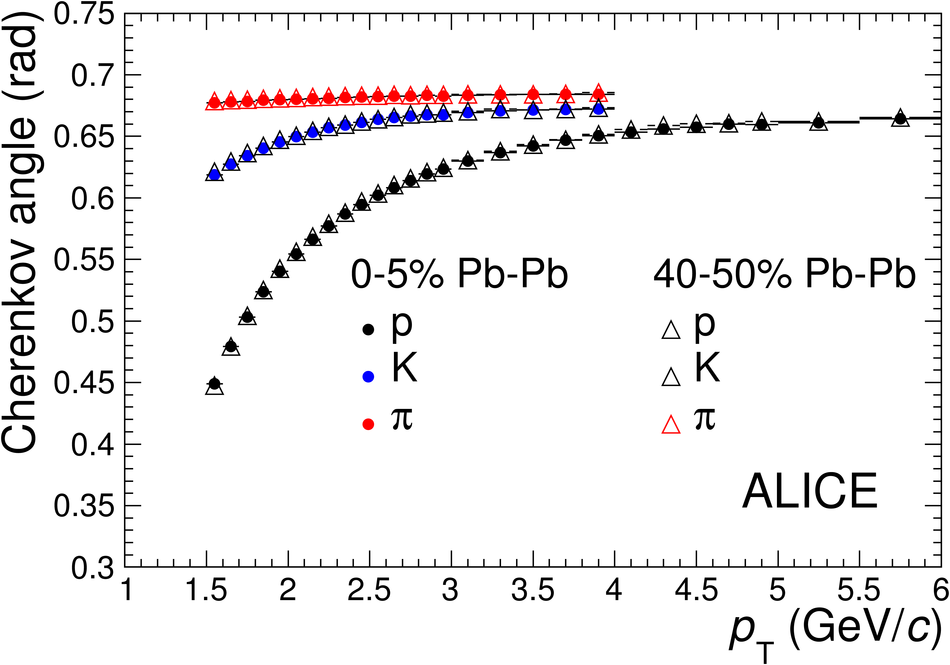 |

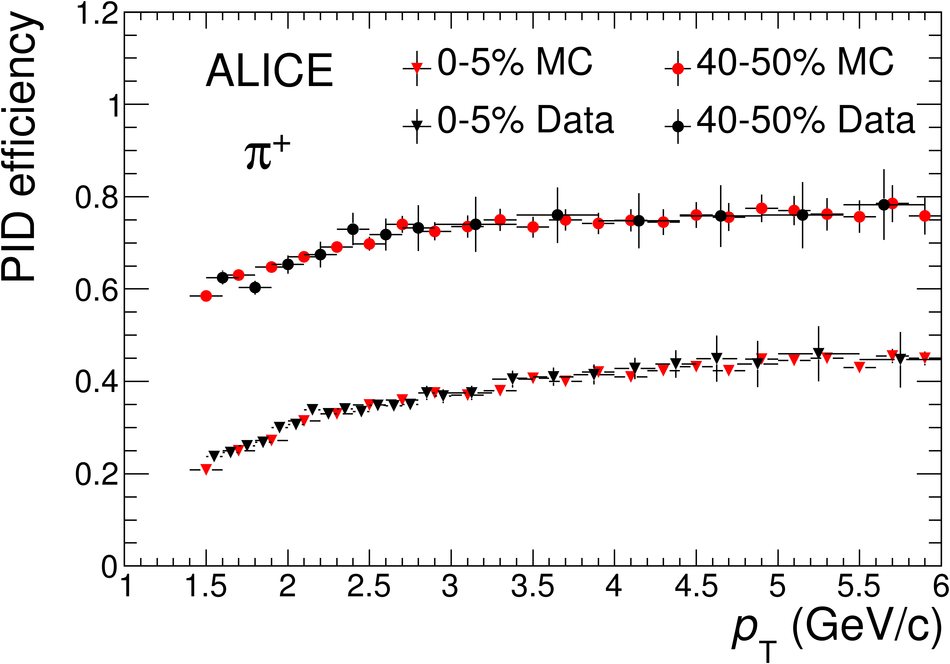
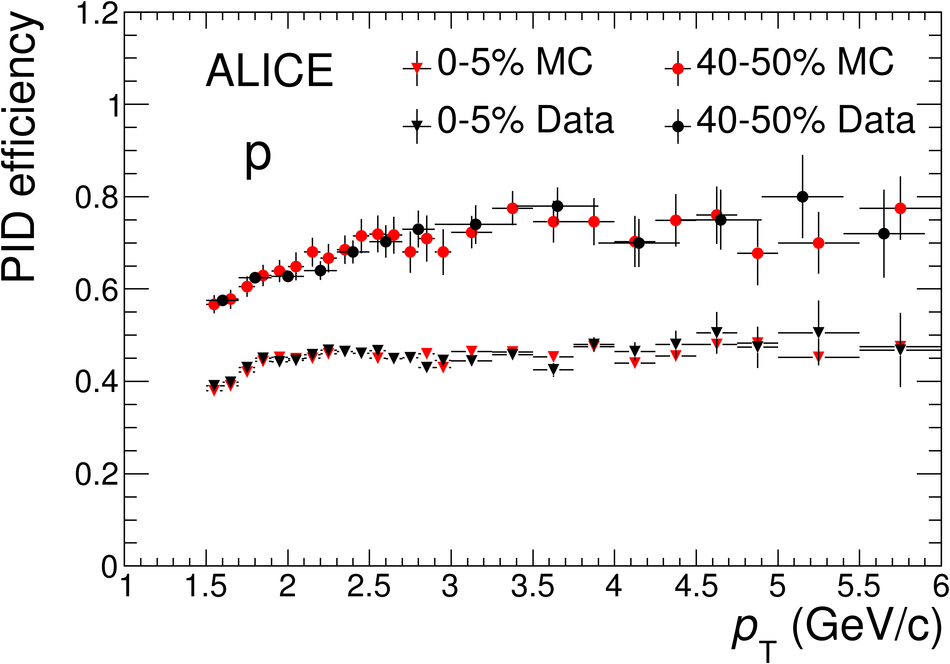
Figure 21
The ratio of individual spectra to the combined spectrum as a function of $\pt$ for pions (upper panels), kaons (middle panels), and protons (lower panels). From left-to-right the columns show 0-5%, 20-40%, and 60-80% (where there are no HMPID results). Only the $\pt$ range where the analyses overlap is shown. For $\pt > 4 \gevc$, no combination is done and the TPC $\dedx$ relativistic rise results are used directly, which gives rise to a small discontinuity for protons at this $\pt$. The ITS+TPC+TOF spectra are the results published in [44]. The statistical and independent systematic uncertainties are shown as vertical error bars and as a band, respectively, and only include those on the individual spectra. | 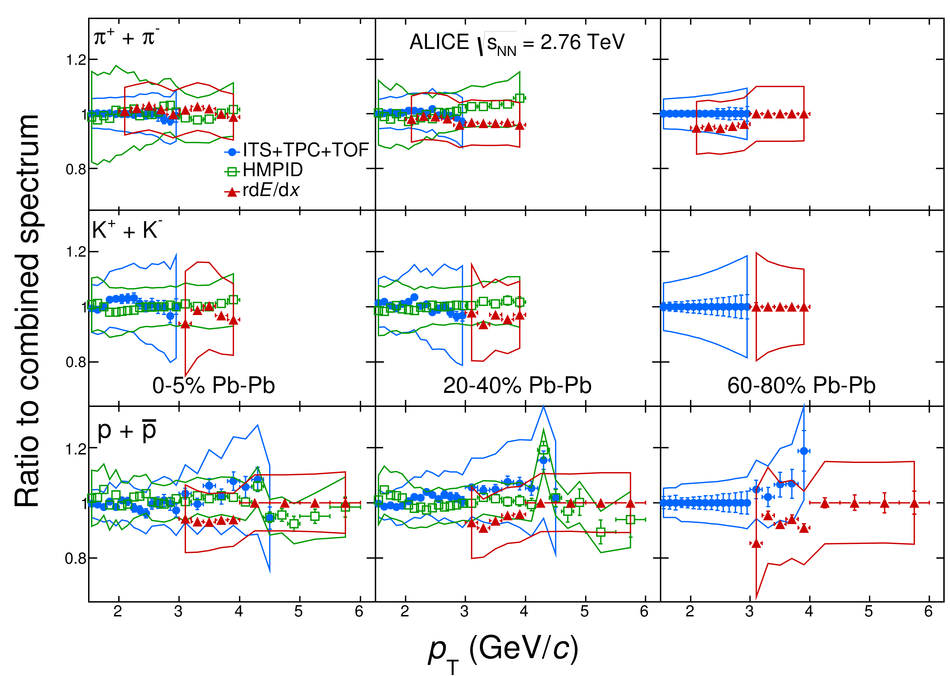 |
Figure 22
. Transverse momentum spectra of charged pions (left panel), kaons (middle panel), and (anti)protons (right panel) measured in \pbpb and \pp collisions at $\sqrt{s_{\rm NN}}=2.76$ TeV. The systematic and statistical error are plotted as color boxes and vertical error bars (hard to see), respectively. The spectra have been scaled by the factors listed in the legend for clarity. | 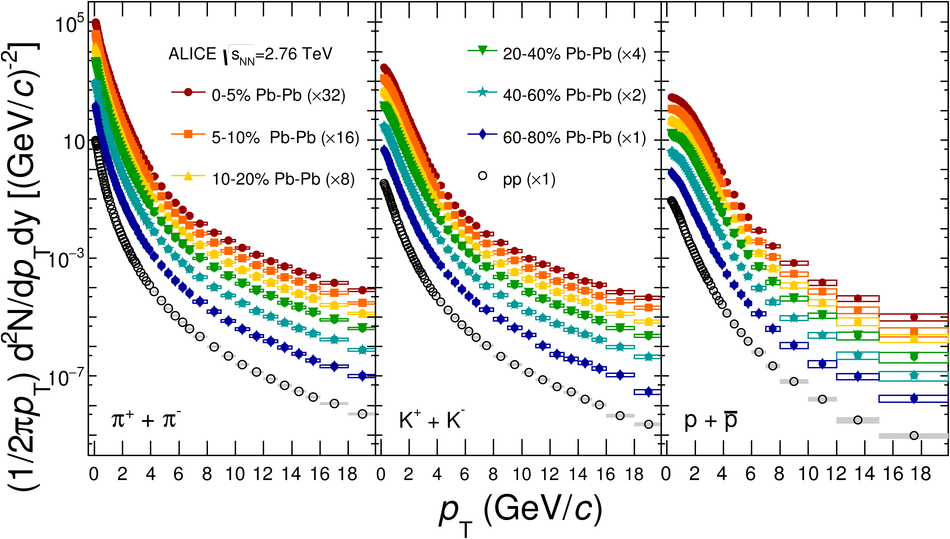 |
Figure 23
The nuclear modification factor $\raa$ as a function of $\pt$ for different particle species. Results for different collision centralities are shown. Statistical and PID systematic uncertainties are plotted as vertical error bars and boxes around the points, respectively. The total normalization uncertainty (pp and $\pbpb$) is indicated in each panel by the vertical scale of the box centered at $\pt = 1 \gevc$ and $\raa $= 1. | 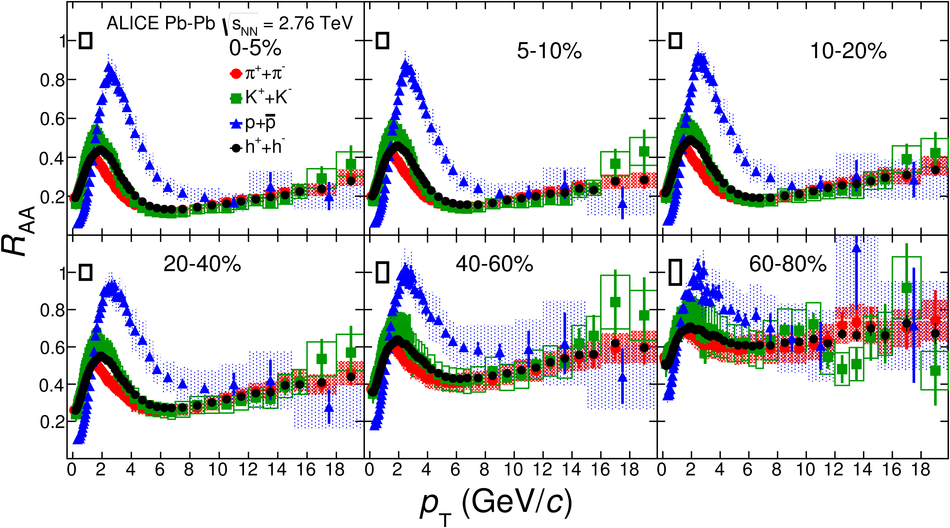 |
Figure 24
The nuclear modification factor $\raa$ as a function of $\pt$ for charged pions, compared with PHENIX results for neutral pions. Results for different collision centralities are shown. Statistical and PID systematic uncertainties are plotted as vertical error bars and boxes around the points, respectively. | 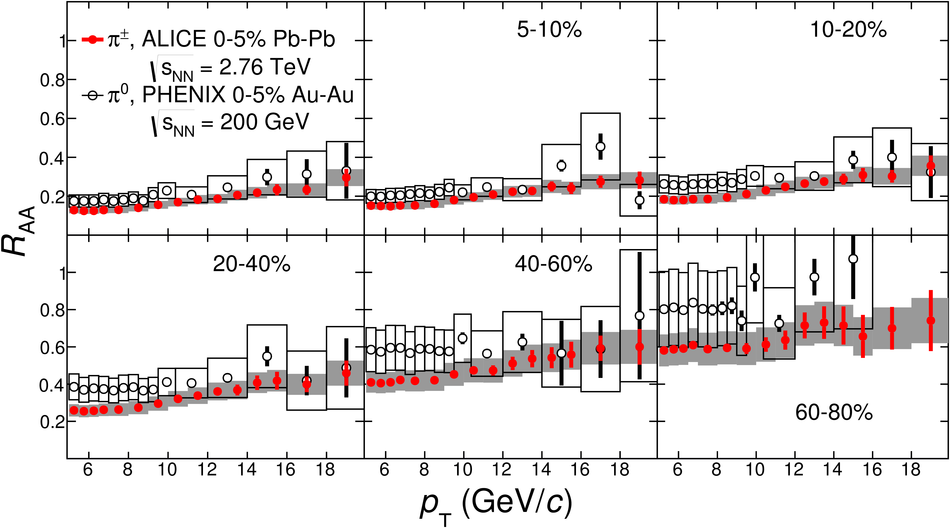 |
Figure 25
Charged kaon to charged pion ratio as a function of transverse momentum (solid markers). The upper figure shows the full $\pt$-range with the pp results (open markers) overlaid in the most central and the most peripheral centrality class. In the lower figure the $\pbpb$ results for $\pt < 8 \gevc$ are compared with EPOS model 2.17-3 (line). The systematic and statistical error are plotted as color boxes and vertical error bars, respectively. | 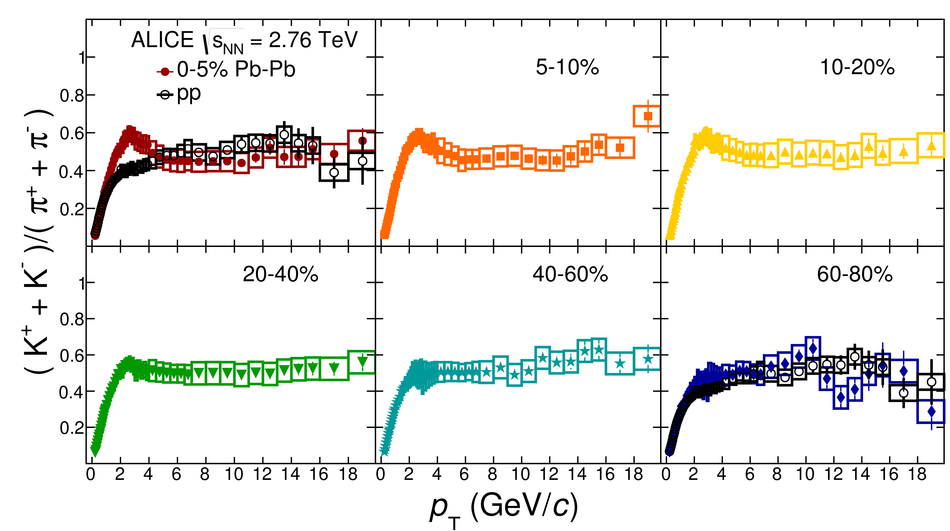 |

Figure 26
(Anti)proton to charged pion ratio as a function of transverse momentum (solid markers). The upper figure shows the full $\pt$-range with the pp results (open markers) overlaid in the most central and the most peripheral centrality class. In the lower figure the $\pbpb$ results for $\pt < 8 \gevc$ are compared with EPOS model 2.17-3 (line). The systematic and statistical error are plotted as color boxes and vertical error bars, respectively. | 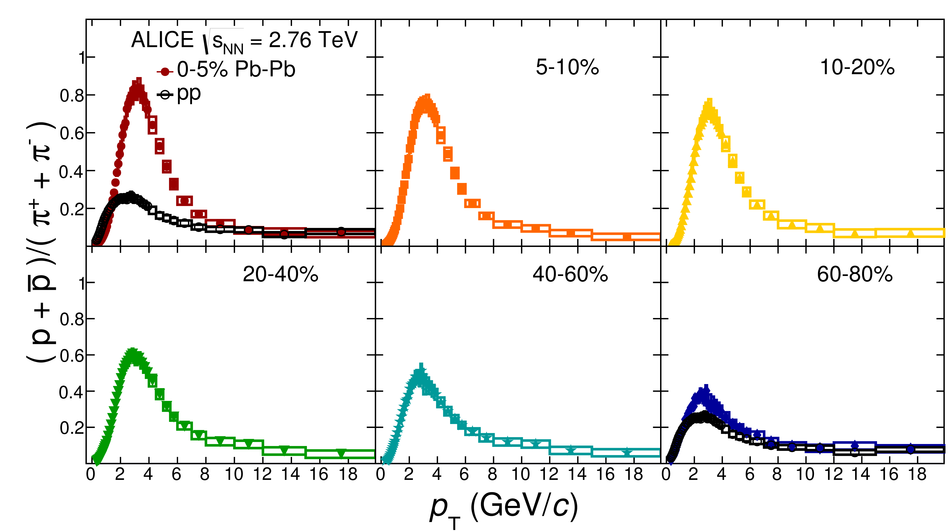 |
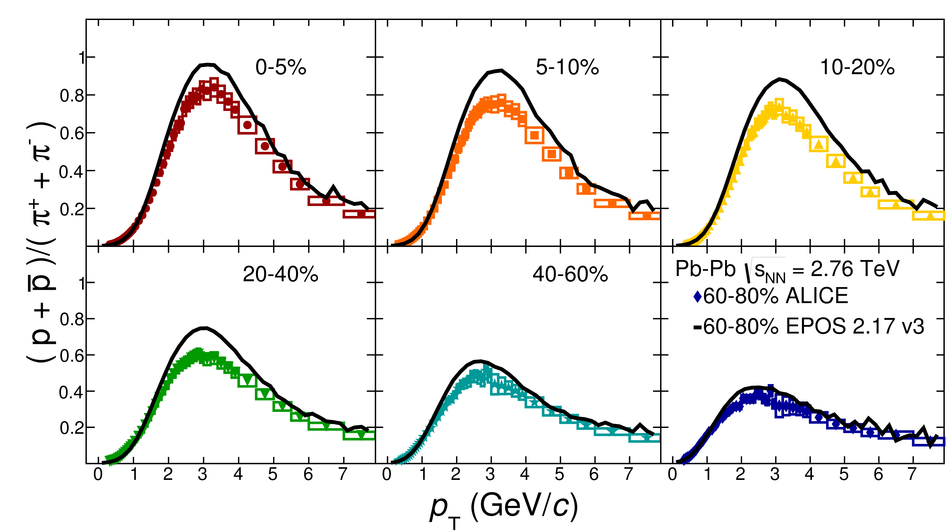
Figure 27
The integrated particle ratios for $\pt > 10 \gevc$ in pp and $\pbpb$ collisions as a function of the number of participants. Left panel: the kaon-to-pion ratio. Right panel: the proton-to-pion ratio scaled by a factor of 3 for clarity. Statistical and PID systematic uncertainties are plotted as vertical error bars and boxes around the points, respectively. Note that this kaon-to-pion (proton-to-pion) ``high-$\pt$'' ratio is ${\approx}4$ (${\approx}2$) times larger than the bulk ratio. | 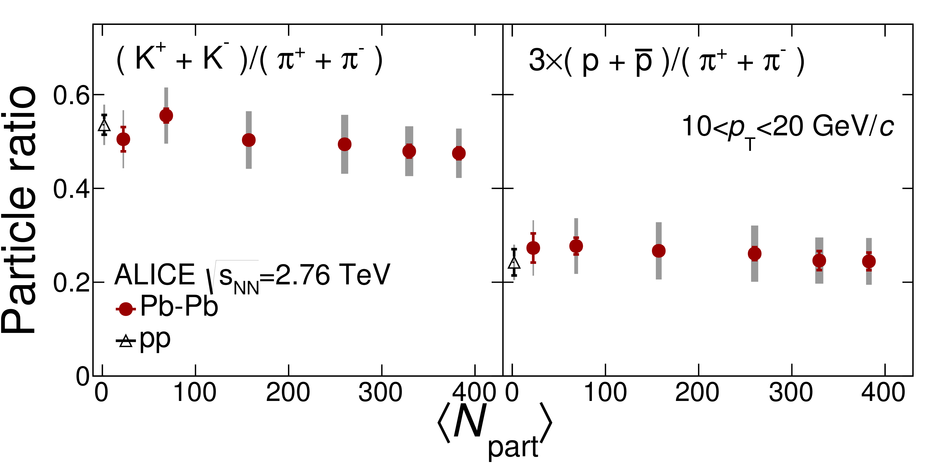 |
