Distribution of the $X$ (left panel) and $Y$ (right panel) residuals between the matched cluster position and the closest extrapolated track point at the HMPID chamber plane (HMPID module 2), for positive and negative tracks with $\pt > 1.5 \gevc$ in $\pbpb$ collisions (0-50% centrality). The histograms have been scaled to have a similar maximum value. The small shift between positive and negative tracks in the $Y$ residuals is due to a radial residual misalignment and an imperfect estimate of the energy loss in the material traversed by the track and is not corrected for in the calculation of the residual distance. | 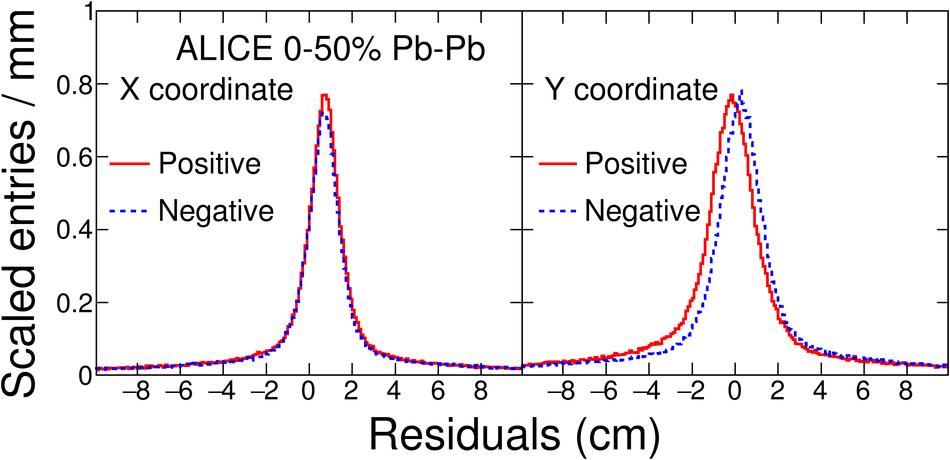 |