The ratio of individual spectra to the combined spectrum as a function of $\pt$ for pions (upper panels), kaons (middle panels), and protons (lower panels). From left-to-right the columns show 0-5%, 20-40%, and 60-80% (where there are no HMPID results). Only the $\pt$ range where the analyses overlap is shown. For $\pt > 4 \gevc$, no combination is done and the TPC $\dedx$ relativistic rise results are used directly, which gives rise to a small discontinuity for protons at this $\pt$. The ITS+TPC+TOF spectra are the results published in [44]. The statistical and independent systematic uncertainties are shown as vertical error bars and as a band, respectively, and only include those on the individual spectra. | 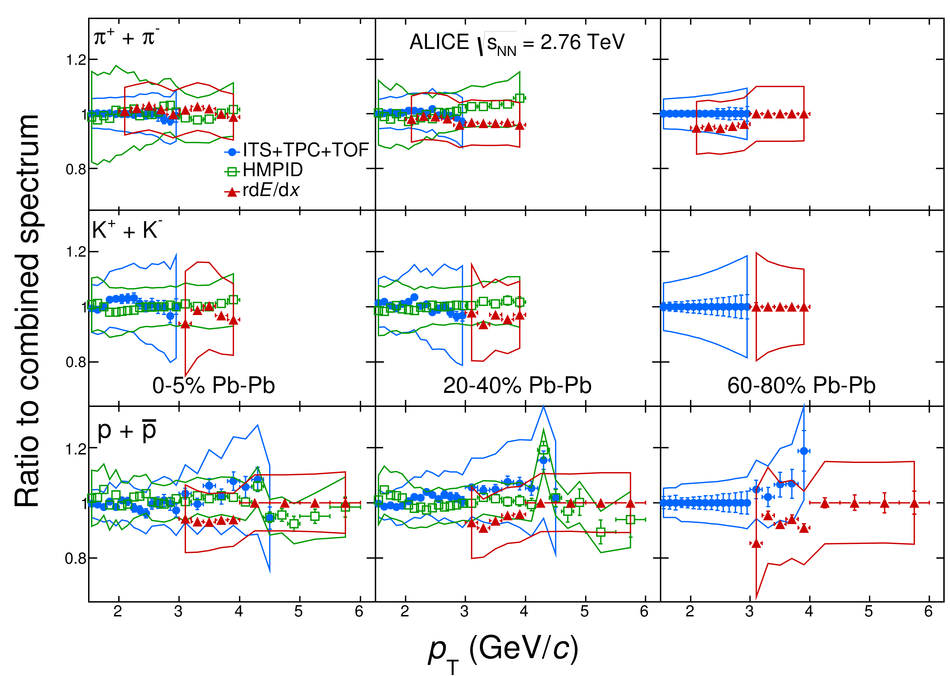 |