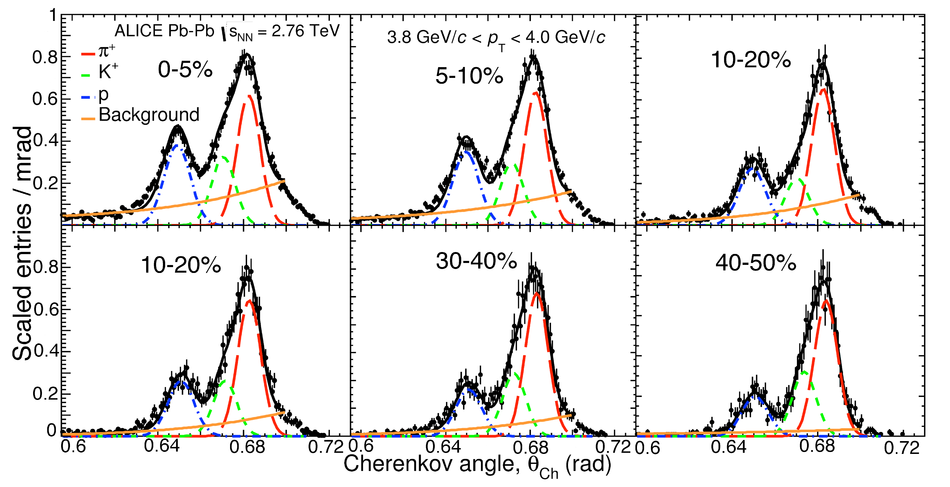
Distributions of the Cherenkov angle measured in the HMPID for positive tracks having $\pt$ in the range 2.6-2.7$ \gevc$ (upper figure) and in the range 3.8-4.0 $\gevc$ (lower figure), for six different centrality classes, 0-5%, 5-10%, 10-20%, 20-30%, 30-40%, and 40-50%. The histograms have been scaled to have a similar maximum value. The shoulder in the distributions starting at 0.7 rad is a boundary effect due to the finite chamber geometrical acceptance. | 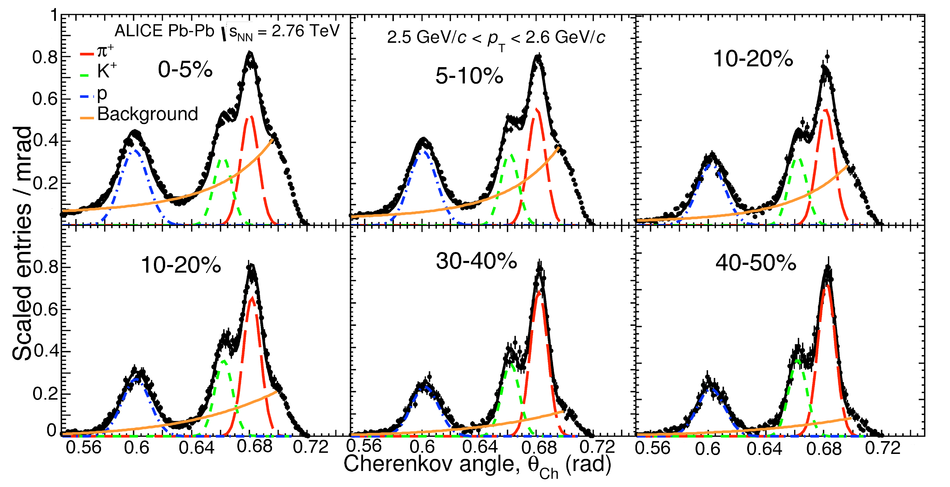 |