Prompt D meson and non-prompt J/$\psi$ yields are studied as a function of the multiplicity of charged particles produced in inelastic proton-proton collisions at a centre-of-mass energy of $\sqrt{s}=7$ TeV. The results are reported as a ratio between yields in a given multiplicity interval normalised to the multiplicity-integrated ones (relative yields). They are shown as a function of the multiplicity of charged particles normalised to the average value for inelastic collisions (relative charged-particle multiplicity). D$^0$, D$^+$ and D$^{*+}$ mesons are measured in five $p_{\rm T}$ intervals from 1 to 20 GeV/$c$ and for $|y|< 0.5$ via their hadronic decays. The D-meson relative yield is found to increase with increasing charged-particle multiplicity. For events with multiplicity six times higher than the average multiplicity of inelastic collisions, a yield enhancement of a factor about 15 relative to the multiplicity-integrated yield in inelastic collisions is observed. The yield enhancement is independent of transverse momentum within the uncertainties of the measurement. The D$^0$-meson relative yield is also measured as a function of the relative multiplicity at forward pseudorapidity. The non-prompt J/$\psi$, i.e. the B hadron, contribution to the inclusive J/$\psi$ production is measured in the di-electron decay channel at central rapidity. It is evaluated for $p_{\rm T}>1.3$ GeV/$c$ and $|y|< 0.9$, and extrapolated to $p_{\rm T}>0$. The fraction of non-prompt J/$\psi$ in the inclusive J/$\psi$ yields shows no dependence on the charged-particle multiplicity at central rapidity. Charm and beauty hadron relative yields exhibit a similar increase with increasing charged-particle multiplicity. The measurements are compared to PYTHIA 8, EPOS 3 and percolation calculations.
JHEP 09 (2015) 148
HEP Data
e-Print: arXiv:1505.00664 | PDF | inSPIRE
CERN-PH-EP-2015-091
Figure 1
$\Dzero$ and $\Dplus$ invariant mass and $\Dstar$ mass difference distributions for selected $\pt$ and $N_{\rm tracklets}$ intervals for pp collisions at $\sqrt{s}=7$ TeV with $\mathcal{L}_{\rm int} = 5 \rm nb^{-1}$ The $\Dzero$ distributions are shown for $2< \pt< 4 \mathrm{GeV}/c$ (top-panels), the $\Dplus$ for $4< \pt< 8 \mathrm{GeV}/c$ (middle-panels), and the $\Dstar$ for $8< \pt< 12 \mathrm{GeV}/c$ (bottom-panels) The $N_{\rm tracklets} \in$ [1,8], [14,19] and [31,49] intervals are shown in the left, middle and right panels respectively The fits to the candidate invariant mass distributions are also shown. | 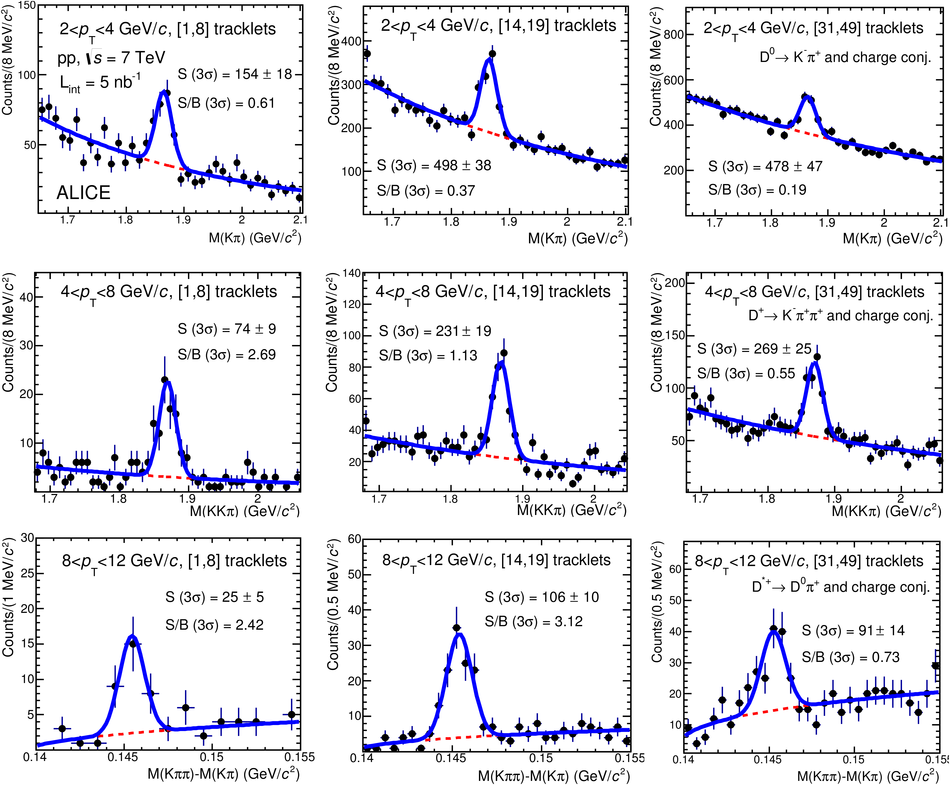 |
Figure 2
$\Dzero$, $\Dplus$ and $\Dstar$ meson relative yields for each $\pt$ interval as a function of charged-particle multiplicity at central rapidity The relative yields are presented on the top panels with their statistical (vertical bars) and systematic (boxes) uncertainties, except for the feed-down fraction uncertainty that is drawn separately in the bottom panels $\Dzero$ mesons are represented by red circles, $\Dplus$ by green squares, and $\Dstar$ by blue triangles The position of the points on the abscissa is the average value of $({\rm d}N_{\rm ch}/{\rm d}\eta) \big/ \langle {\rm d}N_{\rm ch}/{\rm d}\eta \rangle$. For $\Dplus$ and $\Dstar$ mesons the points are shifted horizontally by 1.5% to improve the visibility The diagonal (dashed) line is also shown to guide the eye
| 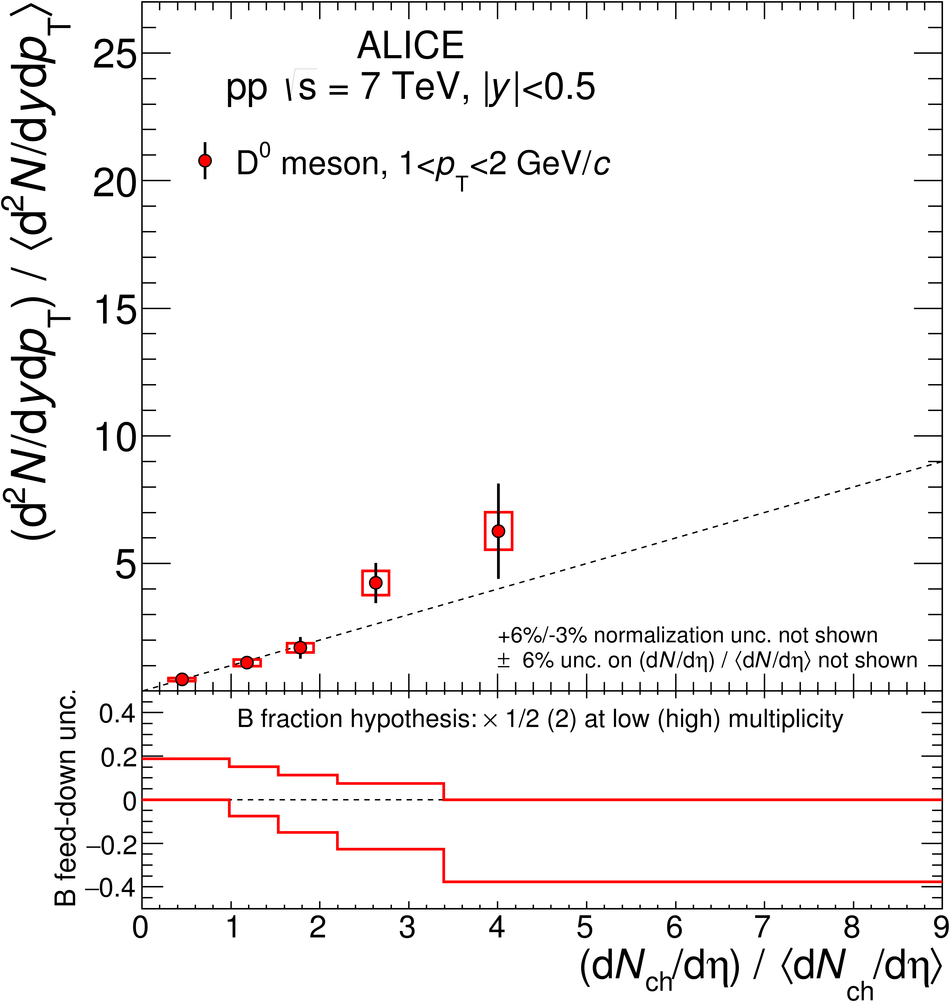 |
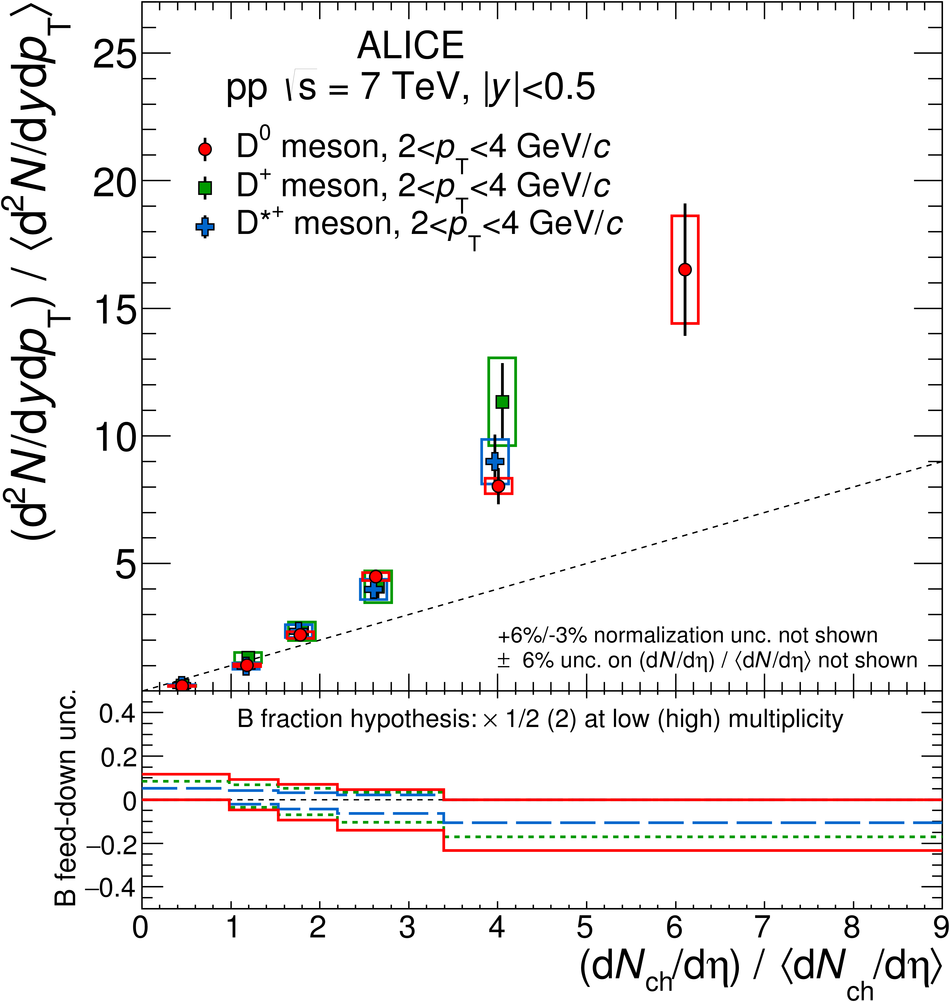
Figure 3
$\Dzero$, $\Dplus$ and $\Dstar$ meson relative yields for each $\pt$ interval as a function of charged-particle multiplicity at central rapidity The relative yields are presented on the top panels with their statistical (vertical bars) and systematic (boxes) uncertainties, except for the feed-down fraction uncertainty that is drawn separately in the bottom panels $\Dzero$ mesons are represented by red circles, $\Dplus$ by green squares, and $\Dstar$ by blue triangles The position of the points on the abscissa is the average value of $({\rm d}N_{\rm ch}/{\rm d}\eta) \big/ \langle {\rm d}N_{\rm ch}/{\rm d}\eta \rangle$ For $\Dplus$ and $\Dstar$ mesons the points are shifted horizontally by 1.5% to improve the visibility The diagonal (dashed) line is also shown to guide the eye | 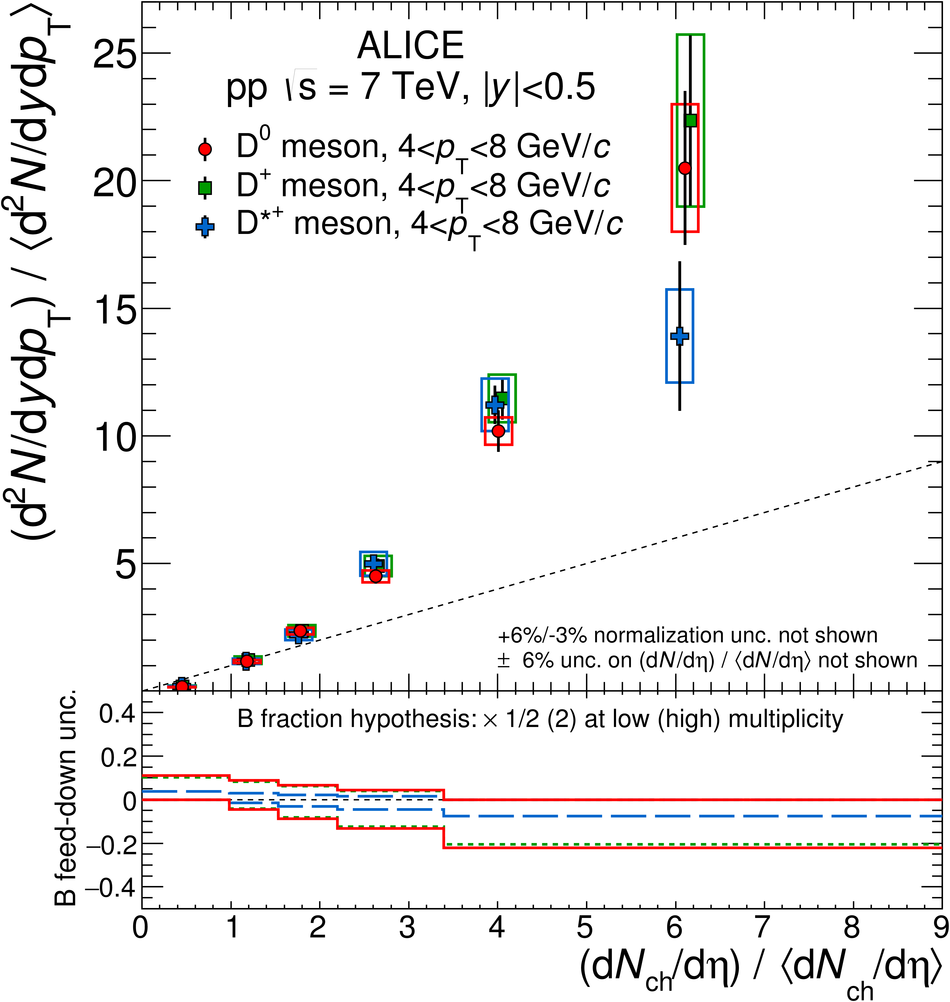 |

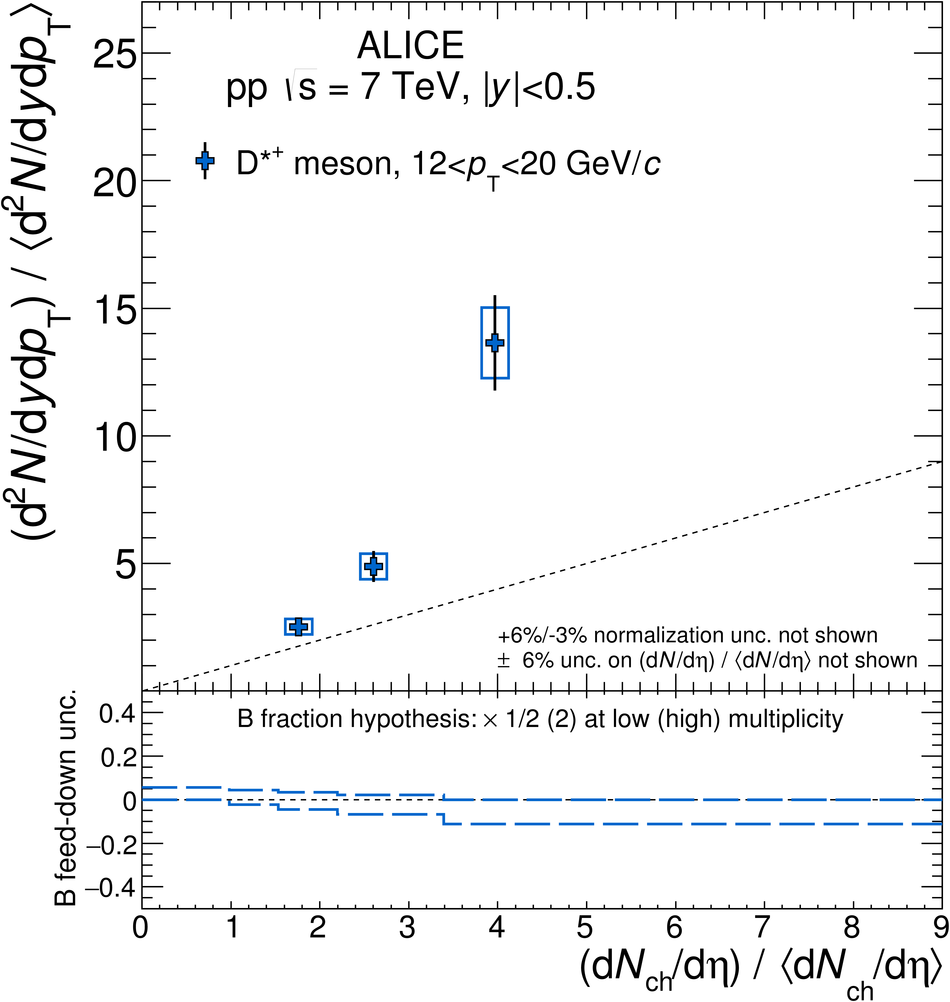
Figure 4
Average of $\Dzero$, $\Dplus$ and $\Dstar$ relative yields as a function of the relative charged-particle multiplicity at central rapidity (a) Average of D-meson relative yields in $\pt$ intervals (b) Ratio of the average relative yields in all $\pt$ intervals with respect to that of the $2< \pt< 4 \mathrm{GeV}/c$ interval The results are presented in the top panels with their statistical (vertical bars) and systematic (boxes) uncertainties, except for the feed-down fraction uncertainty that is drawn separately in the bottom panels The position of the points on the abscissa is the average value of $({\rm d}N_{\rm ch}/{\rm d}\eta) \big/ \langle {\rm d}N_{\rm ch}/{\rm d}\eta \rangle$ For some $\pt$ intervals the points are shifted horizontally by 1.5% to improve the visibility The dashed lines are also shown to guide the eye, a diagonal on (a) and a constant on (b)
| 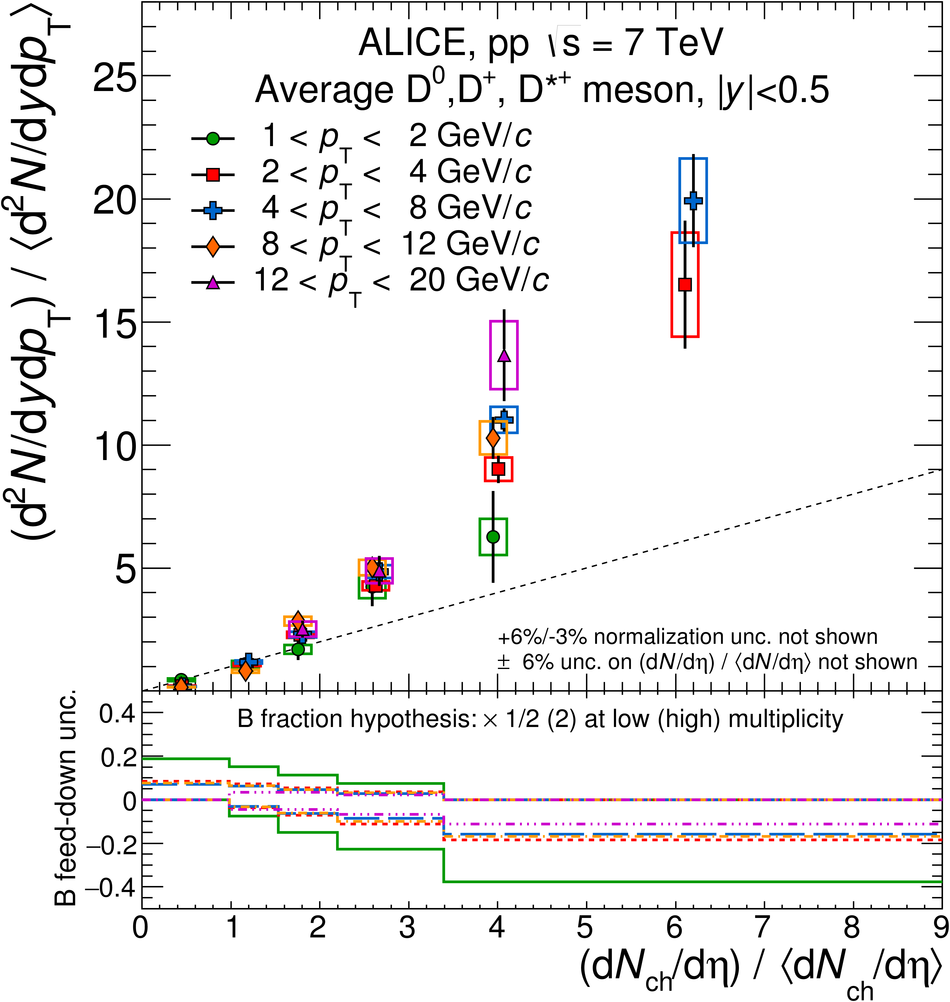 |
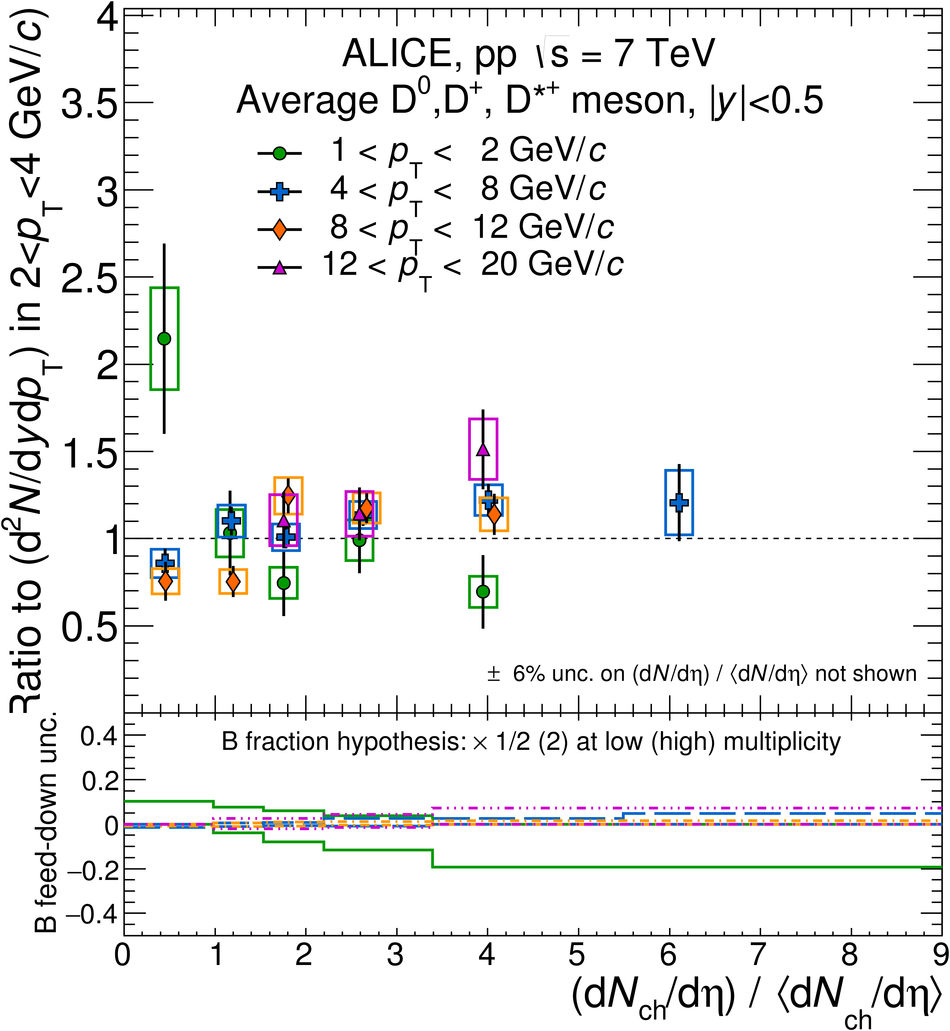
Figure 5
$\Dzero$ meson relative yields at $|y|< 0.5$ for two $\pt$ intervals as a function of the relative charged-particle multiplicity, $N_{\rm V0}$, measured at $-3.7 < \eta < -1.7$ and $2.8 < \eta < 5.1$ The relative yields are presented on the top panels with their statistical (vertical bars) and systematic (boxes) uncertainties, except the uncertainty on the feed-down fraction which is drawn separately in the bottom panels The position of the points on the abscissa is at the average value of $N_{\rm V0} \big/ \langle N_{\rm V0} \rangle$,shifted by 1.5% to improve the visibility The diagonal (dashed) line is also shown to guide the eye
| 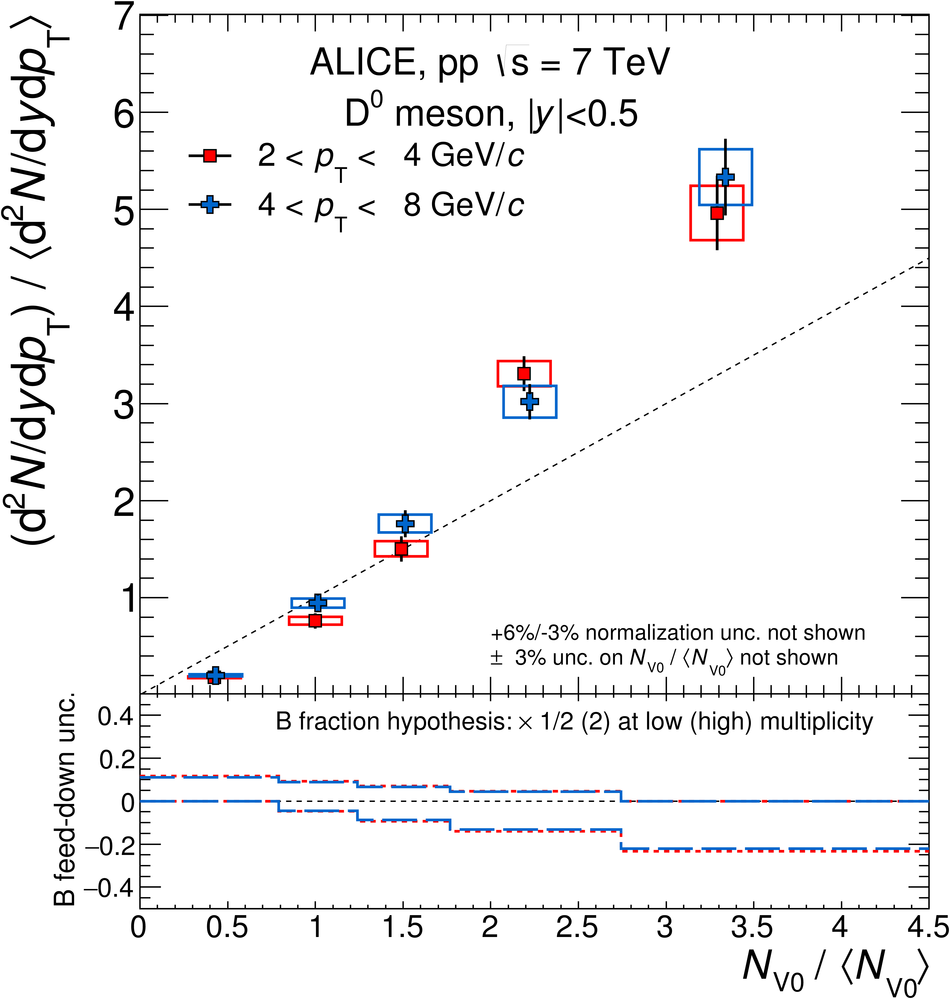 |
Figure 6
${\rm J}/\psi$ invariant mass and pseudo-proper decay length distributions in several multiplicity intervals with superimposed the likelihood fit results. The contributions of the signal, the background and their sum are represented with dashed, dot-dashed and full lines, respectively In addition, the pseudo-proper decay length figures include the prompt and non-prompt contributions to the inclusive yields with dotted and long-dashed lines
|  |
Figure 7
Non-prompt ${\rm J}/\psi$ fraction as a function of the relative charged-particle multiplicity at central rapidity for $\pt >1.3 \mathrm{GeV}/c$ The vertical bars represent the statistical uncertainties, while the empty boxes stand for the systematic uncertainties. The width and the height of these empty boxes indicate the measurement uncertainty on the horizontal and vertical axis respectively The dashed line shows the value of $f_{\rm B}$ measured in the same $\pt$ range and integrated over multiplicity . The shaded area represents the statistical and systematic uncertainties on the multiplicity-integrated result added in quadrature
| 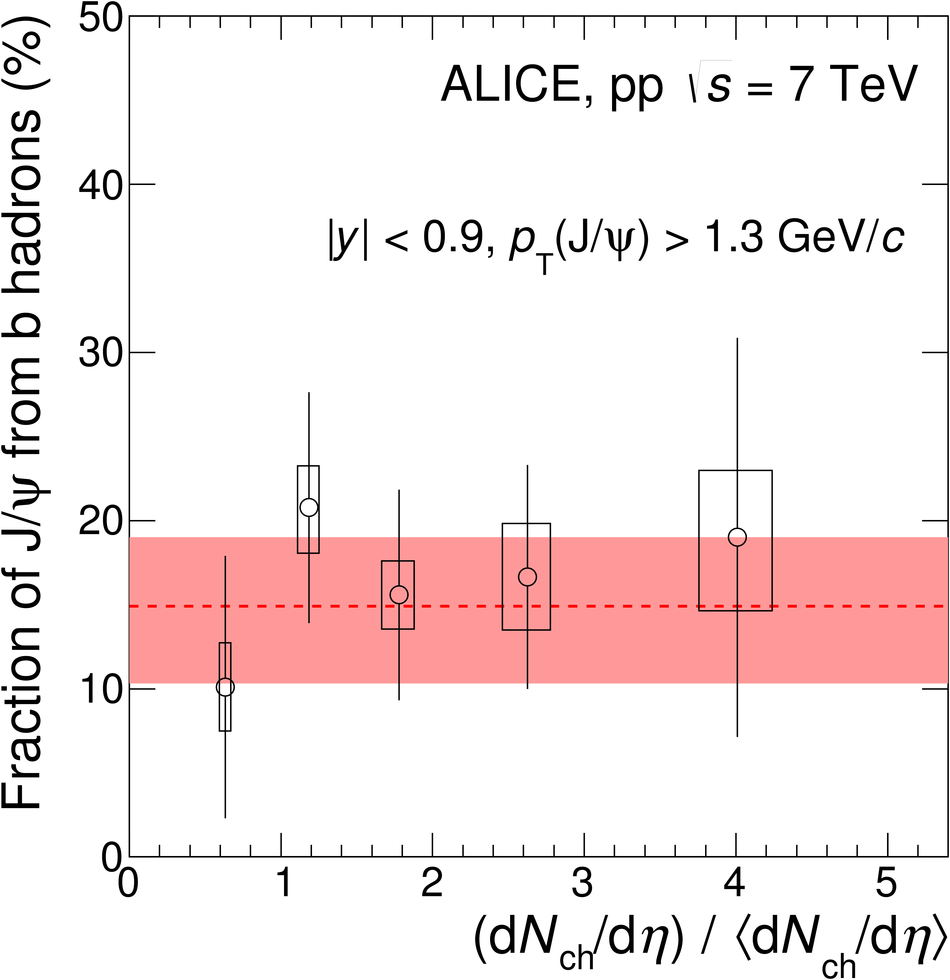 |
Figure 8
Average D meson and ${\rm J}/\psi$ relative yields as a function of the relative charged-particle multiplicity at central rapidity. D-meson yields are shown for $2< \pt< 4 \mathrm{GeV}/c$, while ${\rm J}/\psi$ yields are for $\pt>0$ (a) Inclusive ${\rm J}/\psi$ results for $|y|< 0.9$ are represented by empty black circles , inclusive ${\rm J}/\psi$ results for $2.5< y< 4.0$ by black filled symbols , and prompt D mesons by red filled circles (b) Prompt ${\rm J}/\psi$ results for $|y|< 0.9$ are represented by green filled crosses, and prompt D mesons by red filled circles (c) Non-prompt ${\rm J}/\psi$ results for $|y|< 0.9$ are represented by blue filled squares, and prompt D mesons by red filled circles The relative yields are presented on the top panels with their statistical (vertical bars) and systematic (boxes) uncertainties except the uncertainty on the feed-down fraction for D mesons, which is drawn separately on the bottom panels. The points are located on the x-axis at the average value of $({\rm d}N_{\rm ch}/{\rm d}\eta) \big/ \langle {\rm d}N_{\rm ch}/{\rm d}\eta \rangle$ The diagonal (dashed) line is drawn to guide the eye
| 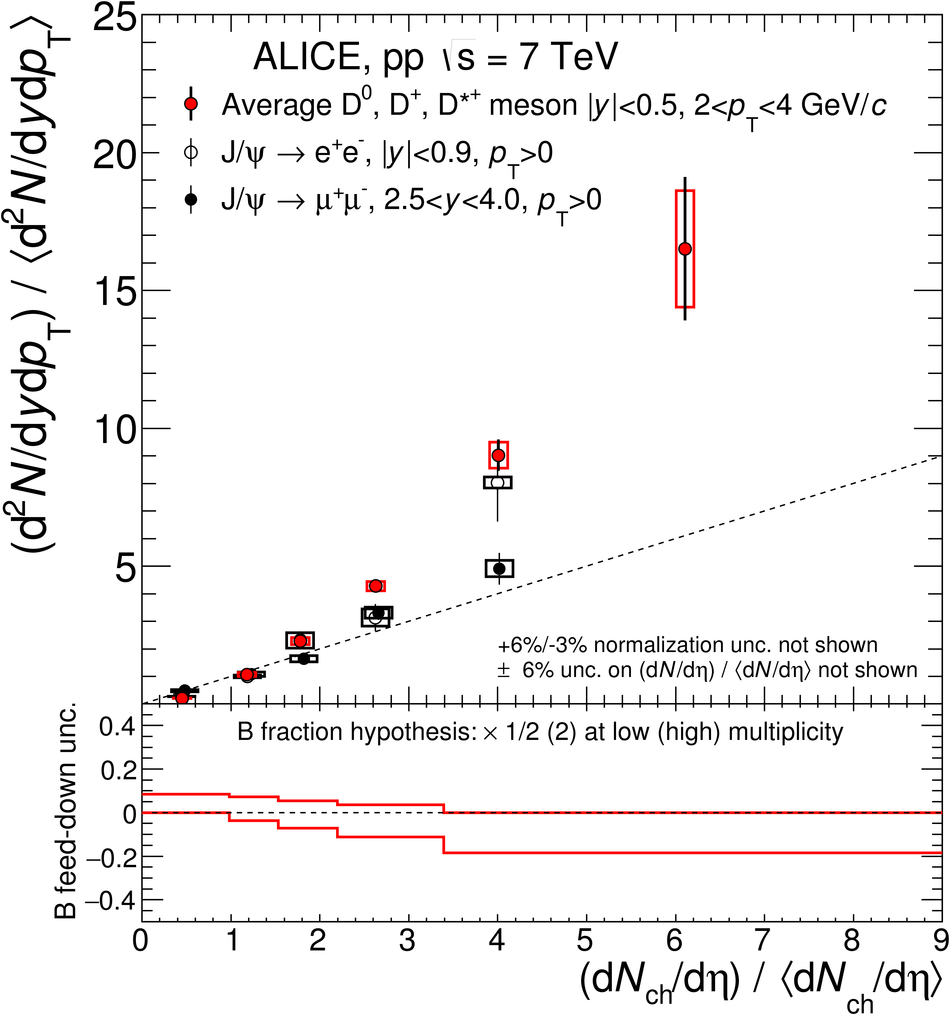 |
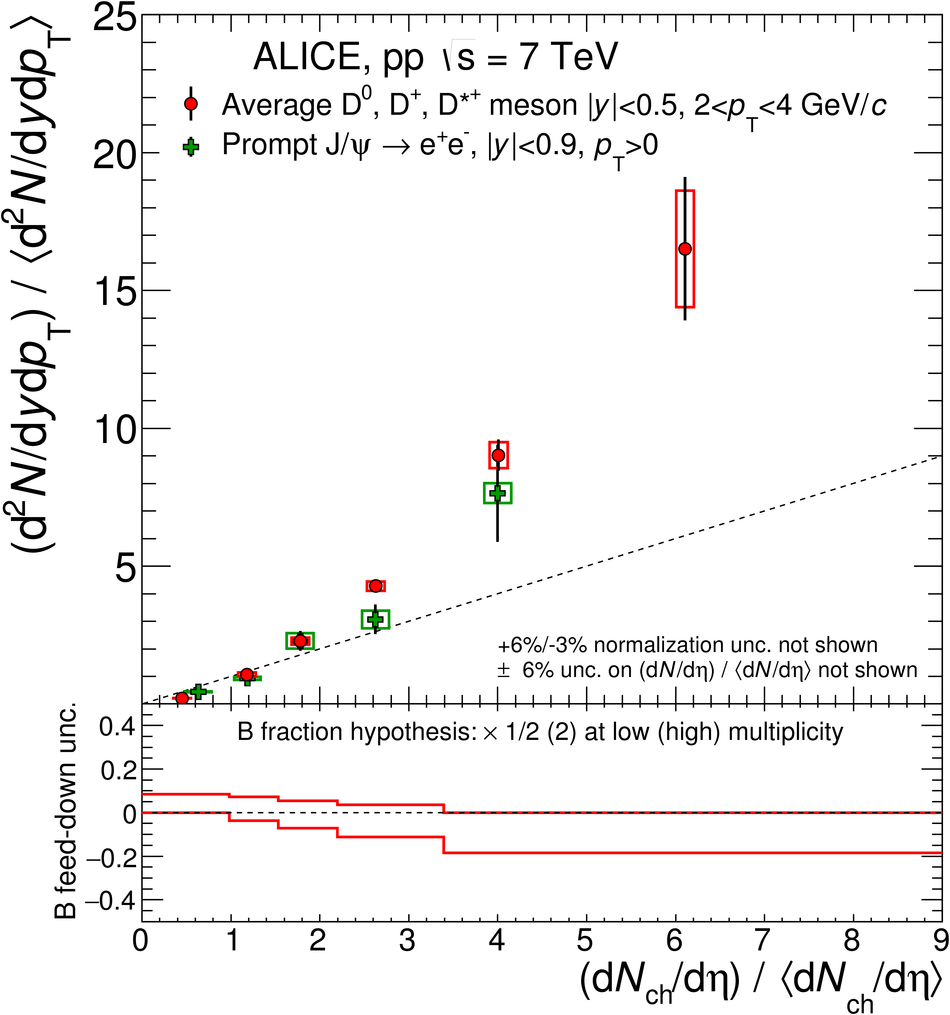
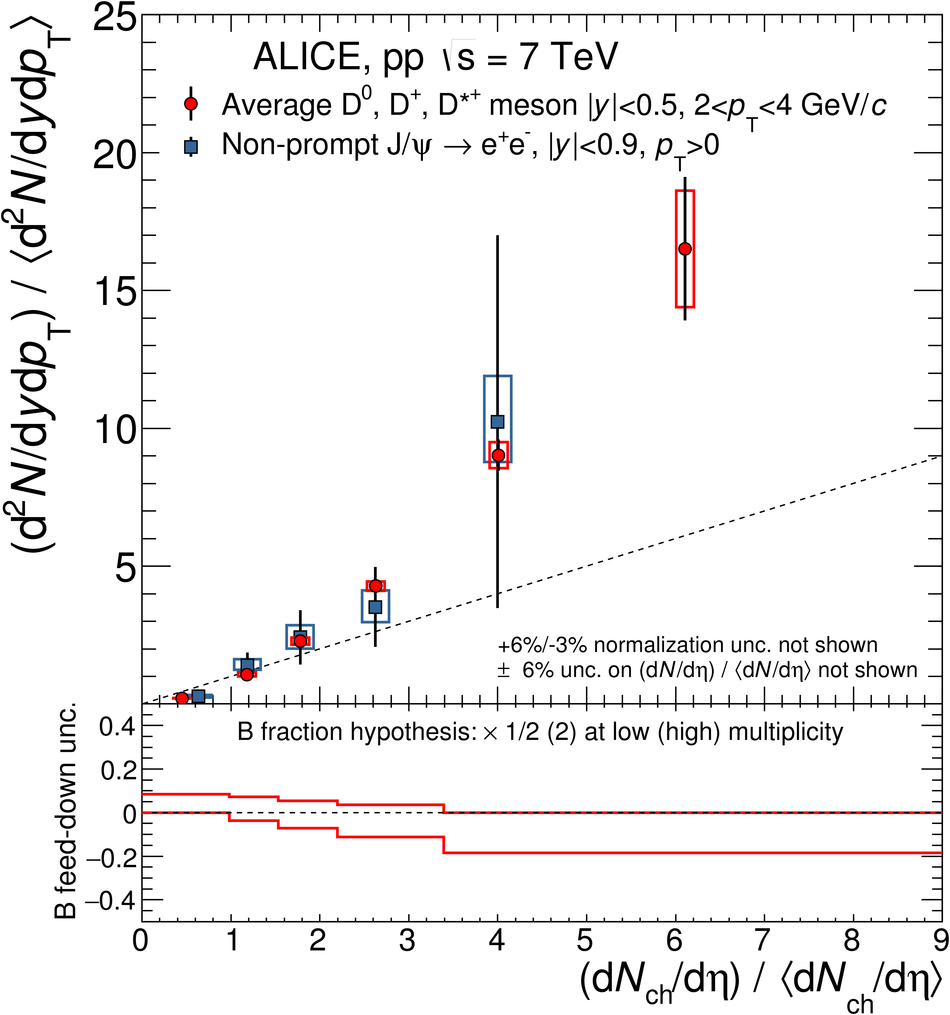
Figure 9
D- and B-meson relative yield as a function of the relative charged-particle multiplicity at central rapidity calculated with the PYTHIA 8.157 event generator The different c and b quark production processes are separated on the top panels: first hard process, hard process in multiple interactions (MPI), gluon splitting from hard processes and initial/final state radiation (ISR/FSR). The bottom panels present the multiplicity dependence in several $\pt$ intervals for prompt D-meson production, on the left for all contributions and on the right for first hard process only The coloured lines represent the calculation distributions, whereas the shaded bands represent their statistical uncertainties at given values of $({\rm d}N_{\rm ch}/{\rm d}\eta) \big/ \langle {\rm d}N_{\rm ch}/{\rm d}\eta \rangle$ The diagonal (dashed) line is drawn to guide the eye
| 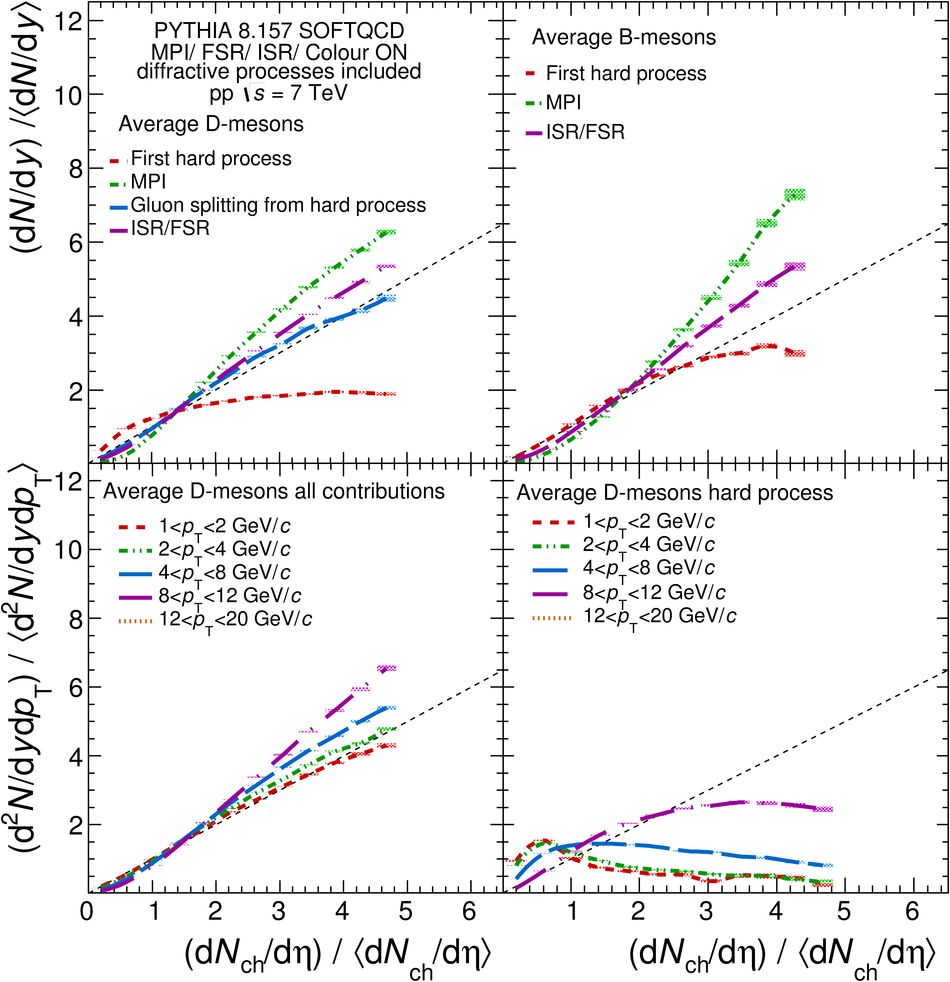 |
Figure 10
Average D-meson relative yield as a function of the relative charged-particle multiplicity at central rapidity in different $\pt$ intervals The systematic uncertainties on the data normalisation (+6% / -3%), on the $({\rm d}N_{\rm ch}/{\rm d}\eta) \big/ \langle {\rm d}N_{\rm ch}/{\rm d}\eta \rangle$ values ($\pm6\%$), and on the feed down contribution are not shown in this figure Different calculations are presented: PYTHIA 8.157 , EPOS 3 with and without hydro and a $\pt$-integrated percolation model The coloured lines represent the calculation curves, whereas the shaded bands represent their statistical uncertainties at given values of $({\rm d}N_{\rm ch}/{\rm d}\eta) \big/ \langle {\rm d}N_{\rm ch}/{\rm d}\eta \rangle$ The diagonal (dashed) line is shown to guide the eye
|  |
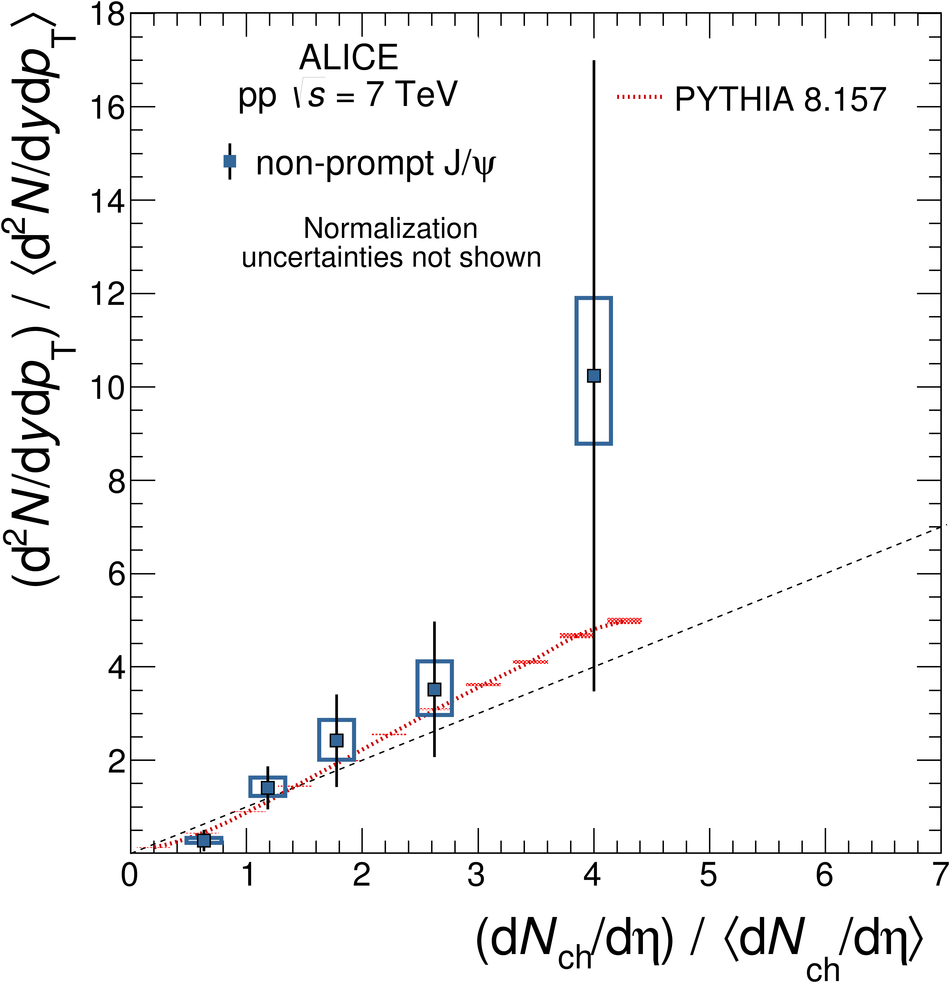
Figure 11
Non-prompt ${\rm J}/\psi$ relative yield as a function of the relative charged-particle multiplicity at central rapidity for $\pt>0$ The systematic uncertainties on the data normalisation (+6% / -3%) and on the $({\rm d}N_{\rm ch}/{\rm d}\eta) \big/ \langle {\rm d}N_{\rm ch}/{\rm d}\eta \rangle$ values ($\pm6%$) are not shown in this figure PYTHIA 8.157 calculation for B mesons is also presented The coloured line represents the calculation curve, whereas the shaded band represents its uncertainty at given values of $({\rm d}N_{\rm ch}/{\rm d}\eta) \big/ \langle {\rm d}N_{\rm ch}/{\rm d}\eta \rangle$ The diagonal (dashed) line is shown to guide the eye
|  |