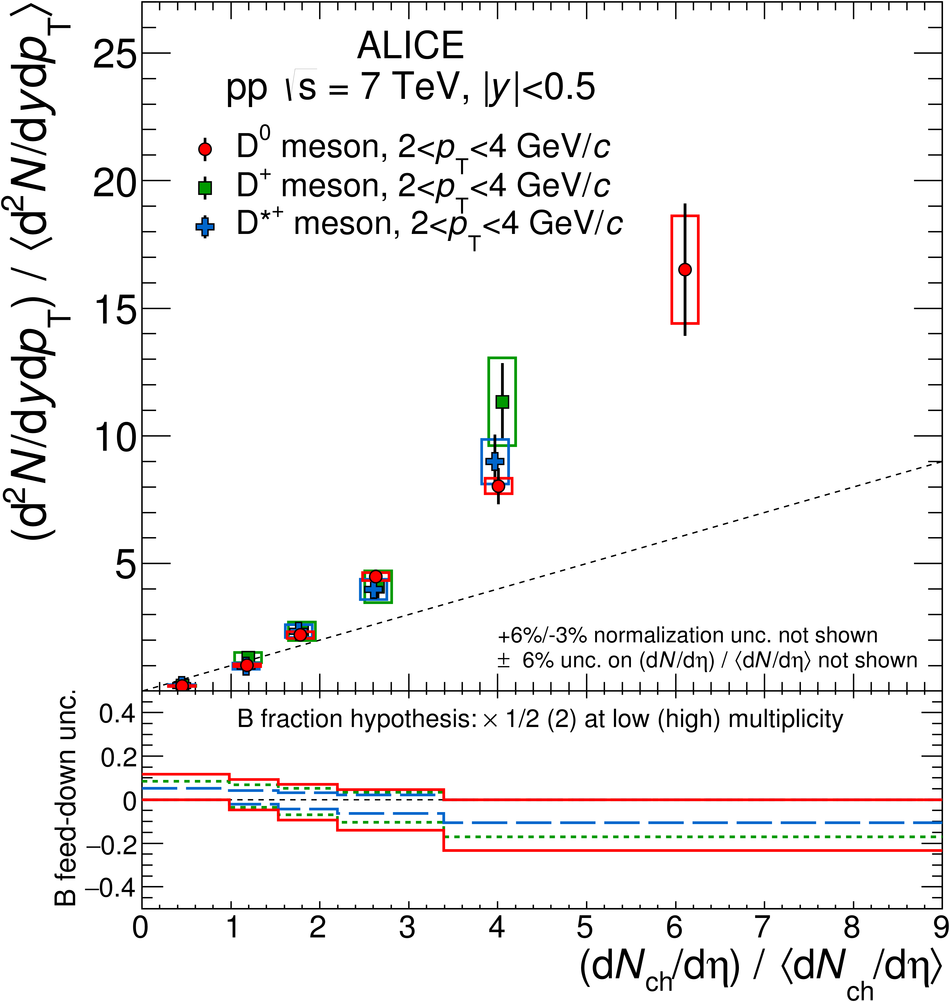
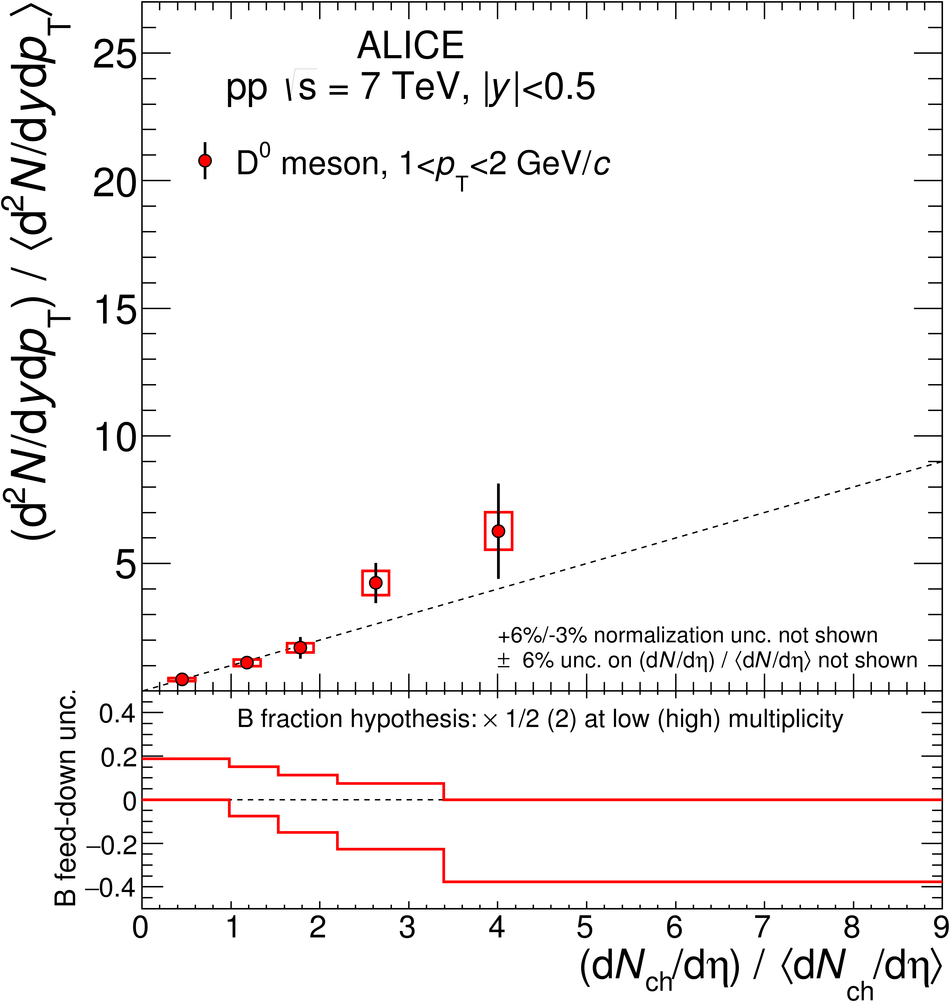
$\Dzero$, $\Dplus$ and $\Dstar$ meson relative yields for each $\pt$ interval as a function of charged-particle multiplicity at central rapidity The relative yields are presented on the top panels with their statistical (vertical bars) and systematic (boxes) uncertainties, except for the feed-down fraction uncertainty that is drawn separately in the bottom panels $\Dzero$ mesons are represented by red circles, $\Dplus$ by green squares, and $\Dstar$ by blue triangles The position of the points on the abscissa is the average value of $({\rm d}N_{\rm ch}/{\rm d}\eta) \big/ \langle {\rm d}N_{\rm ch}/{\rm d}\eta \rangle$. For $\Dplus$ and $\Dstar$ mesons the points are shifted horizontally by 1.5% to improve the visibility The diagonal (dashed) line is also shown to guide the eye
|  |