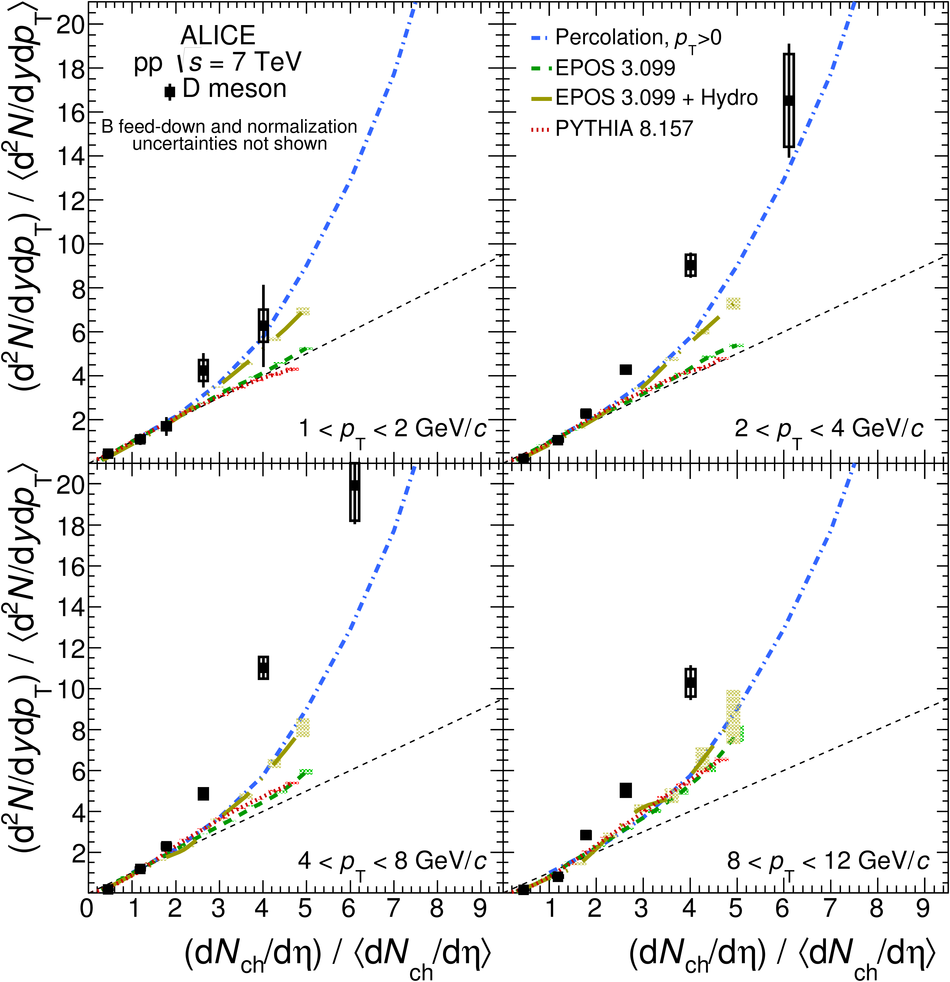
Average D-meson relative yield as a function of the relative charged-particle multiplicity at central rapidity in different $\pt$ intervals The systematic uncertainties on the data normalisation (+6% / -3%), on the $({\rm d}N_{\rm ch}/{\rm d}\eta) \big/ \langle {\rm d}N_{\rm ch}/{\rm d}\eta \rangle$ values ($\pm6\%$), and on the feed down contribution are not shown in this figure Different calculations are presented: PYTHIA 8.157 , EPOS 3 with and without hydro and a $\pt$-integrated percolation model The coloured lines represent the calculation curves, whereas the shaded bands represent their statistical uncertainties at given values of $({\rm d}N_{\rm ch}/{\rm d}\eta) \big/ \langle {\rm d}N_{\rm ch}/{\rm d}\eta \rangle$ The diagonal (dashed) line is shown to guide the eye
|  |