The production of the W$^\pm$ bosons measured in p$-$Pb collisions at a centre-of-mass energy per nucleon$-$nucleon collision $\sqrt{s_{NN}} = 8.16$ TeV and Pb$-$Pb collisions at $\sqrt{s_{NN}} = 5.02$ TeV with ALICE at the LHC is presented. The W$^\pm$ bosons are measured via their muonic decay channel, with the muon reconstructed in the pseudorapidity region $-4 <~ \eta^\mu_{\rm lab} <~ -2.5$ with transverse momentum $p_{\rm T}^\mu > 10$ GeV/$c$. While in Pb$-$Pb collisions the measurements are performed in the forward ($2.5 <~ y^\mu_{\rm cms} <~ 4$) rapidity region, in p$-$Pb collisions, where the centre-of-mass frame is boosted with respect to the laboratory frame, the measurements are performed in the backward ($-4.46 <~ y^\mu_{\rm cms} <~ -2.96$) and forward ($2.03 <~ y^\mu_{\rm cms} <~ 3.53$) rapidity regions. The W$^{-}$ and W$^{+}$ production cross sections, lepton-charge asymmetry, and nuclear modification factors are evaluated as a function of the muon rapidity. In order to study the production as a function of the p$-$Pb collision centrality, the production cross sections of the W$^{-}$ and W$^{+}$ bosons are combined and normalised to the average number of binary nucleon$-$nucleon collision $\langle N_\mathrm{coll} \rangle$. In Pb$-$Pb collisions, the same measurements are presented as a function of the collision centrality. Study of the binary scaling of the W$^\pm$-boson cross sections in p$-$Pb and Pb$-$Pb collisions is also reported. The results are compared with perturbative QCD (pQCD) calculations, with and without nuclear modifications of the Parton Distribution Functions (PDFs), as well as with available data at the LHC. Significant deviations from the theory expectations are found in the two collision systems, indicating that the measurements can provide additional constraints for the determination of nuclear PDF (nPDFs) and in particular of the light-quark distributions.
JHEP 05 (2022) 036
HEP Data
e-Print: arXiv:2204.10640 | PDF | inSPIRE
CERN-EP-2022-076
Figure group
Figure 1
Inclusive transverse momentum distribution of negative (top) and positive (bottom) muons at backward (left) and forward (right) rapidity in p-Pb collisions at $\sqrt{s_{\rm NN}}=8.16$ TeV. The results of the fit to the inclusive spectrum using a combination of MC templates is shown as a continuous line, the green, pink and blue dashed lines representing the contributions of the W$^\pm$-, Z$^0$/$\gamma^*$- and heavy-flavour hadron decay muons, respectively. The bottom panels show the ratio of the data to the fit result. | 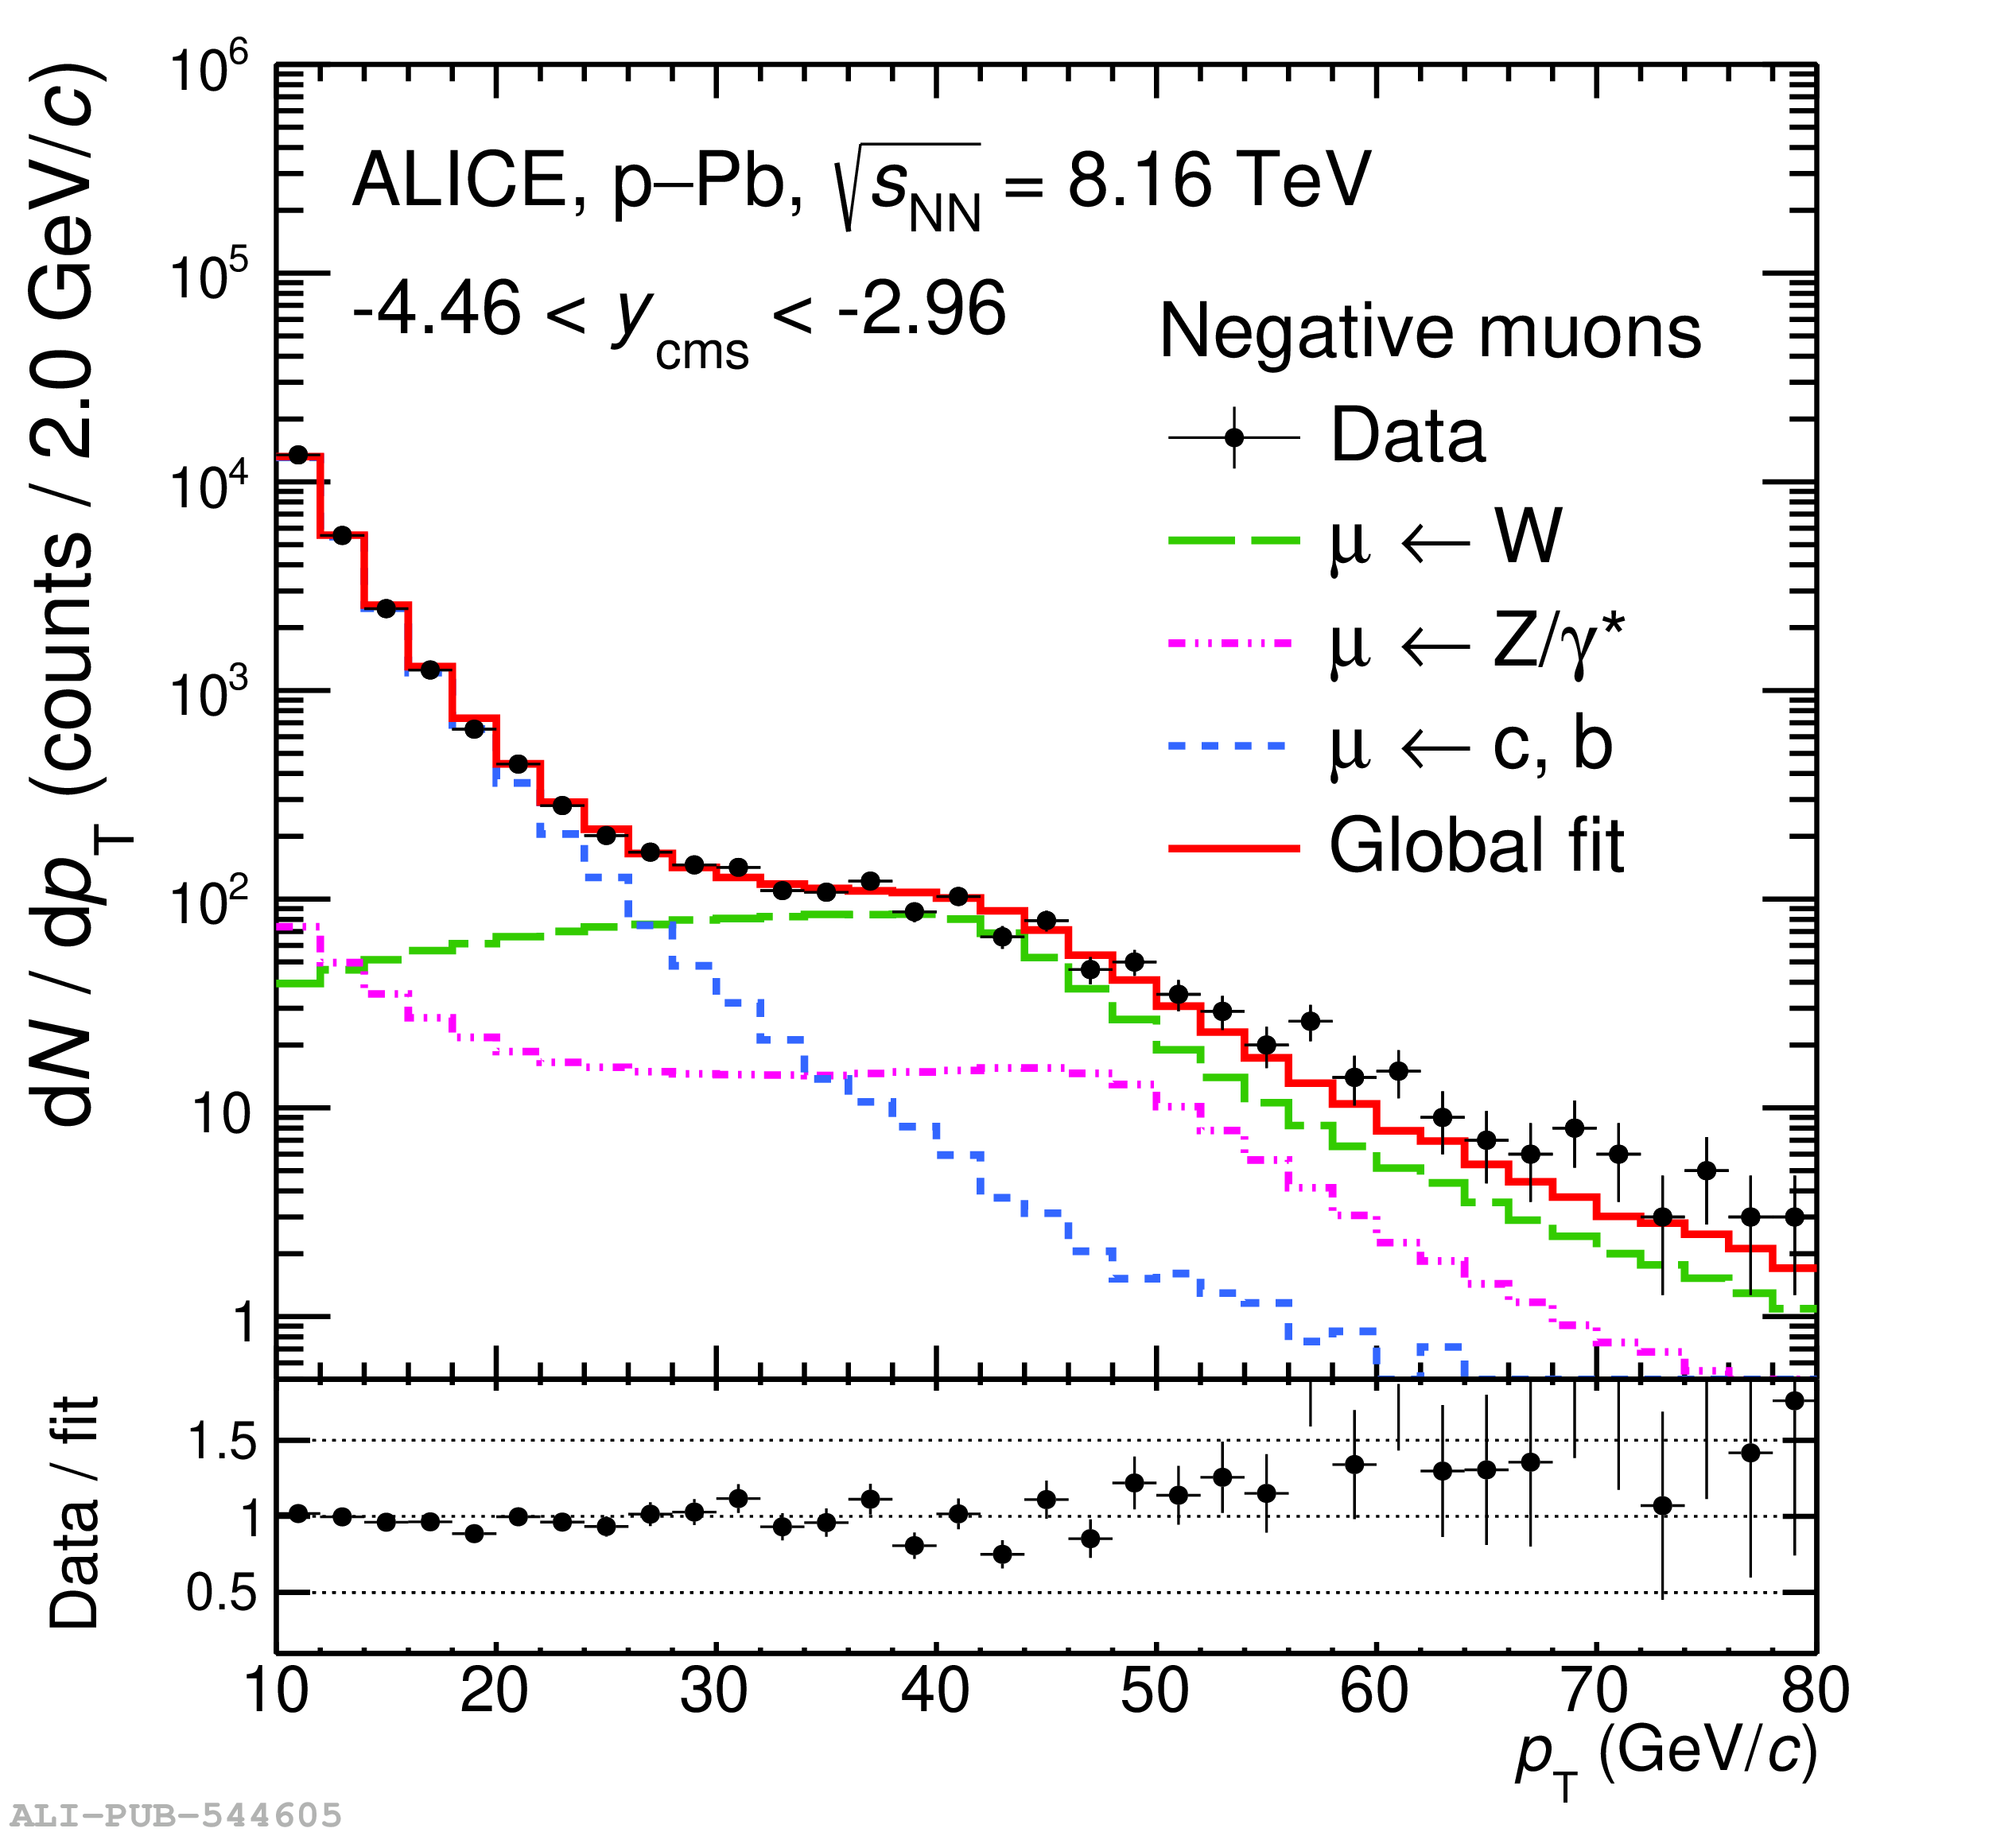 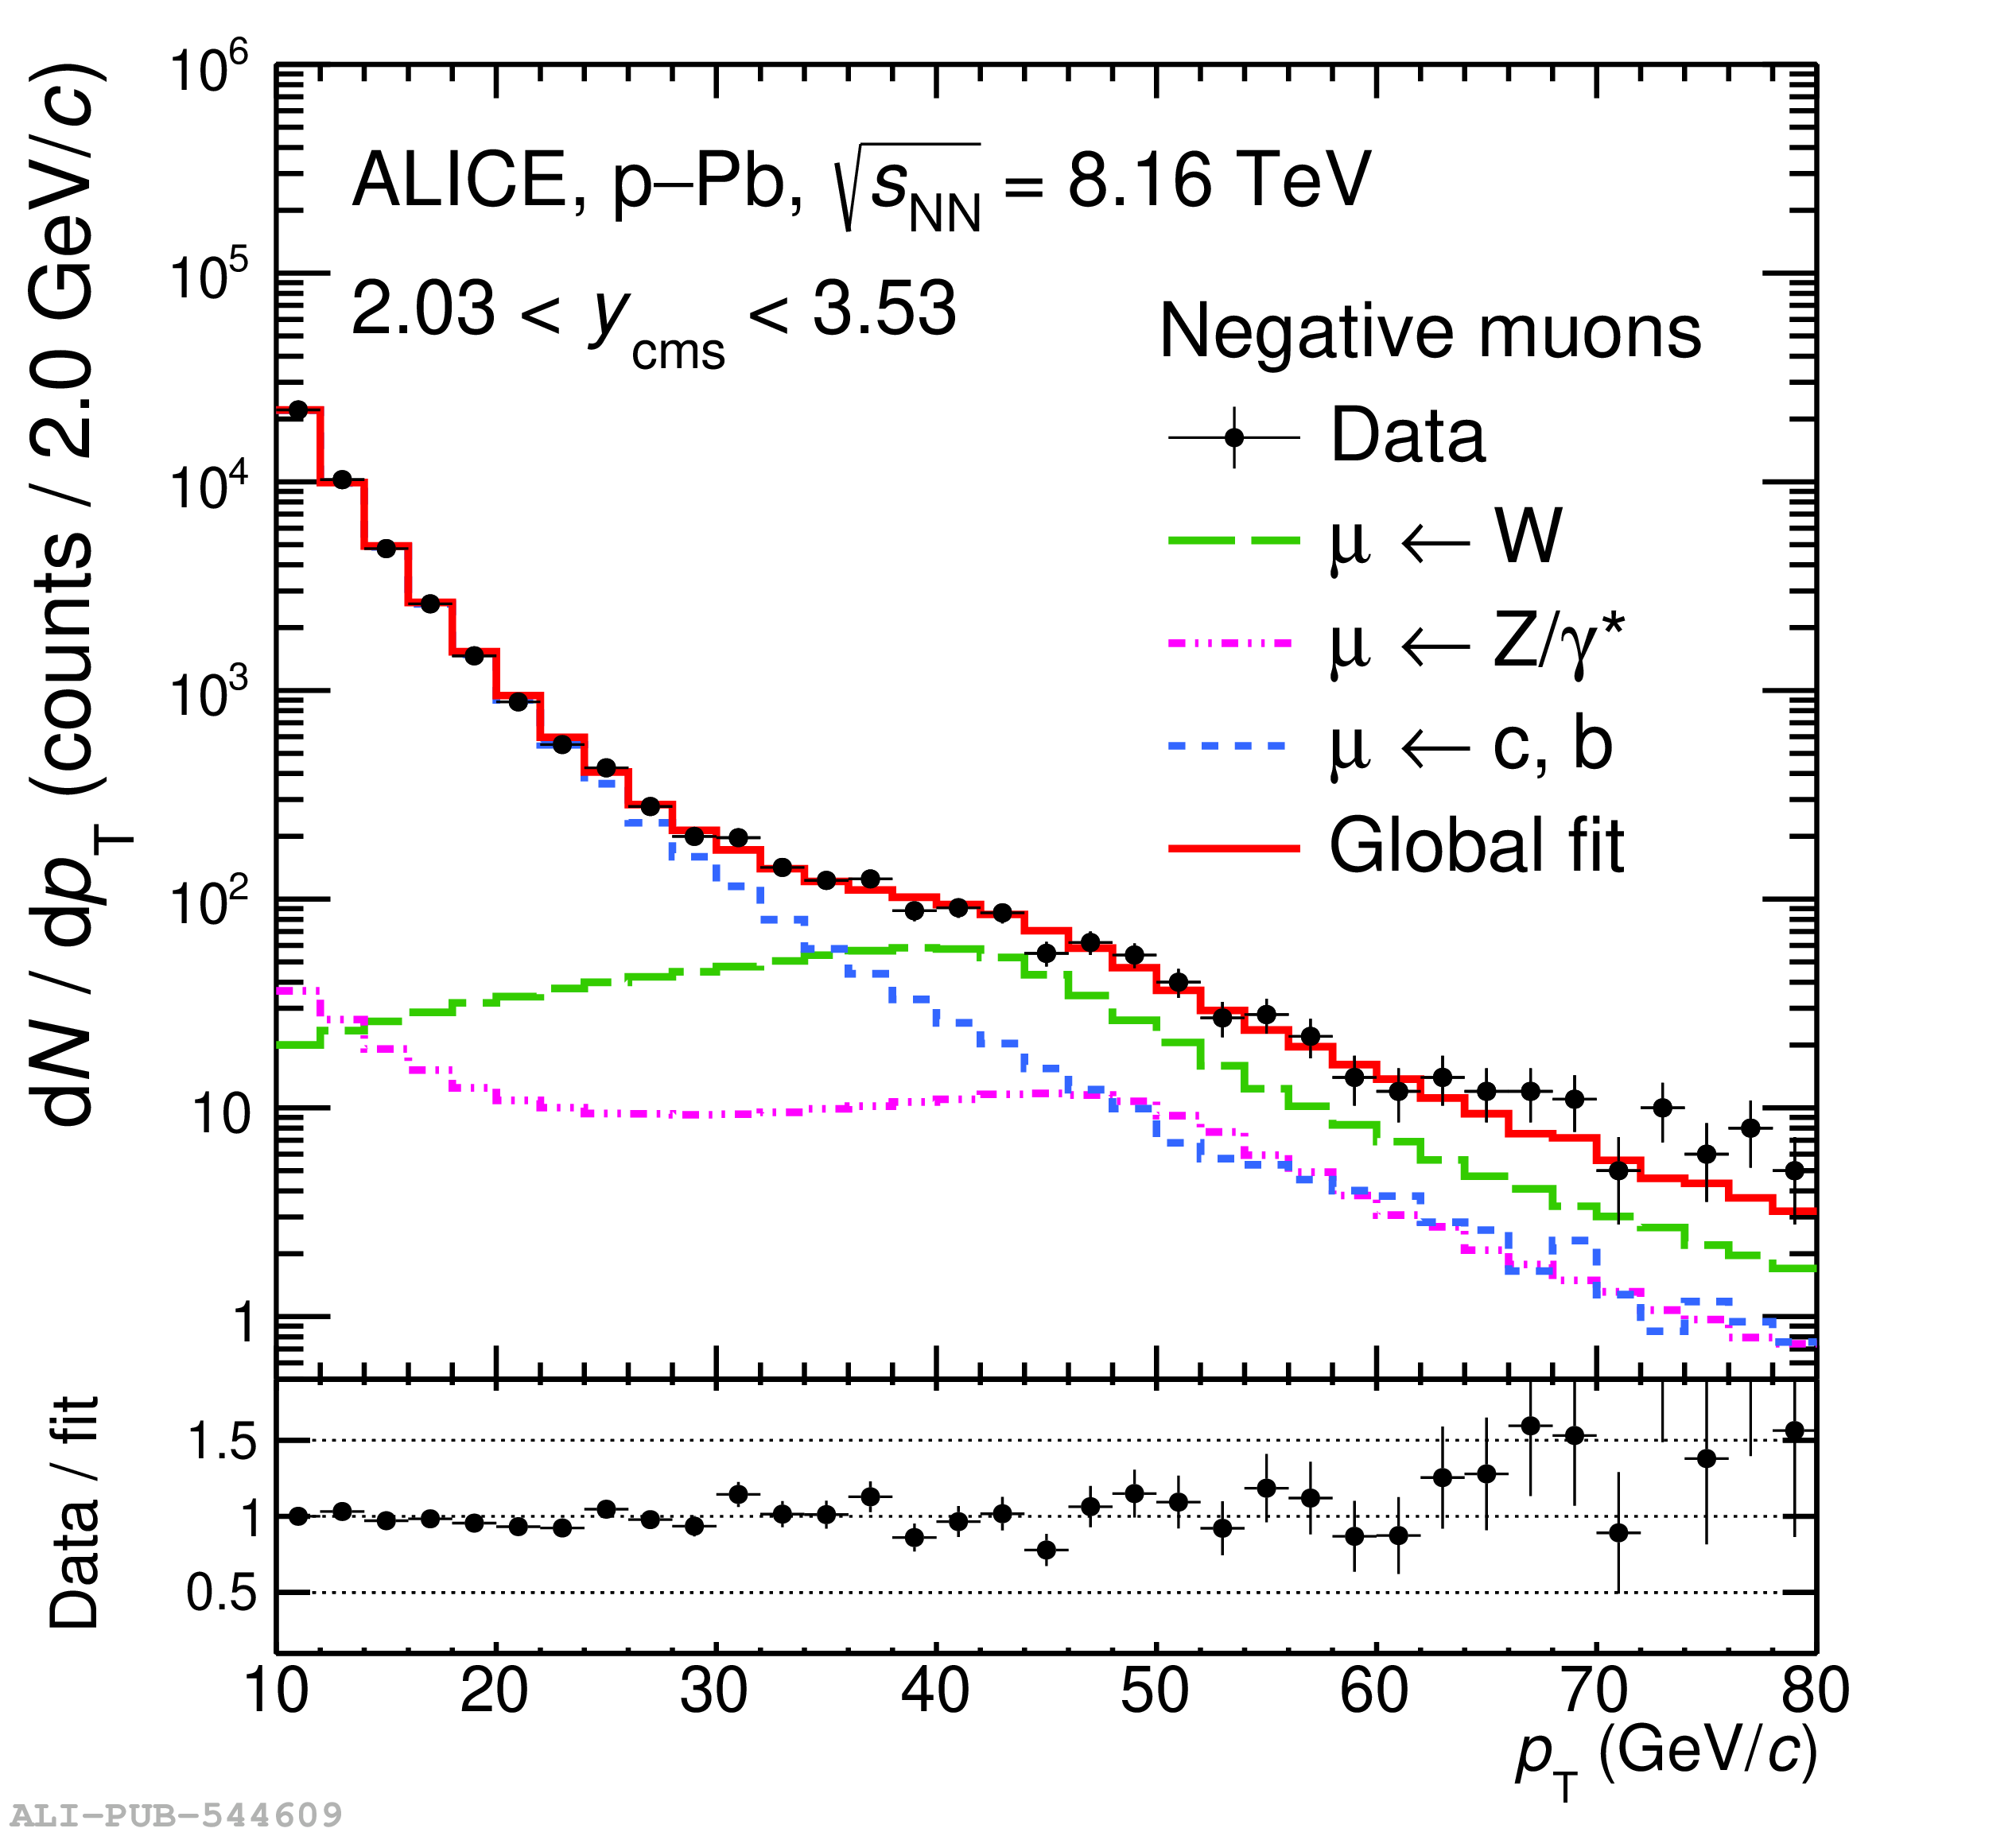 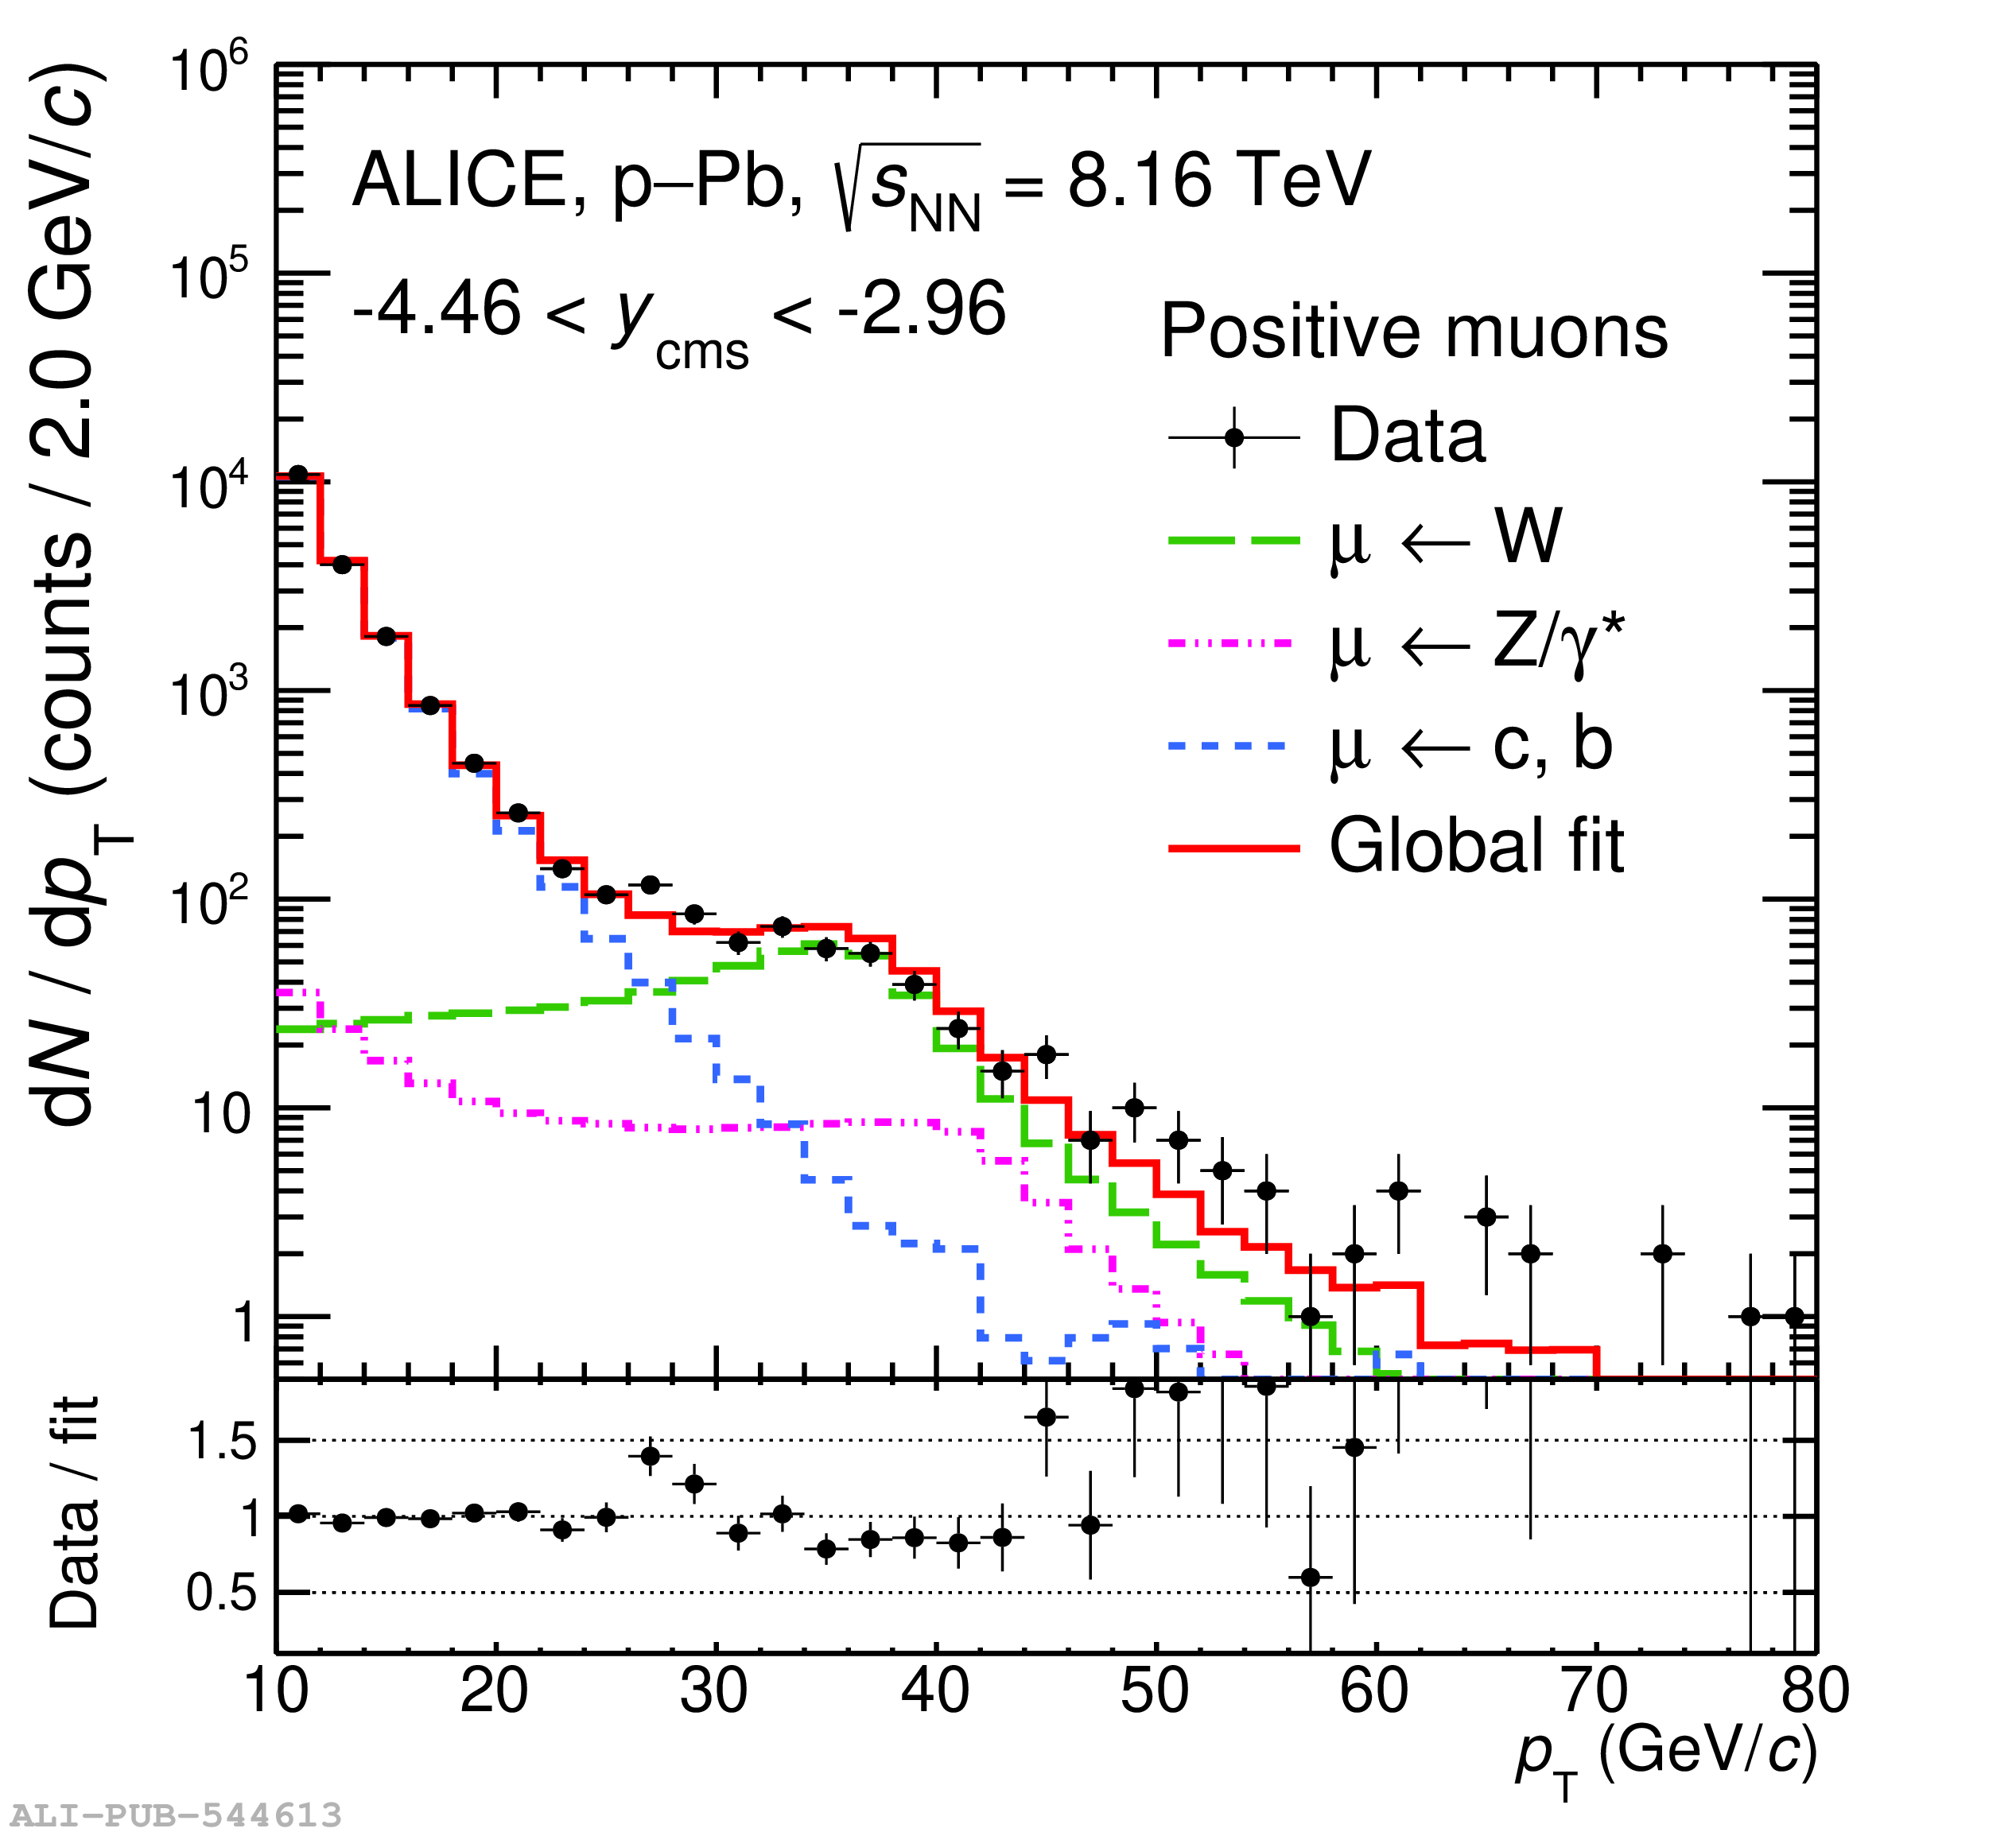 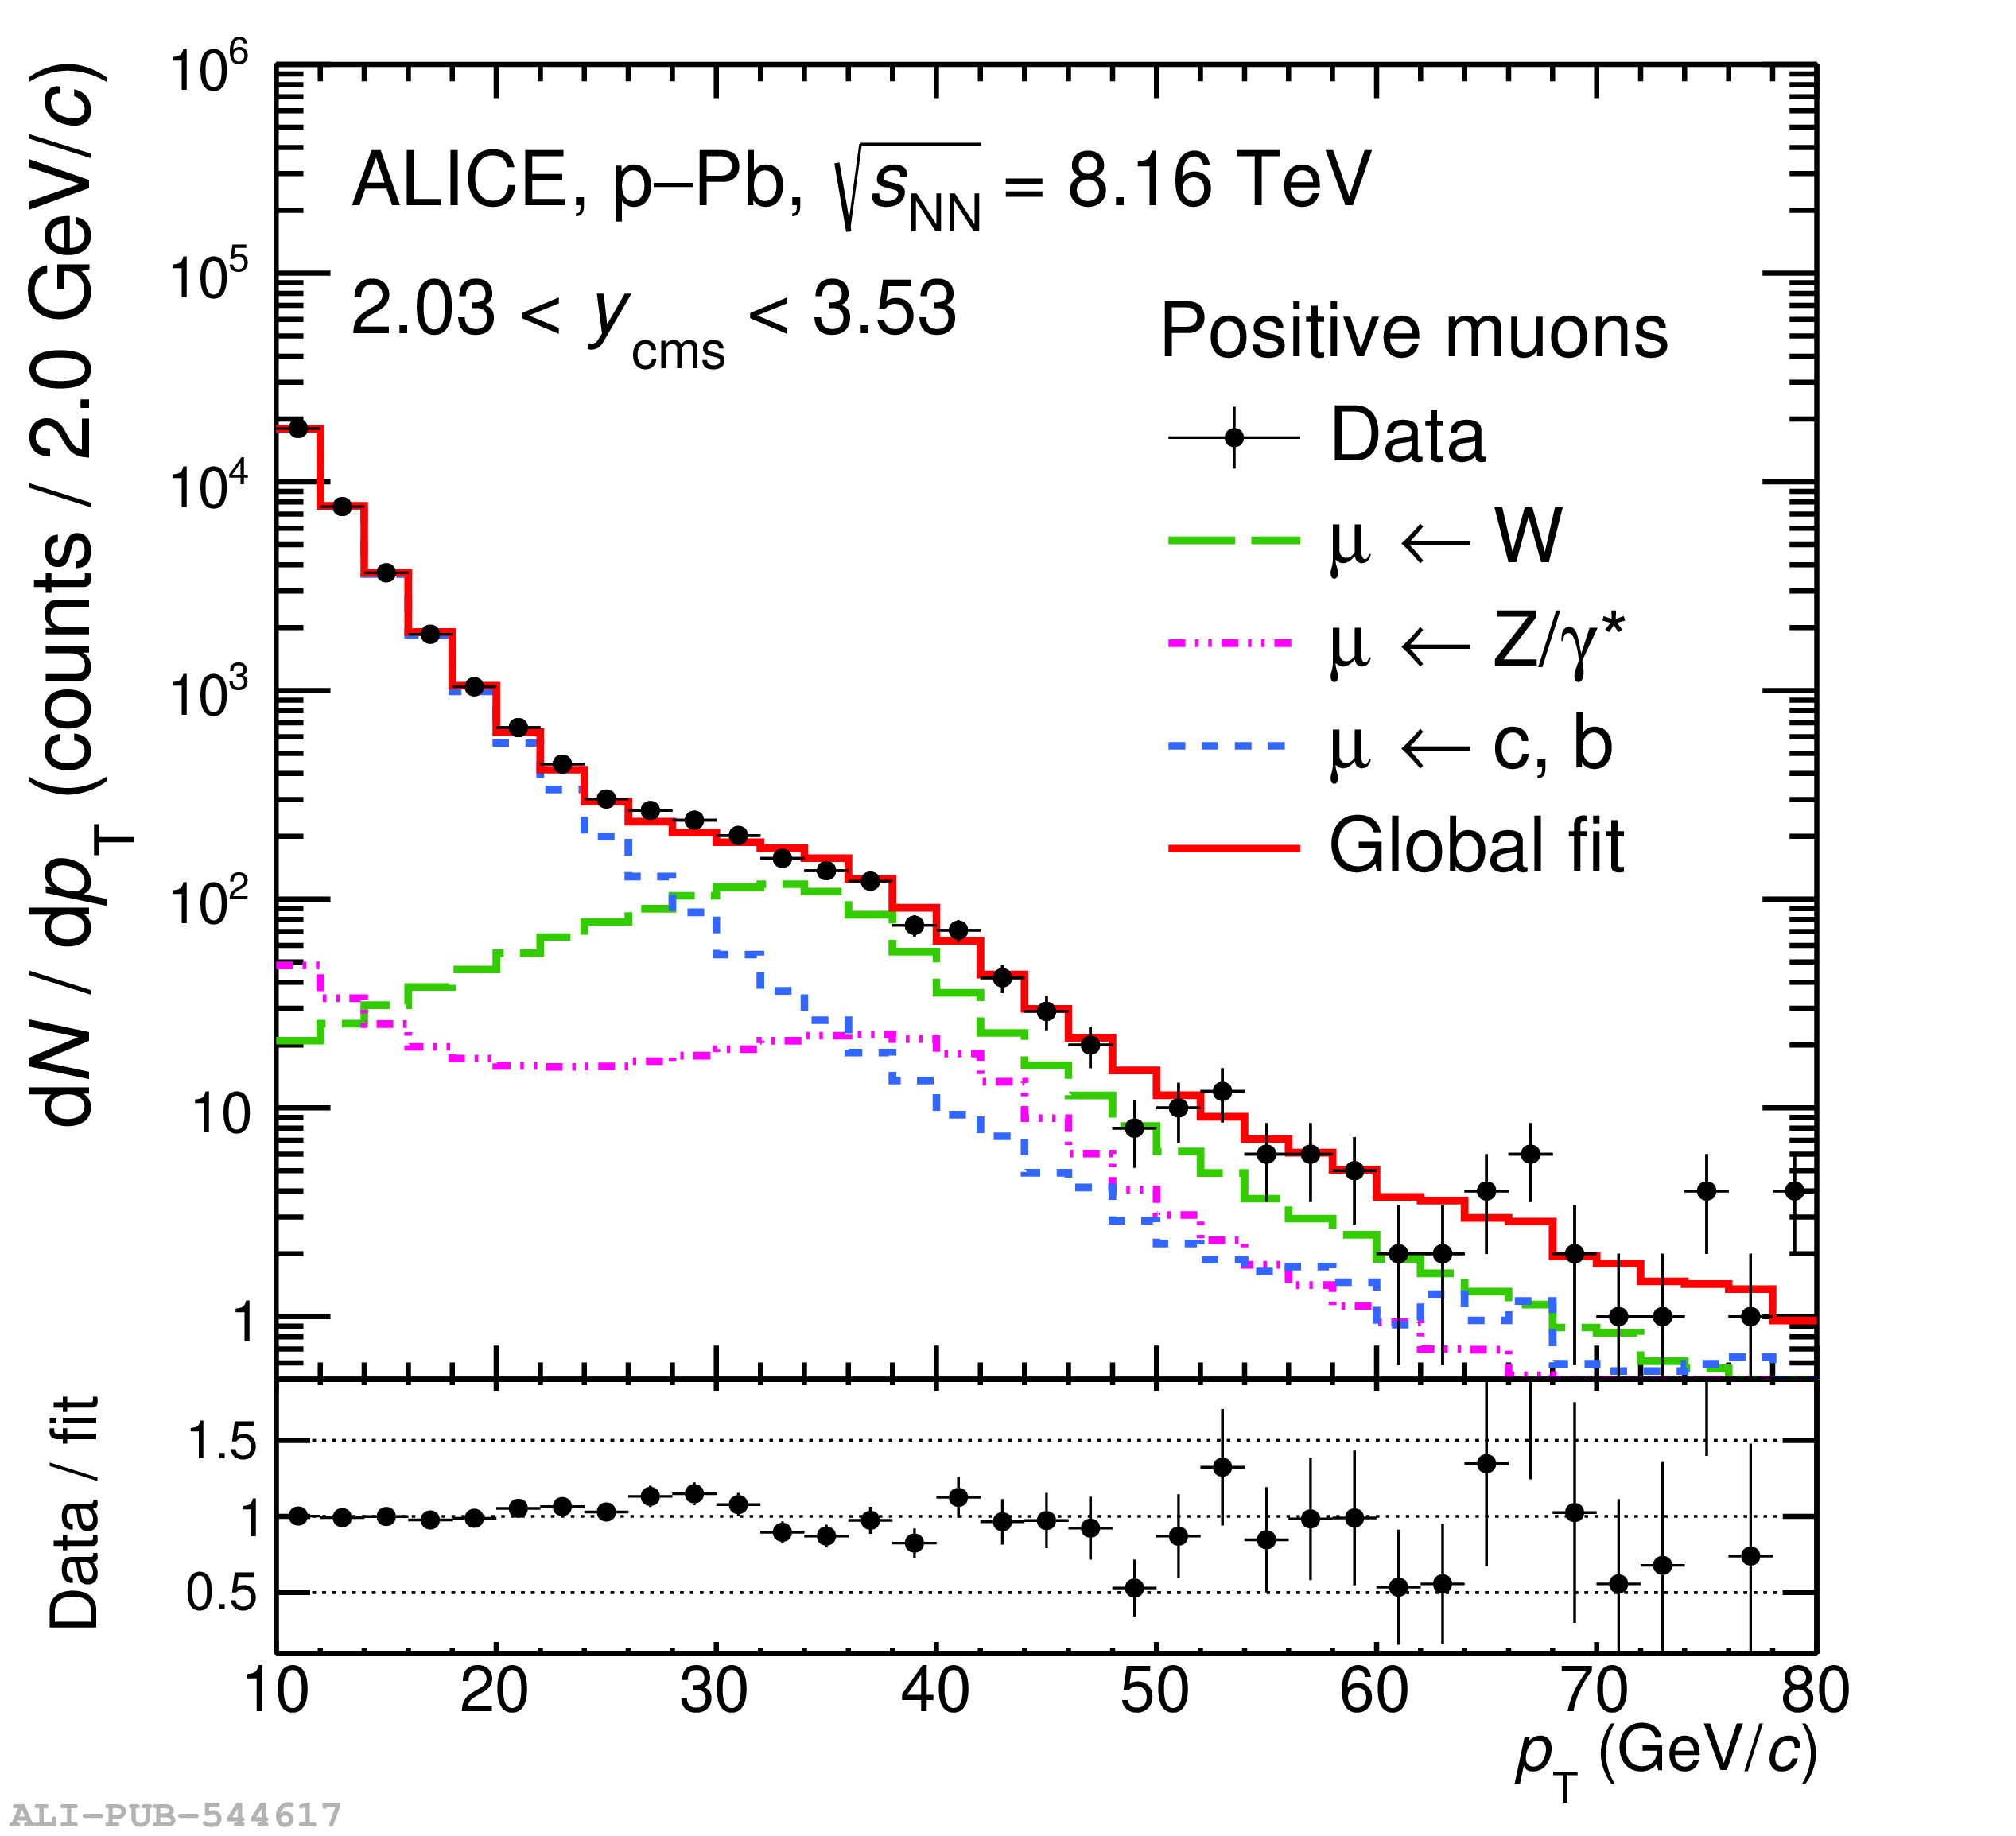 |
Figure 2
Inclusive transverse momentum distribution of negative (top) and positive (bottom) muons for the 0--90\% (left) and 0--10\% (right) centrality intervals in Pb-Pb collisions at $\sqrt{s_{\rm NN}}=5.02$ TeV. The results of the fit to the inclusive spectrum using a combination of MC templates is shown as a continuous line, the green, pink and blue dashed lines representing the contributions of the W$^\pm$-, Z$^0$/$\gamma^*$- and heavy-flavour hadron decay muons, respectively. The bottom panels show the ratio of the data to the fit result. | 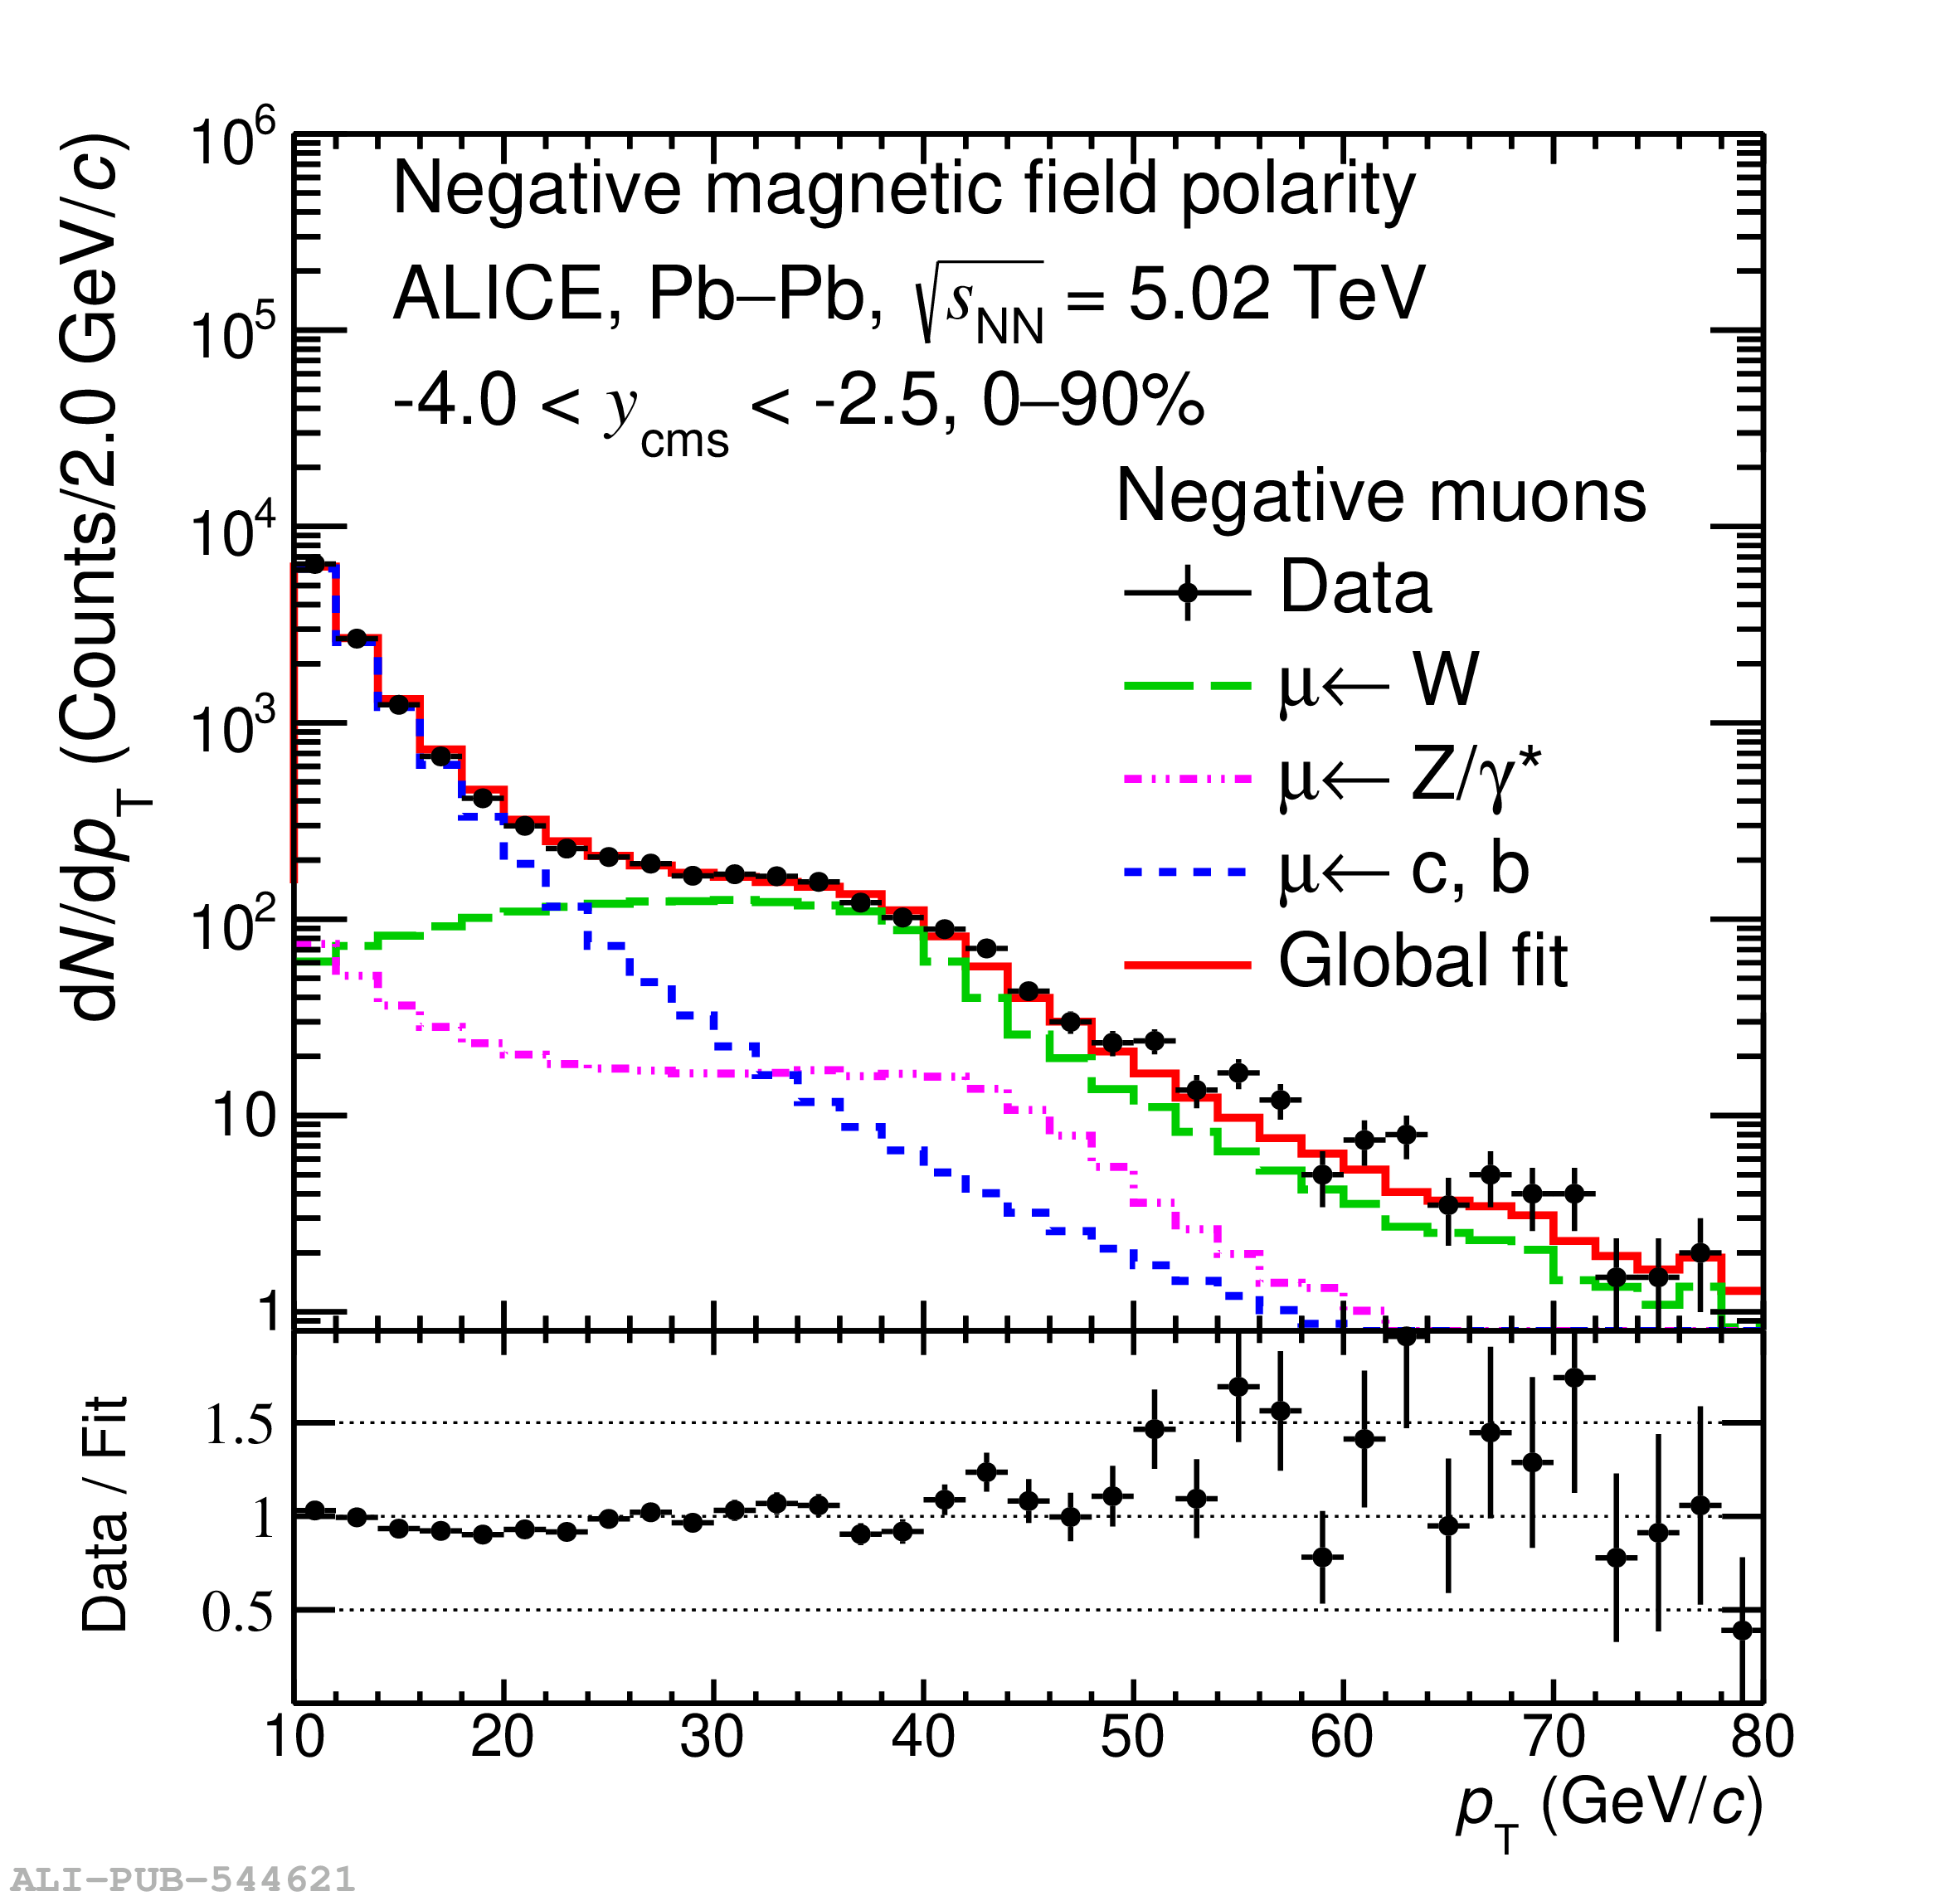 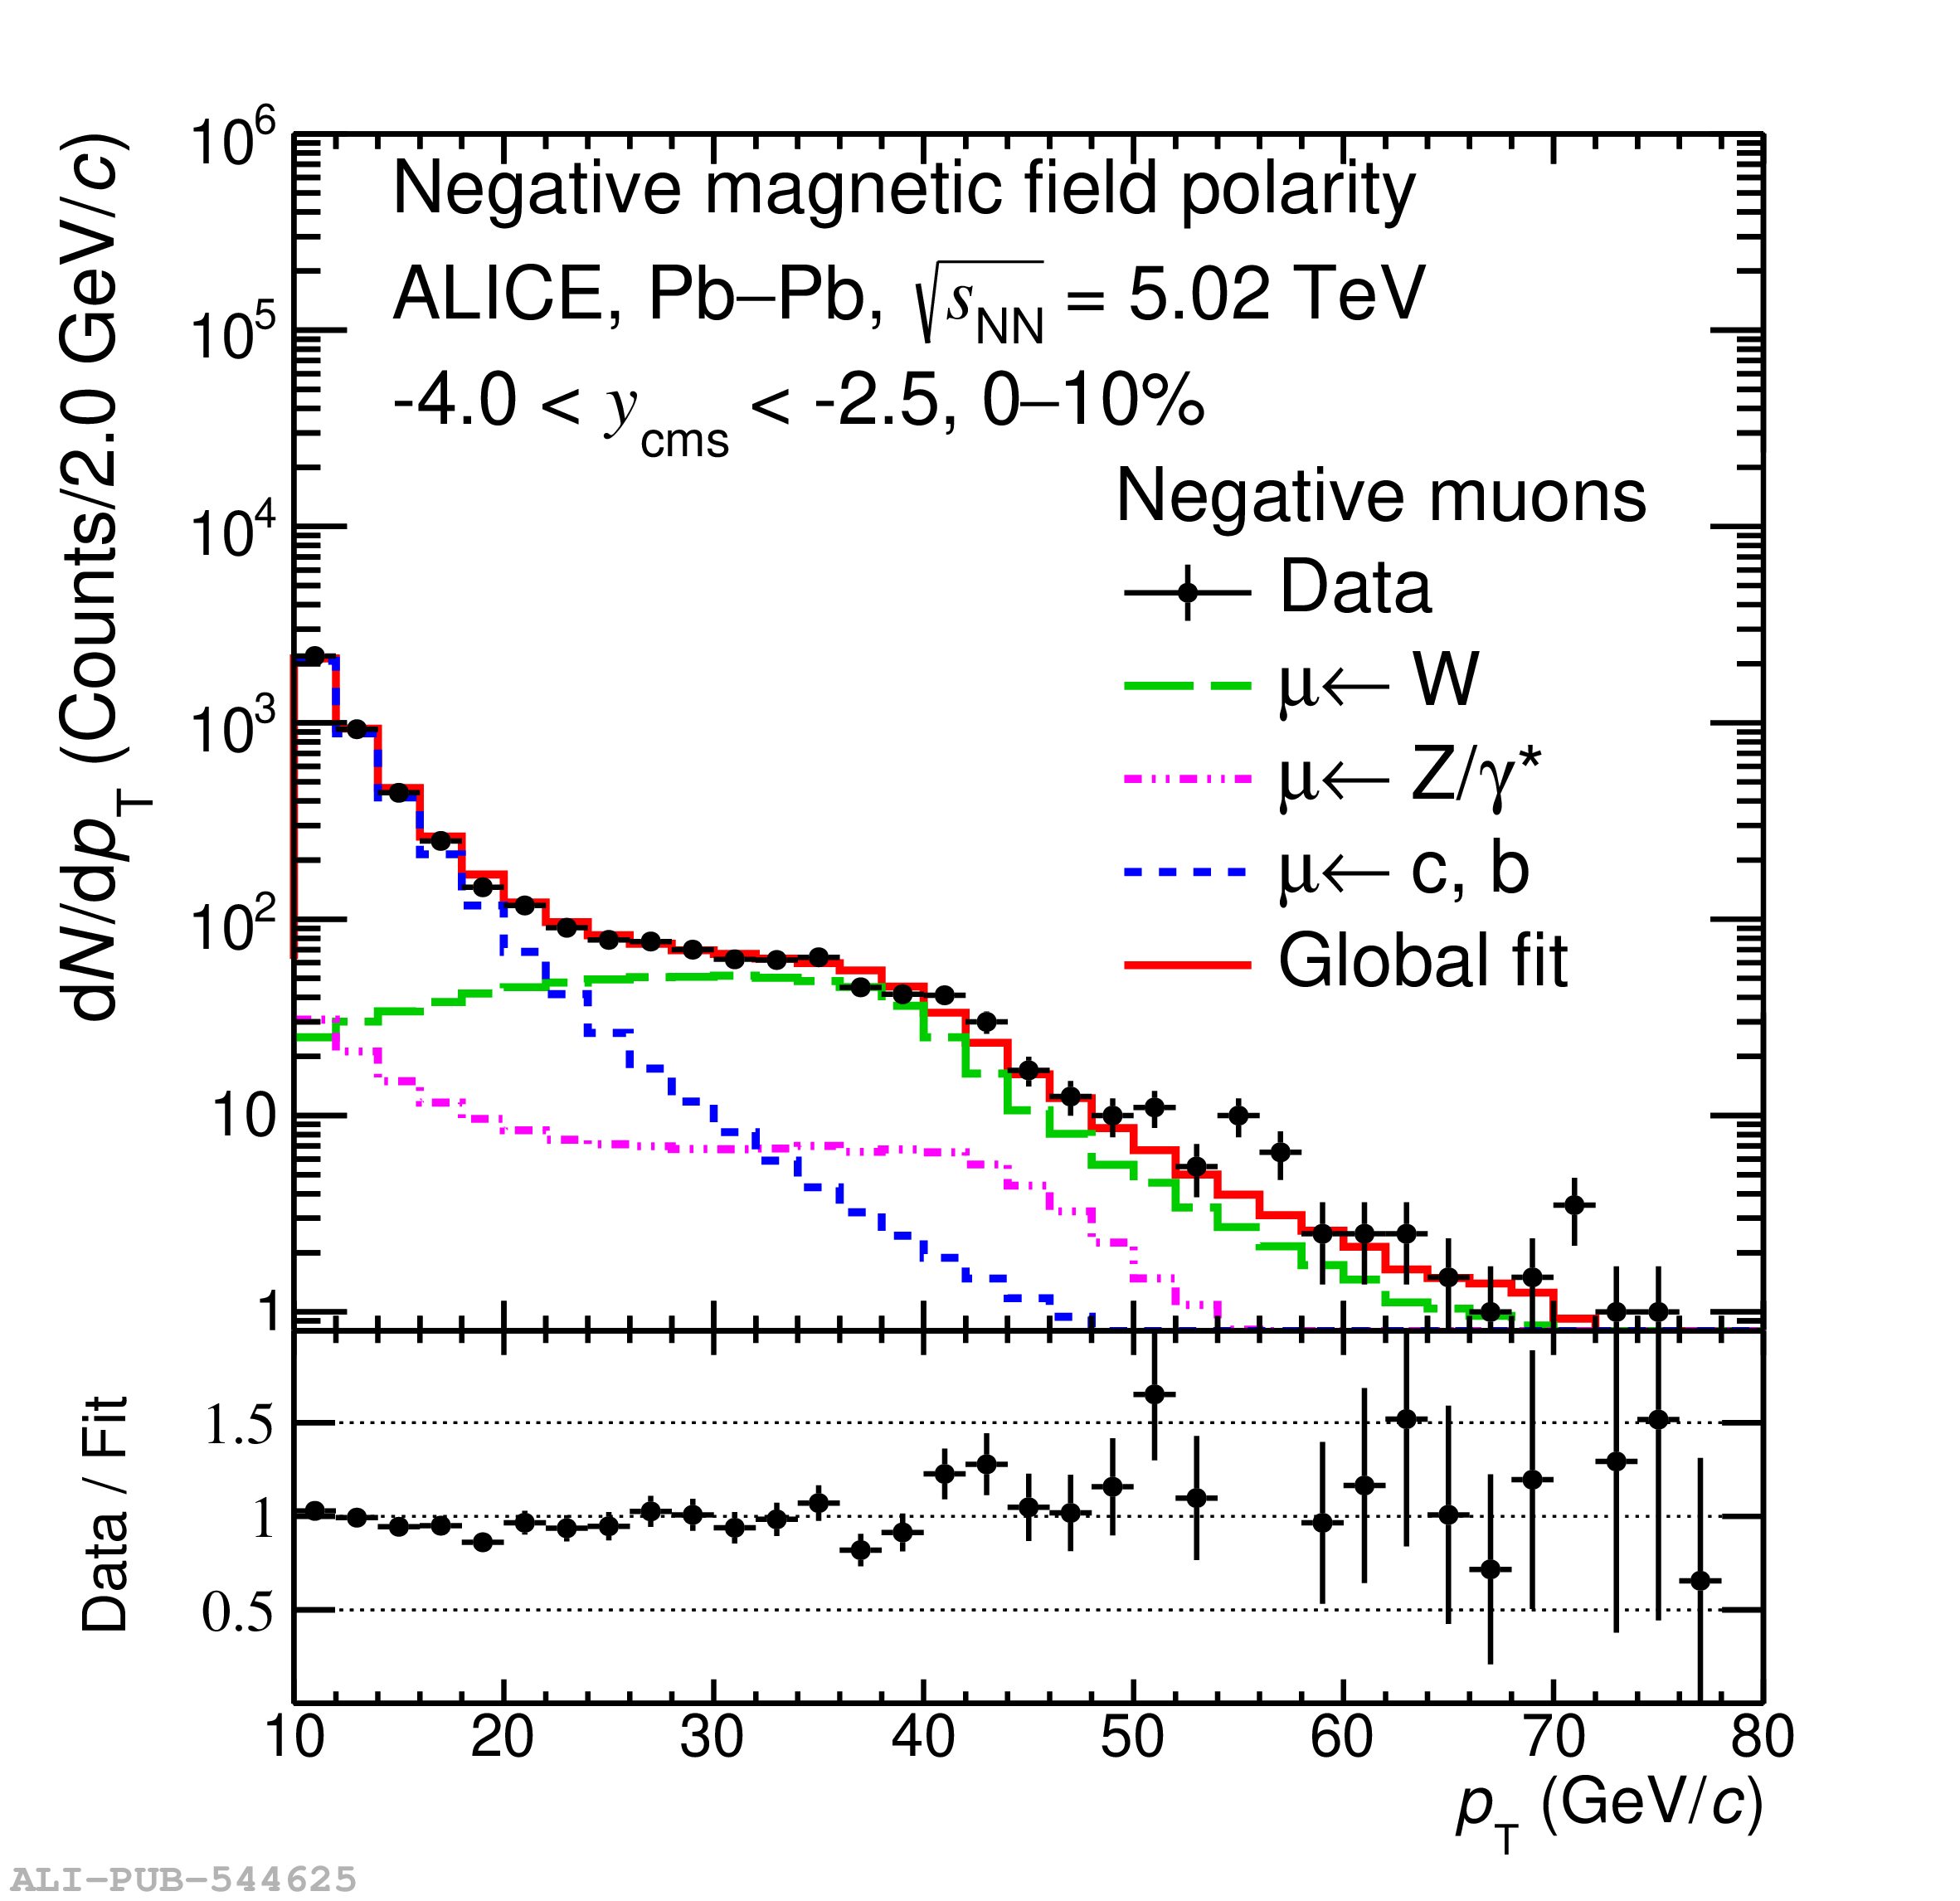 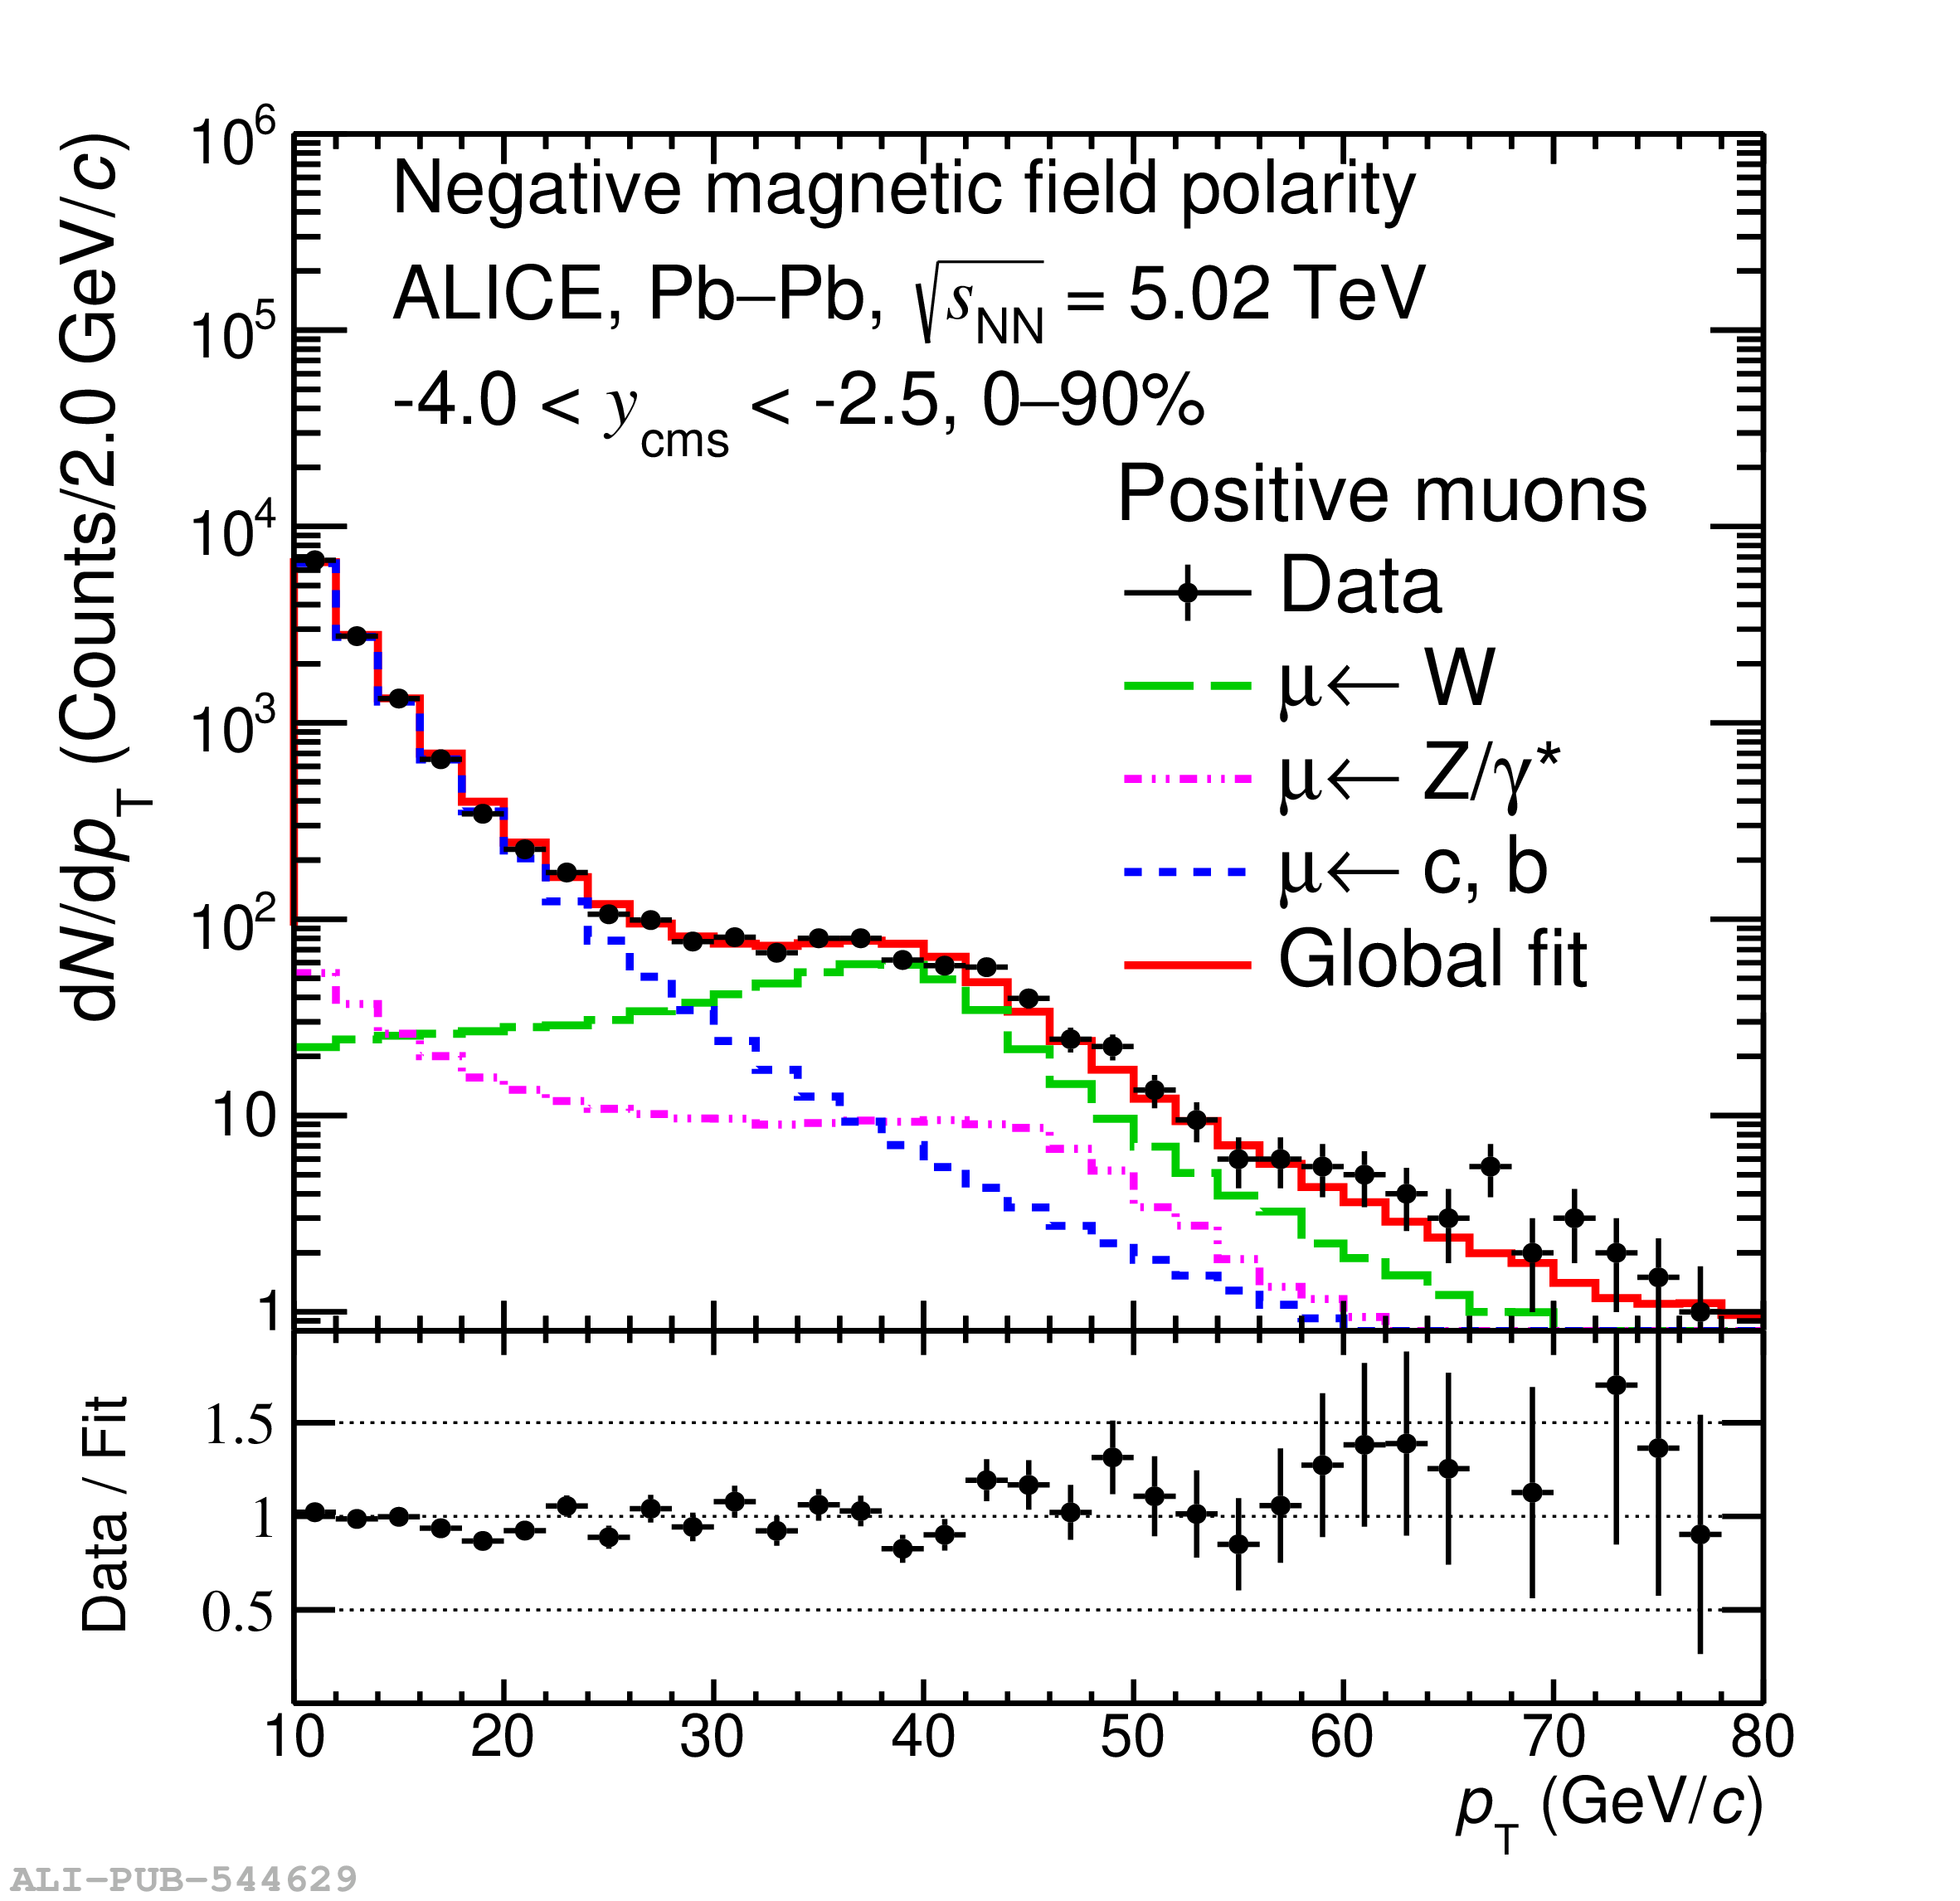 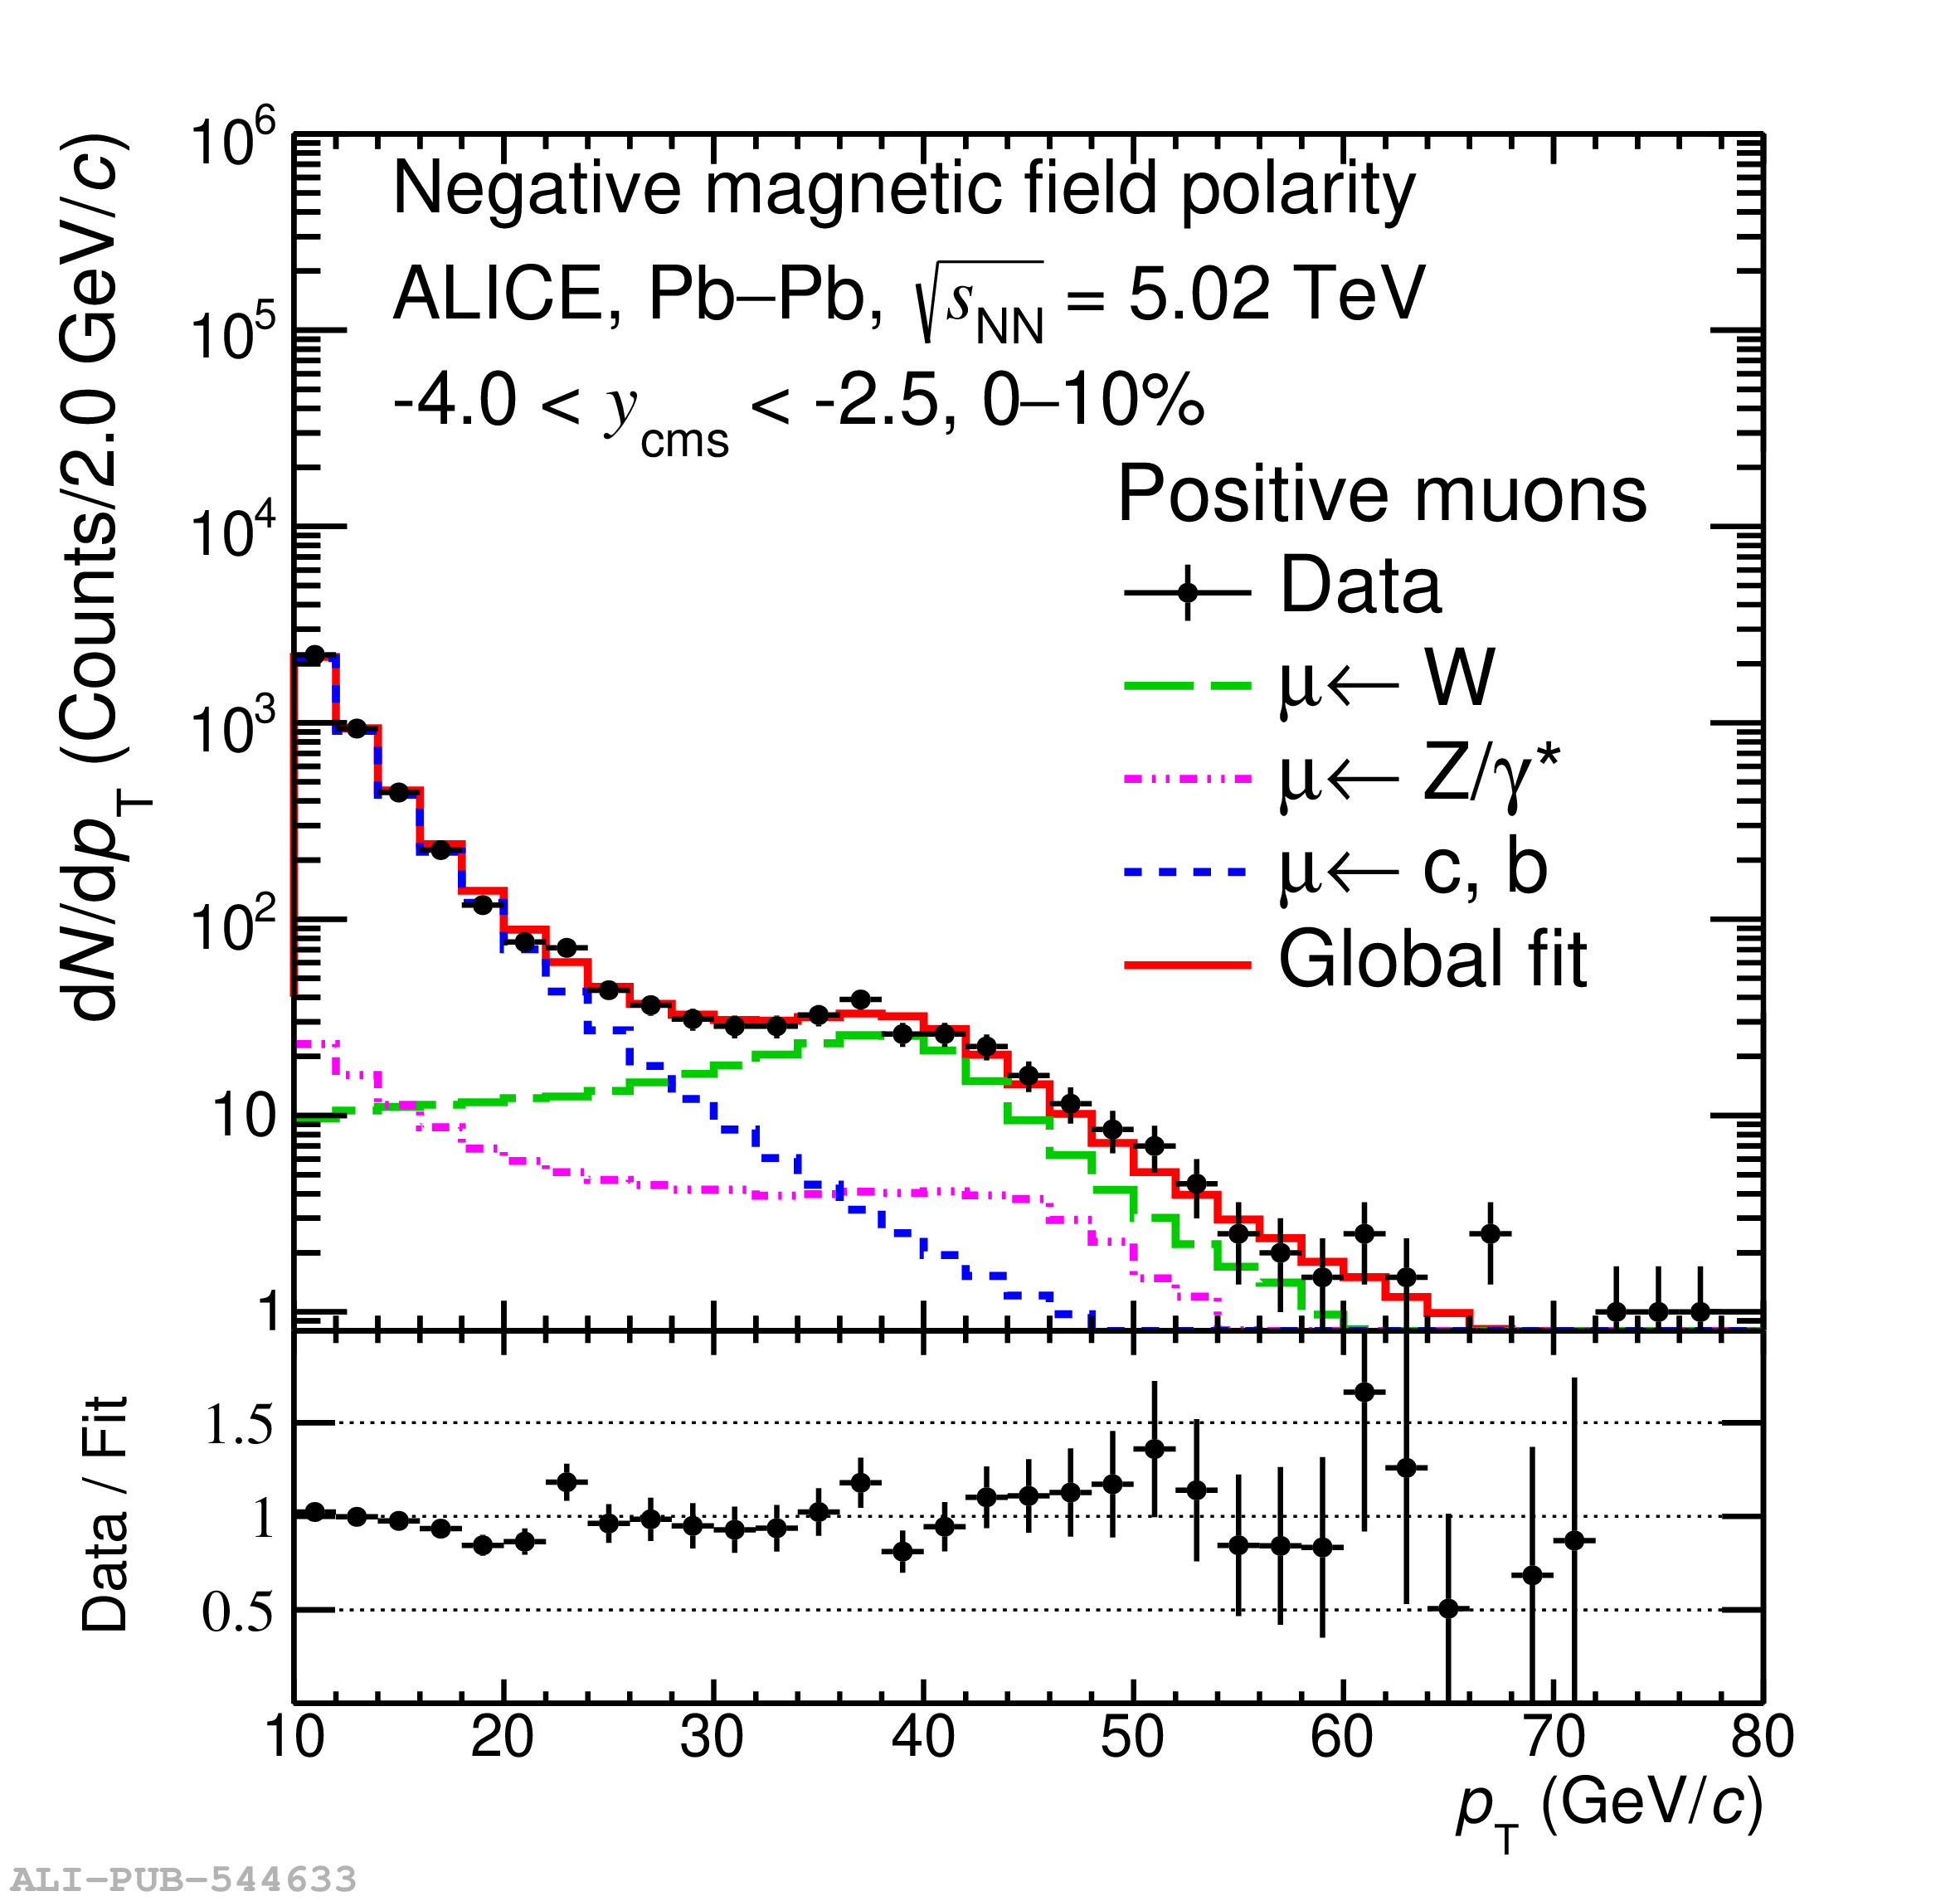 |
Figure 3
Production cross section of muons from W$^-$ (top) and W$^+$ (bottom) decays as a function of rapidity for muons with $\pt^\mu > 10$ GeV/$c$ in p-Pb collisions at $\sqrt{s_{\rm NN}}=8.16$ TeV. The measurements are compared with predictions from several nPDF sets, as well as with calculations based on the CT14 PDF set without nuclear modifications of the PDF. All the calculations include the isospin effect. The bottom panels show the ratio of the calculations to the measured production cross section. The horizontal bars correspond to the width of the rapidity intervals. The vertical bars and boxes indicate the statistical and systematic uncertainties, respectively. The data points are placed at the centres of the rapidity intervals, while the theory predictions are horizontally shifted for better visibility. | 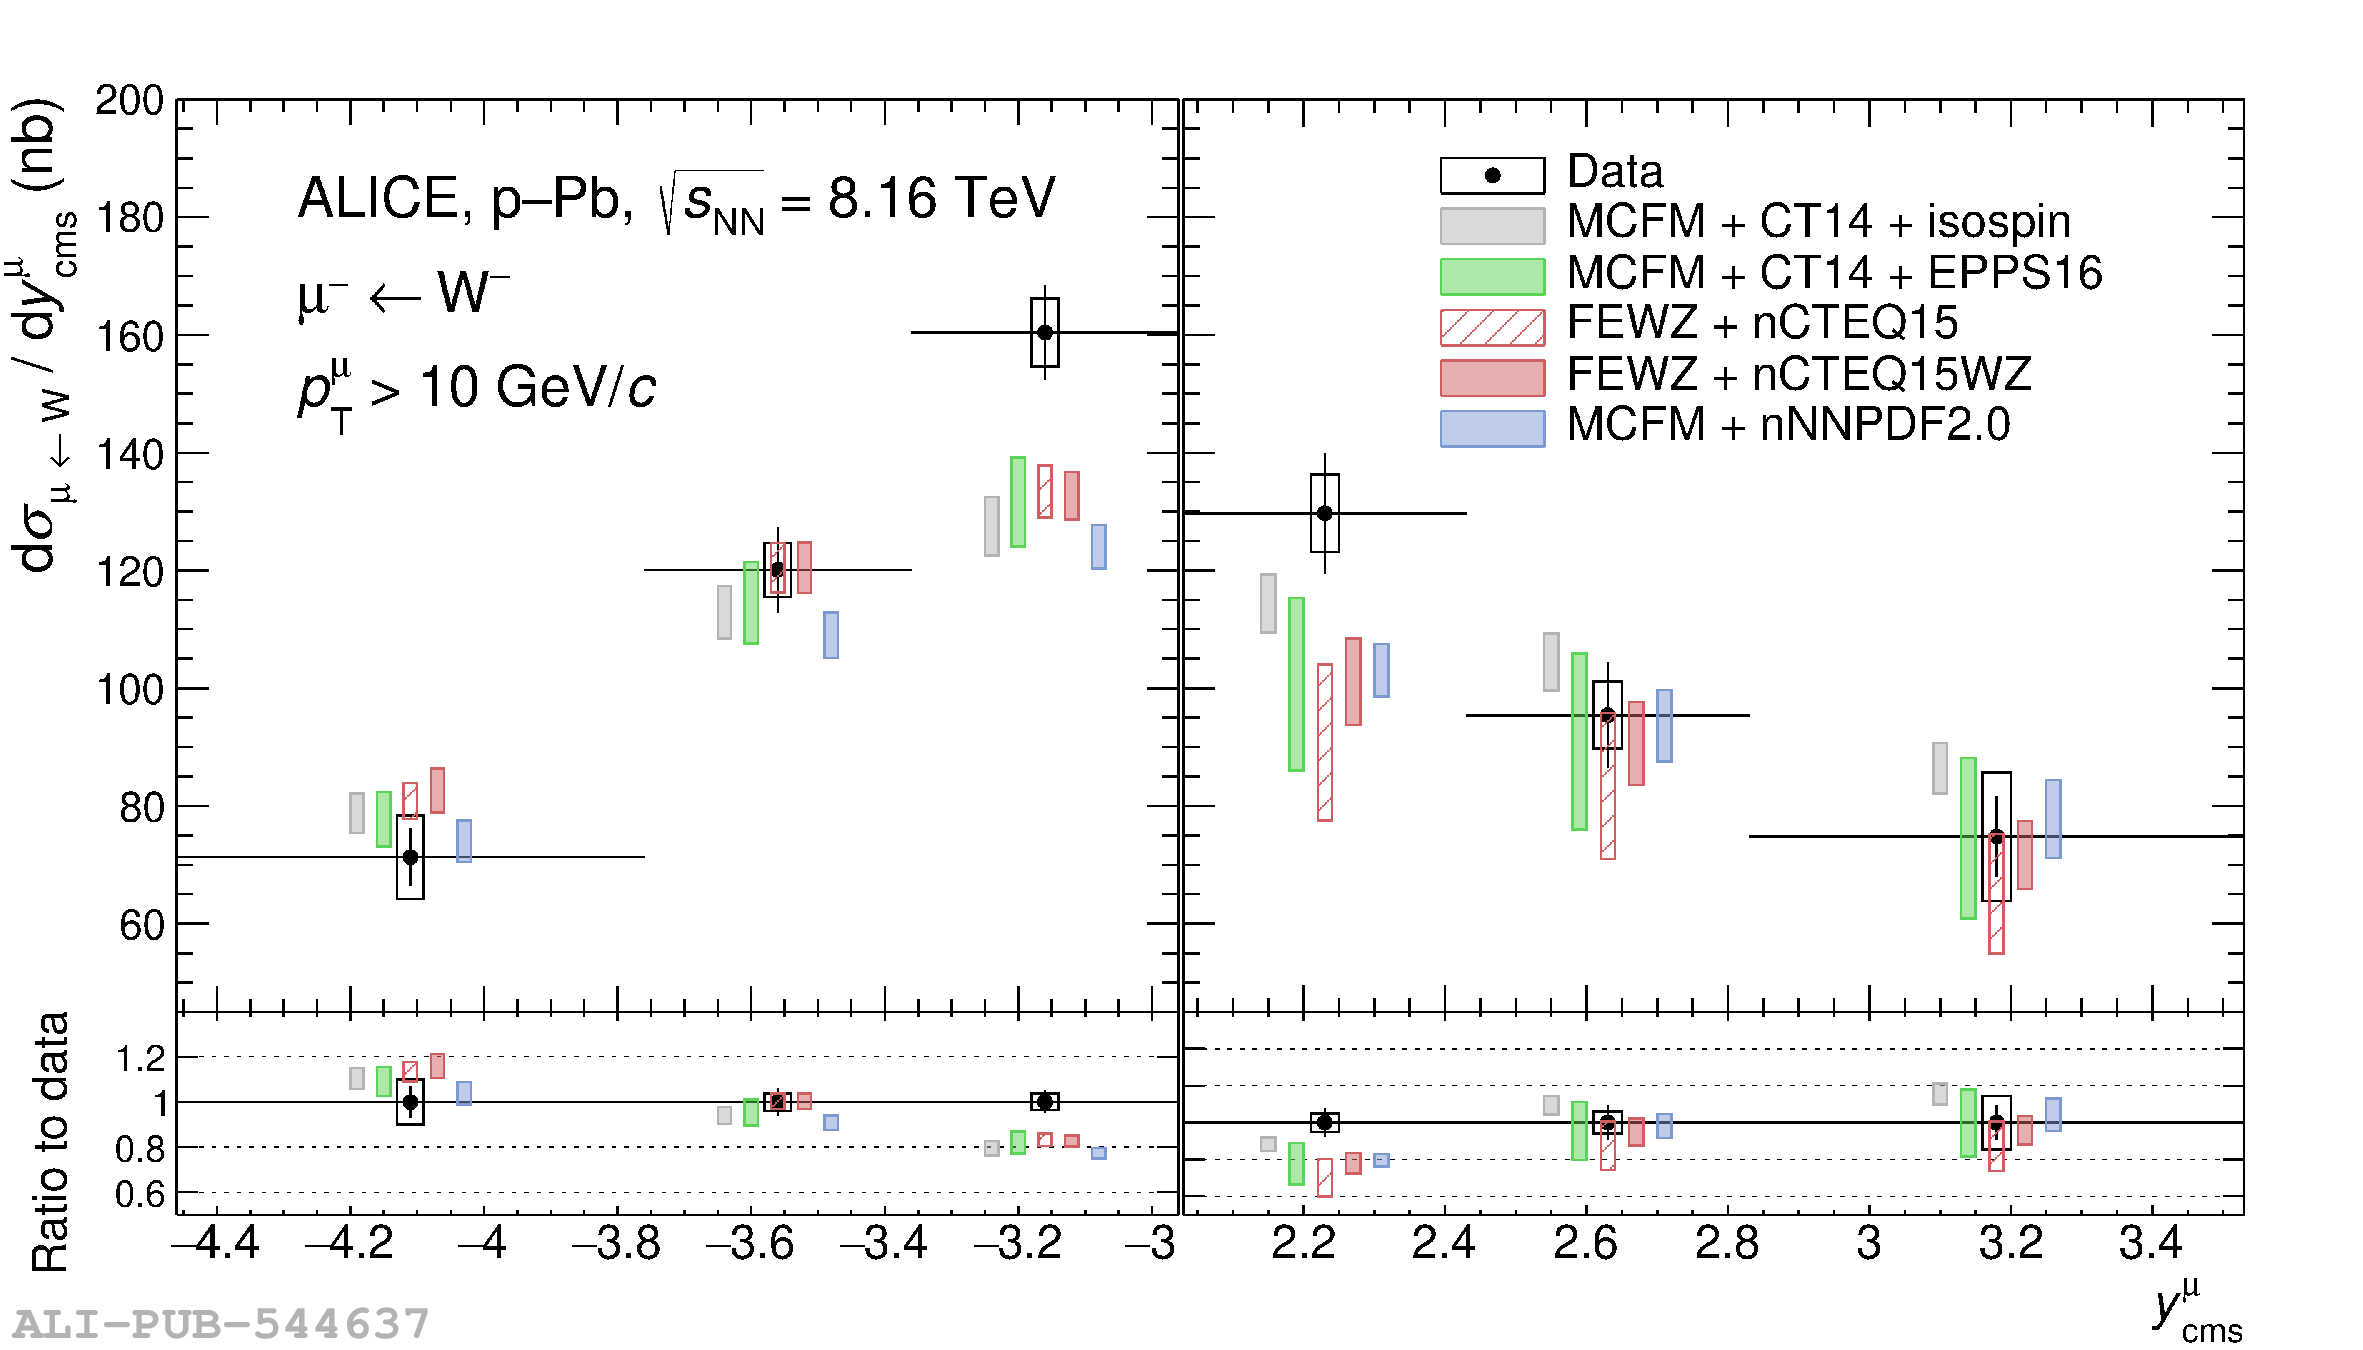 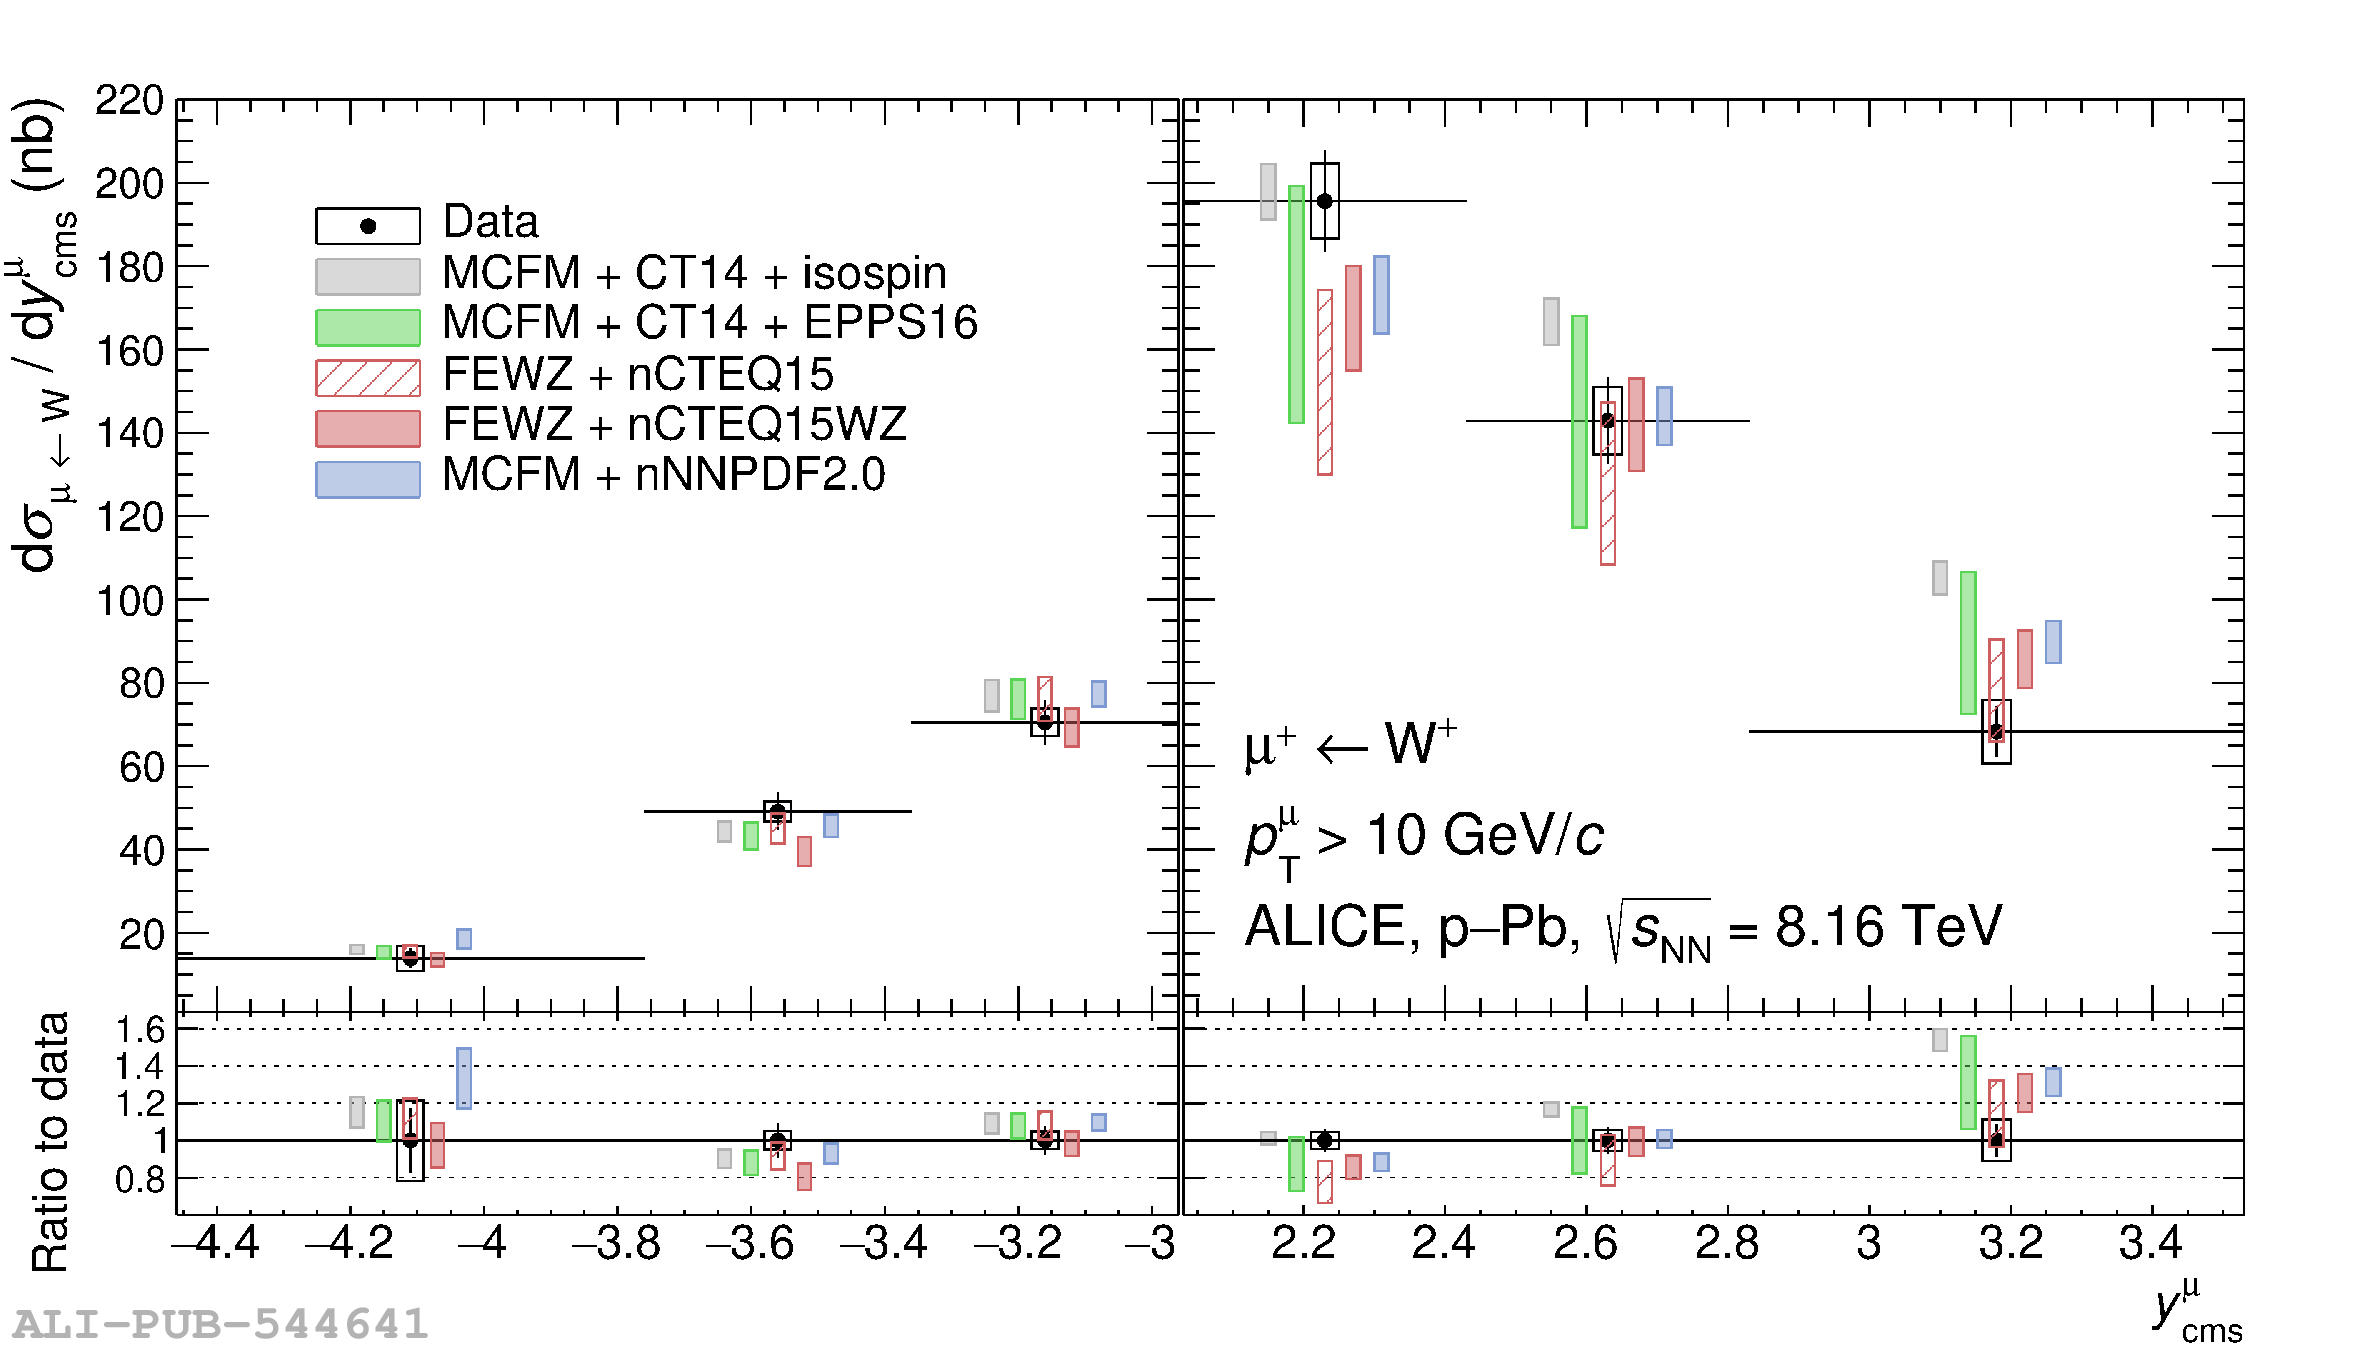 |
Figure 4
Ratio to CT14 predictions of the production of muons from W$^-$ (top) and W$^+$ (bottom) decays measured in p-Pb collisions at $\sqrt{s_{\rm NN}}=8.16$ TeV by the ALICE and CMS Collaborations. The measured ratio is compared to the one obtained from pQCD calculations with CT14+EPPS16 . All the calculations include the isospin effect. The grey band around the line at unity indicates the uncertainty on the calculations with CT14 PDFs. | 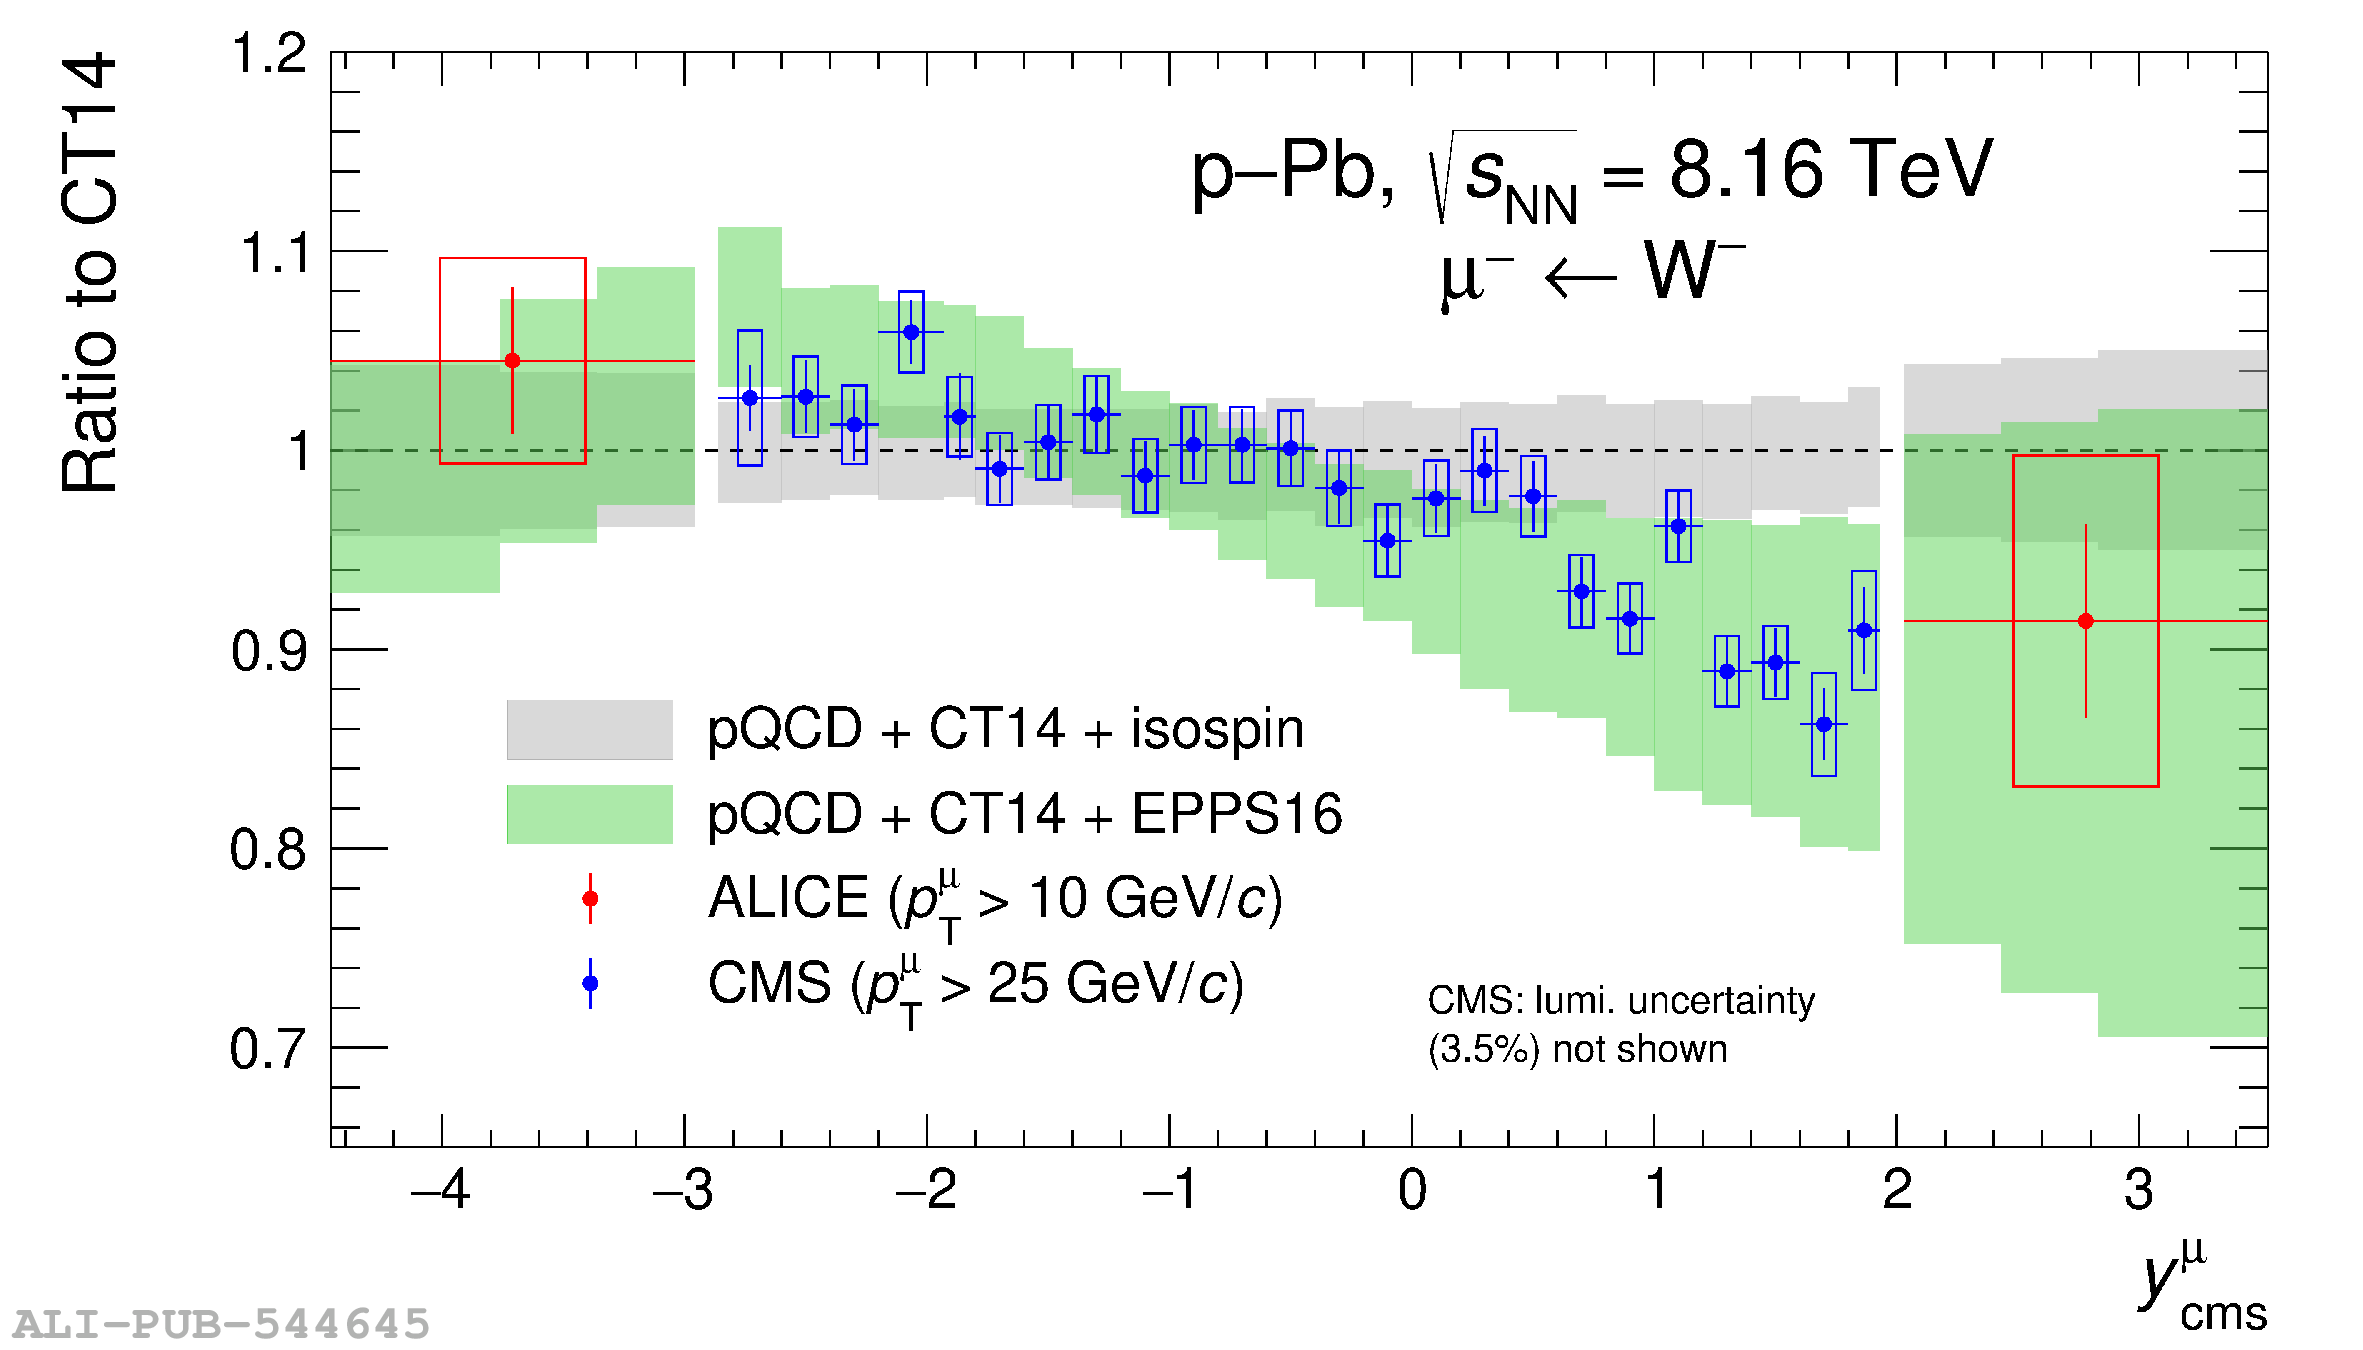 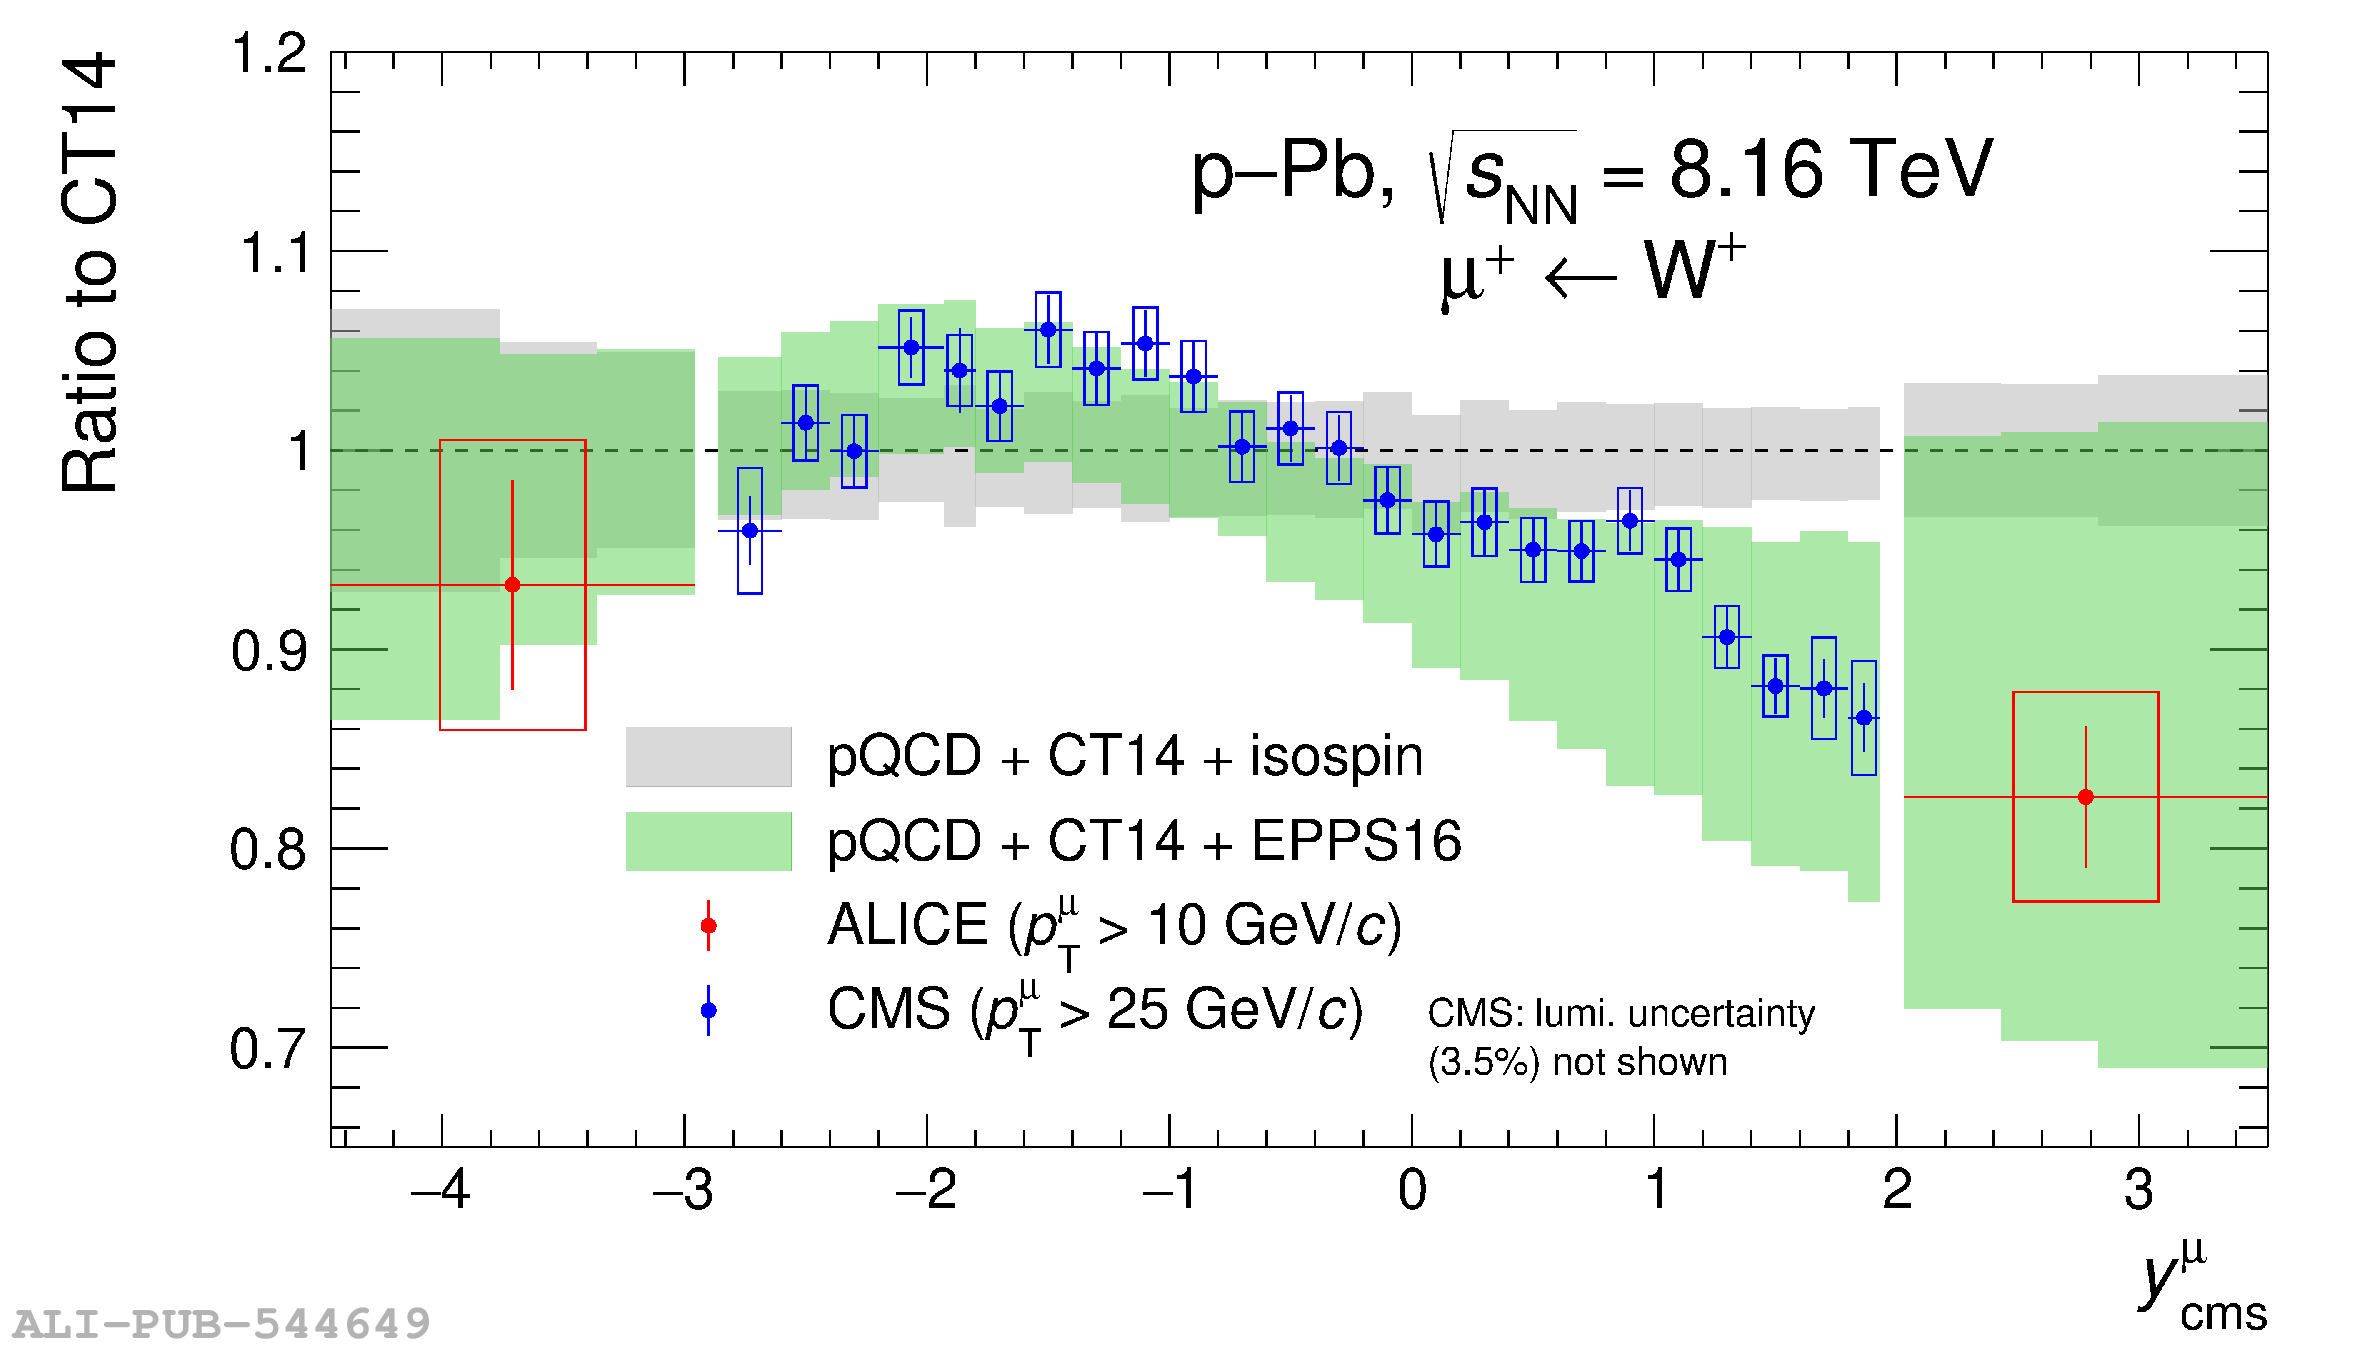 |
Figure 5
Lepton charge asymmetry for muons from W$^\pm$-boson decays with $\pt^\mu > 10$ GeV/$c$ in p-Pb collisions at $\sqrt{s_{\rm NN}}=8.16$ TeV. The measurements are compared with predictions from pQCD calculations with several nPDF sets as well as with calculations based on the CT14 PDF without nuclear modifications. All the calculations include the isospin effect. The bottom panels show the ratio of the calculated to the measured asymmetry. The horizontal bars correspond to the width of the rapidity intervals. The vertical bars and boxes indicate the statistical and systematic uncertainties, respectively. The data points are placed at the centres of the rapidity intervals while the theory points are horizontally shifted for better visibility. | 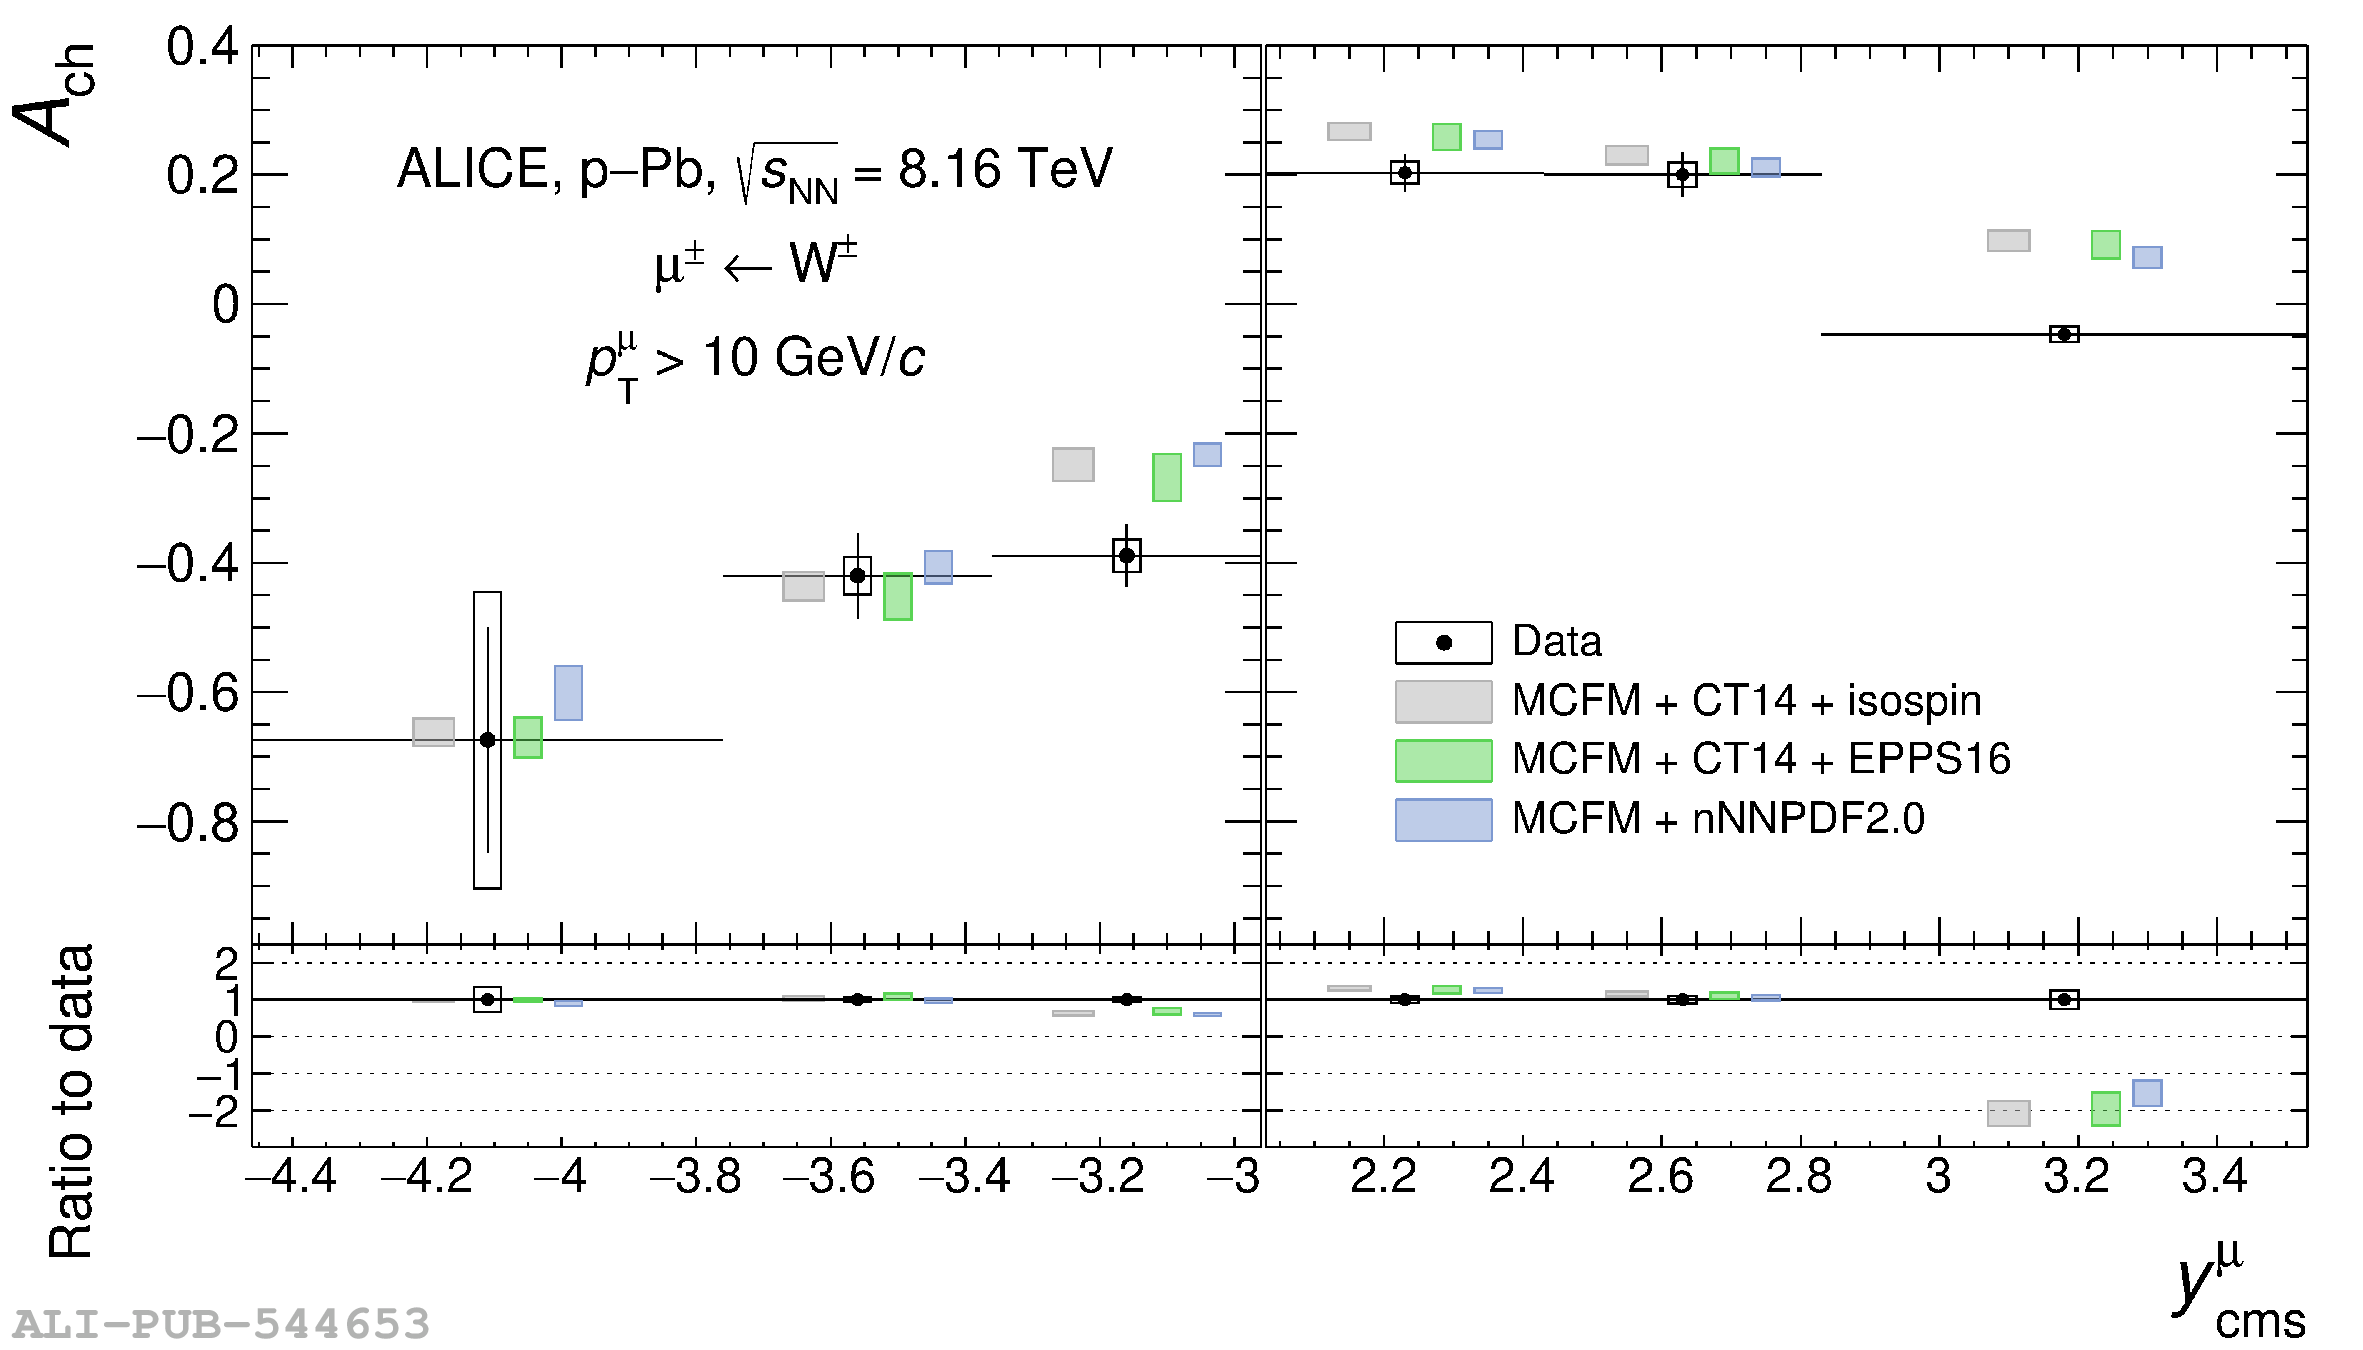 |
Figure 6
Nuclear modification factor $R_{\rm pPb}$ for muons from W$^-$ (top) and W$^+$ (bottom) decays with $\pt^\mu >$ 10 GeV/$c$ in p-Pb collisions at $\sqrt{s_{\rm NN}}=8.16$ TeV. The measurements are compared with predictions from pQCD calculations with several nPDF sets. The horizontal bars correspond to the width of the rapidity bins. The vertical bars and boxes indicate the statistical and systematic uncertainties respectively. The grey bands indicate the uncertainty on the pp production cross section. The data points are placed at the centres of the rapidity intervals while the theory points are horizontally shifted for better visibility. | 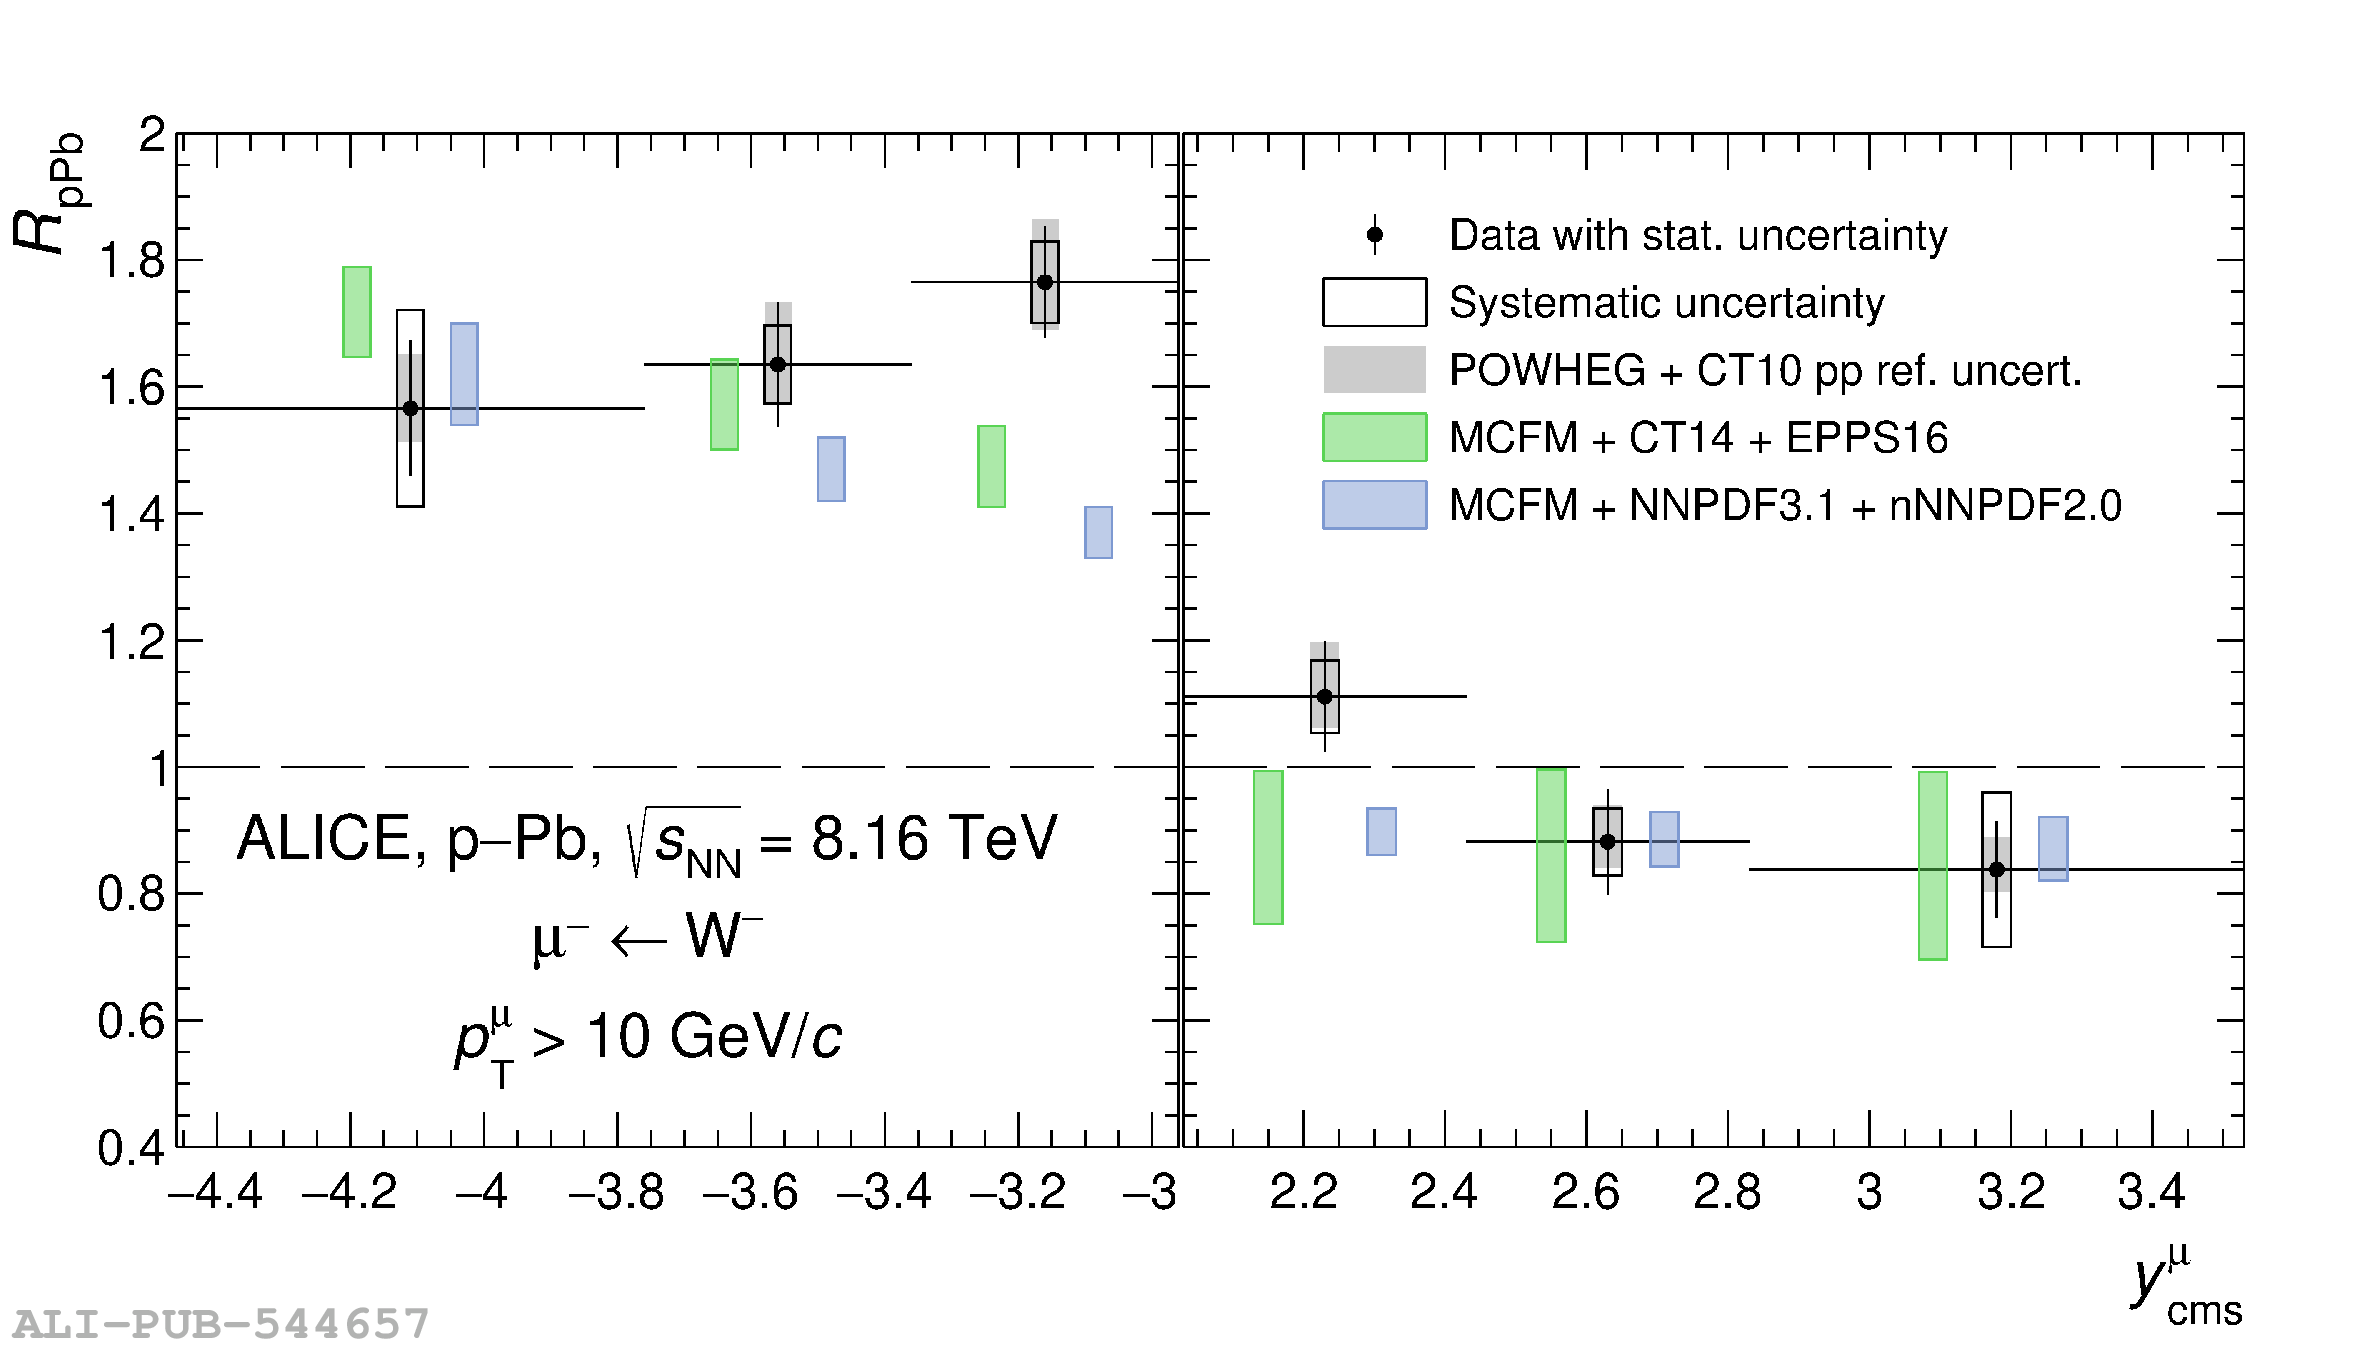 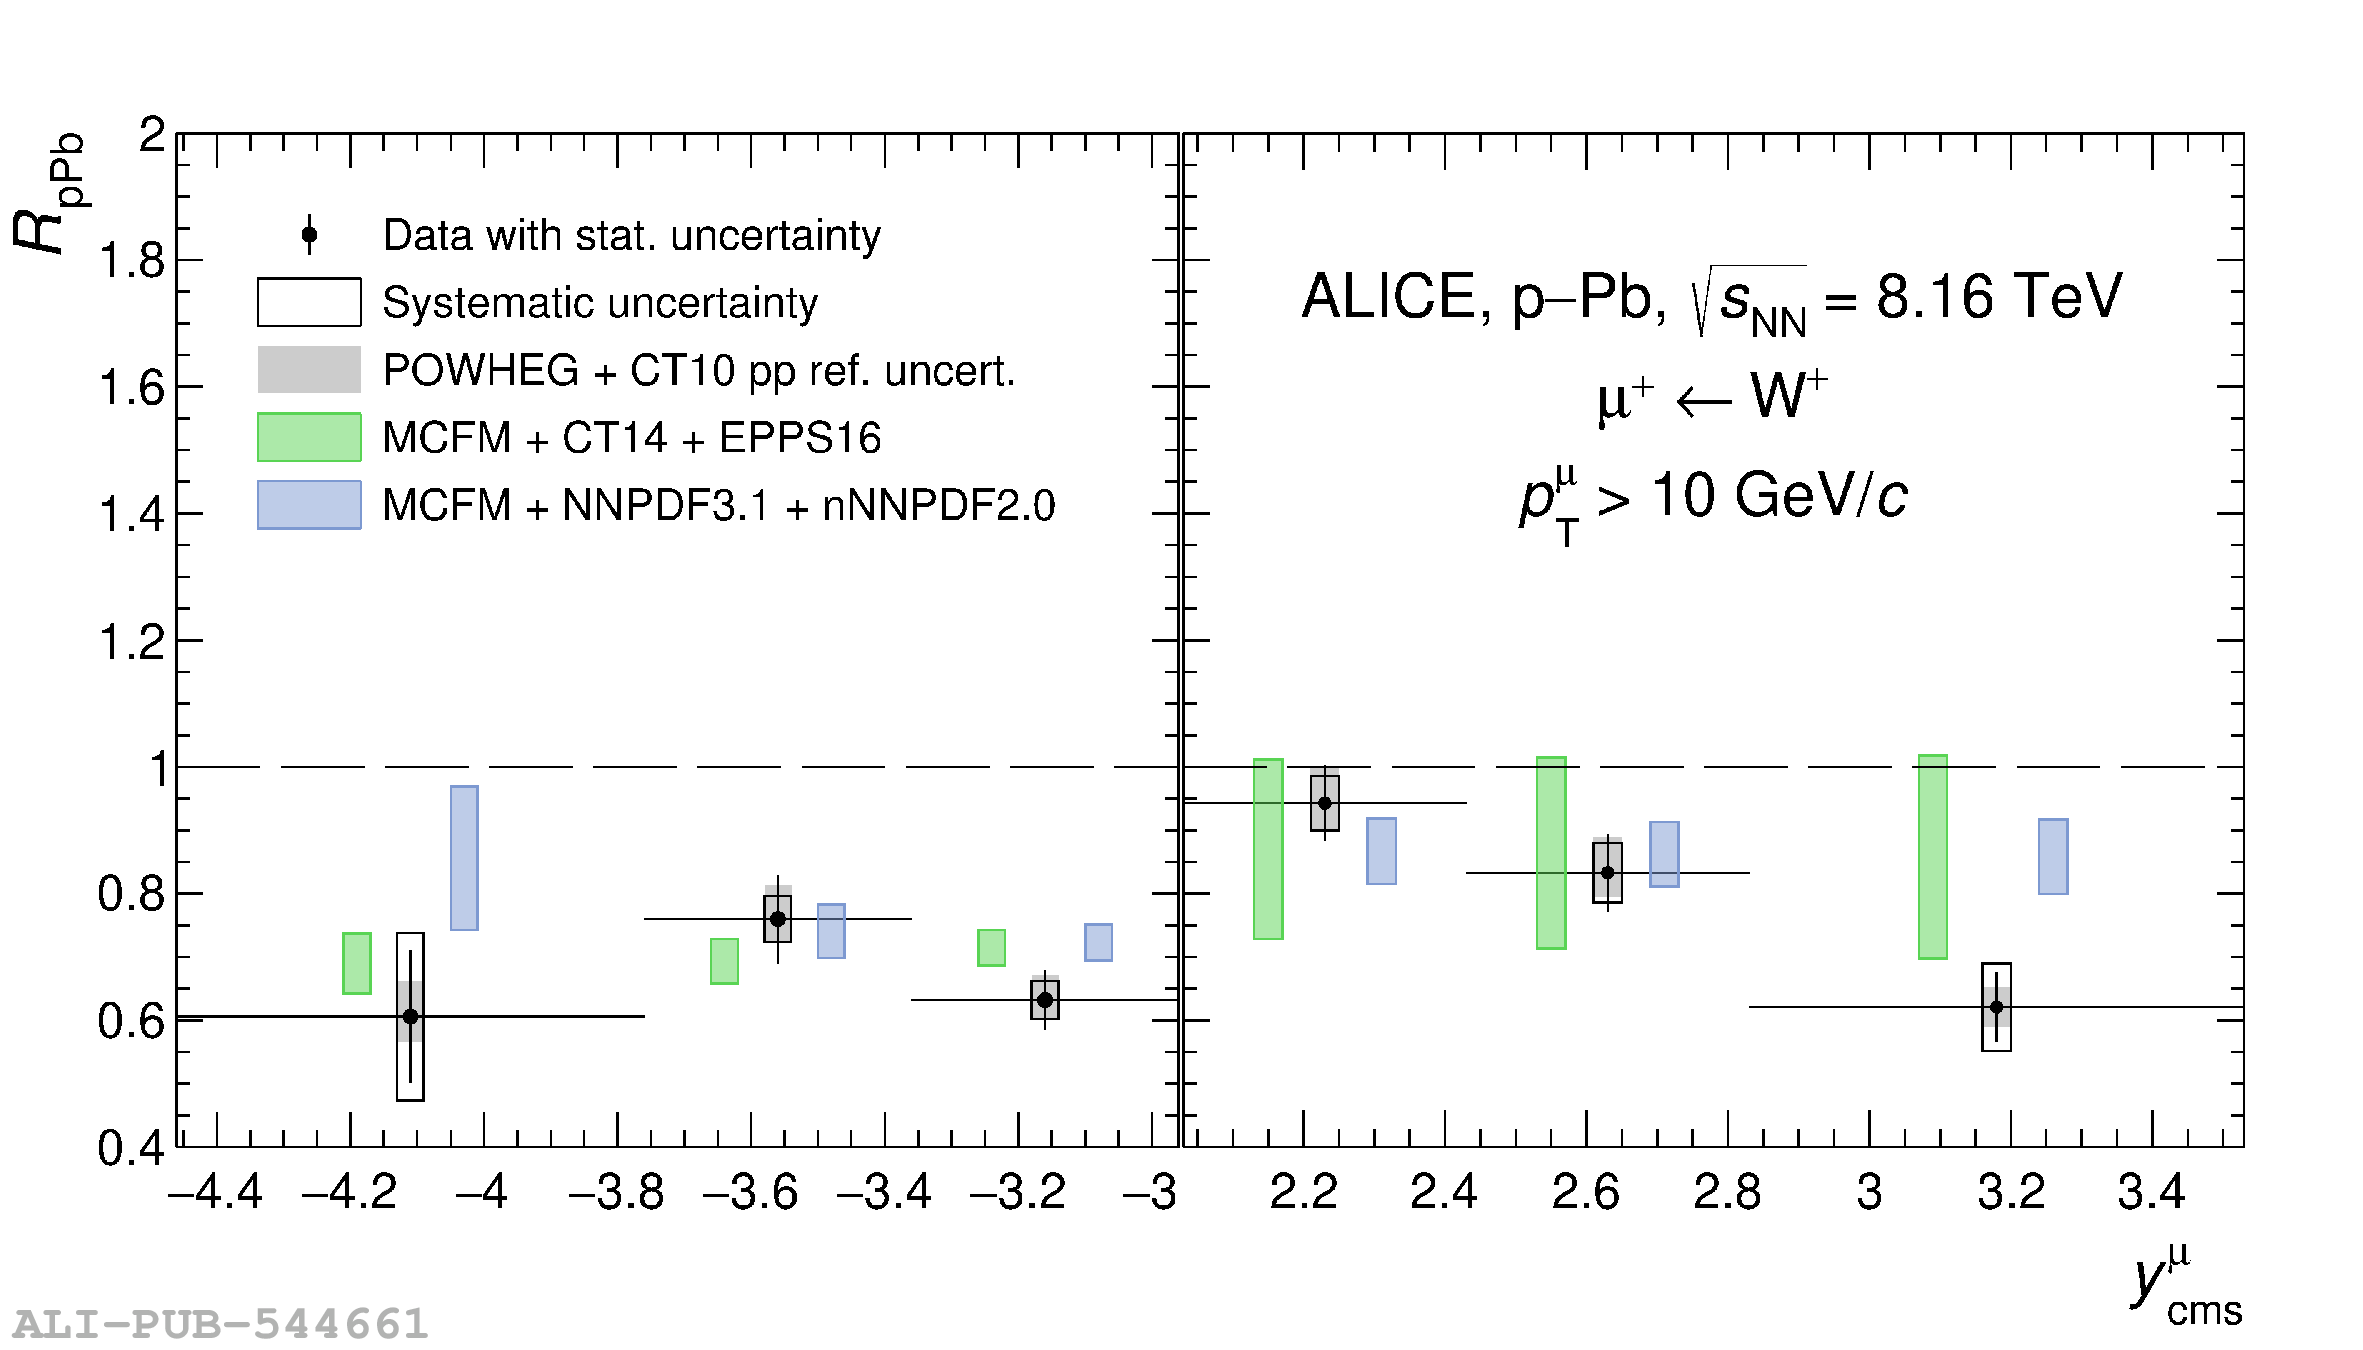 |
Figure 7
Combined yield of muons from W$^-$ and W$^+$ decays with $\pt^\mu >$ 10 GeV/$c$, normalised by the average number of binary nucleon--nucleon collisions $\langle N_{\rm coll}^{\rm mult} \rangle$ in p-Pb collisions at $\sqrt{s_{\rm NN}}=8.16$ TeV in the Pb-going (left) and p-going (right) configurations. The bars and boxes correspond to statistical and systematic uncertainties respectively. The horizontal dashed line indicates the central value of the yield normalised to $\langle N_{\rm coll}^{\rm mult} \rangle$ measured for the 0--100\% centrality interval. | 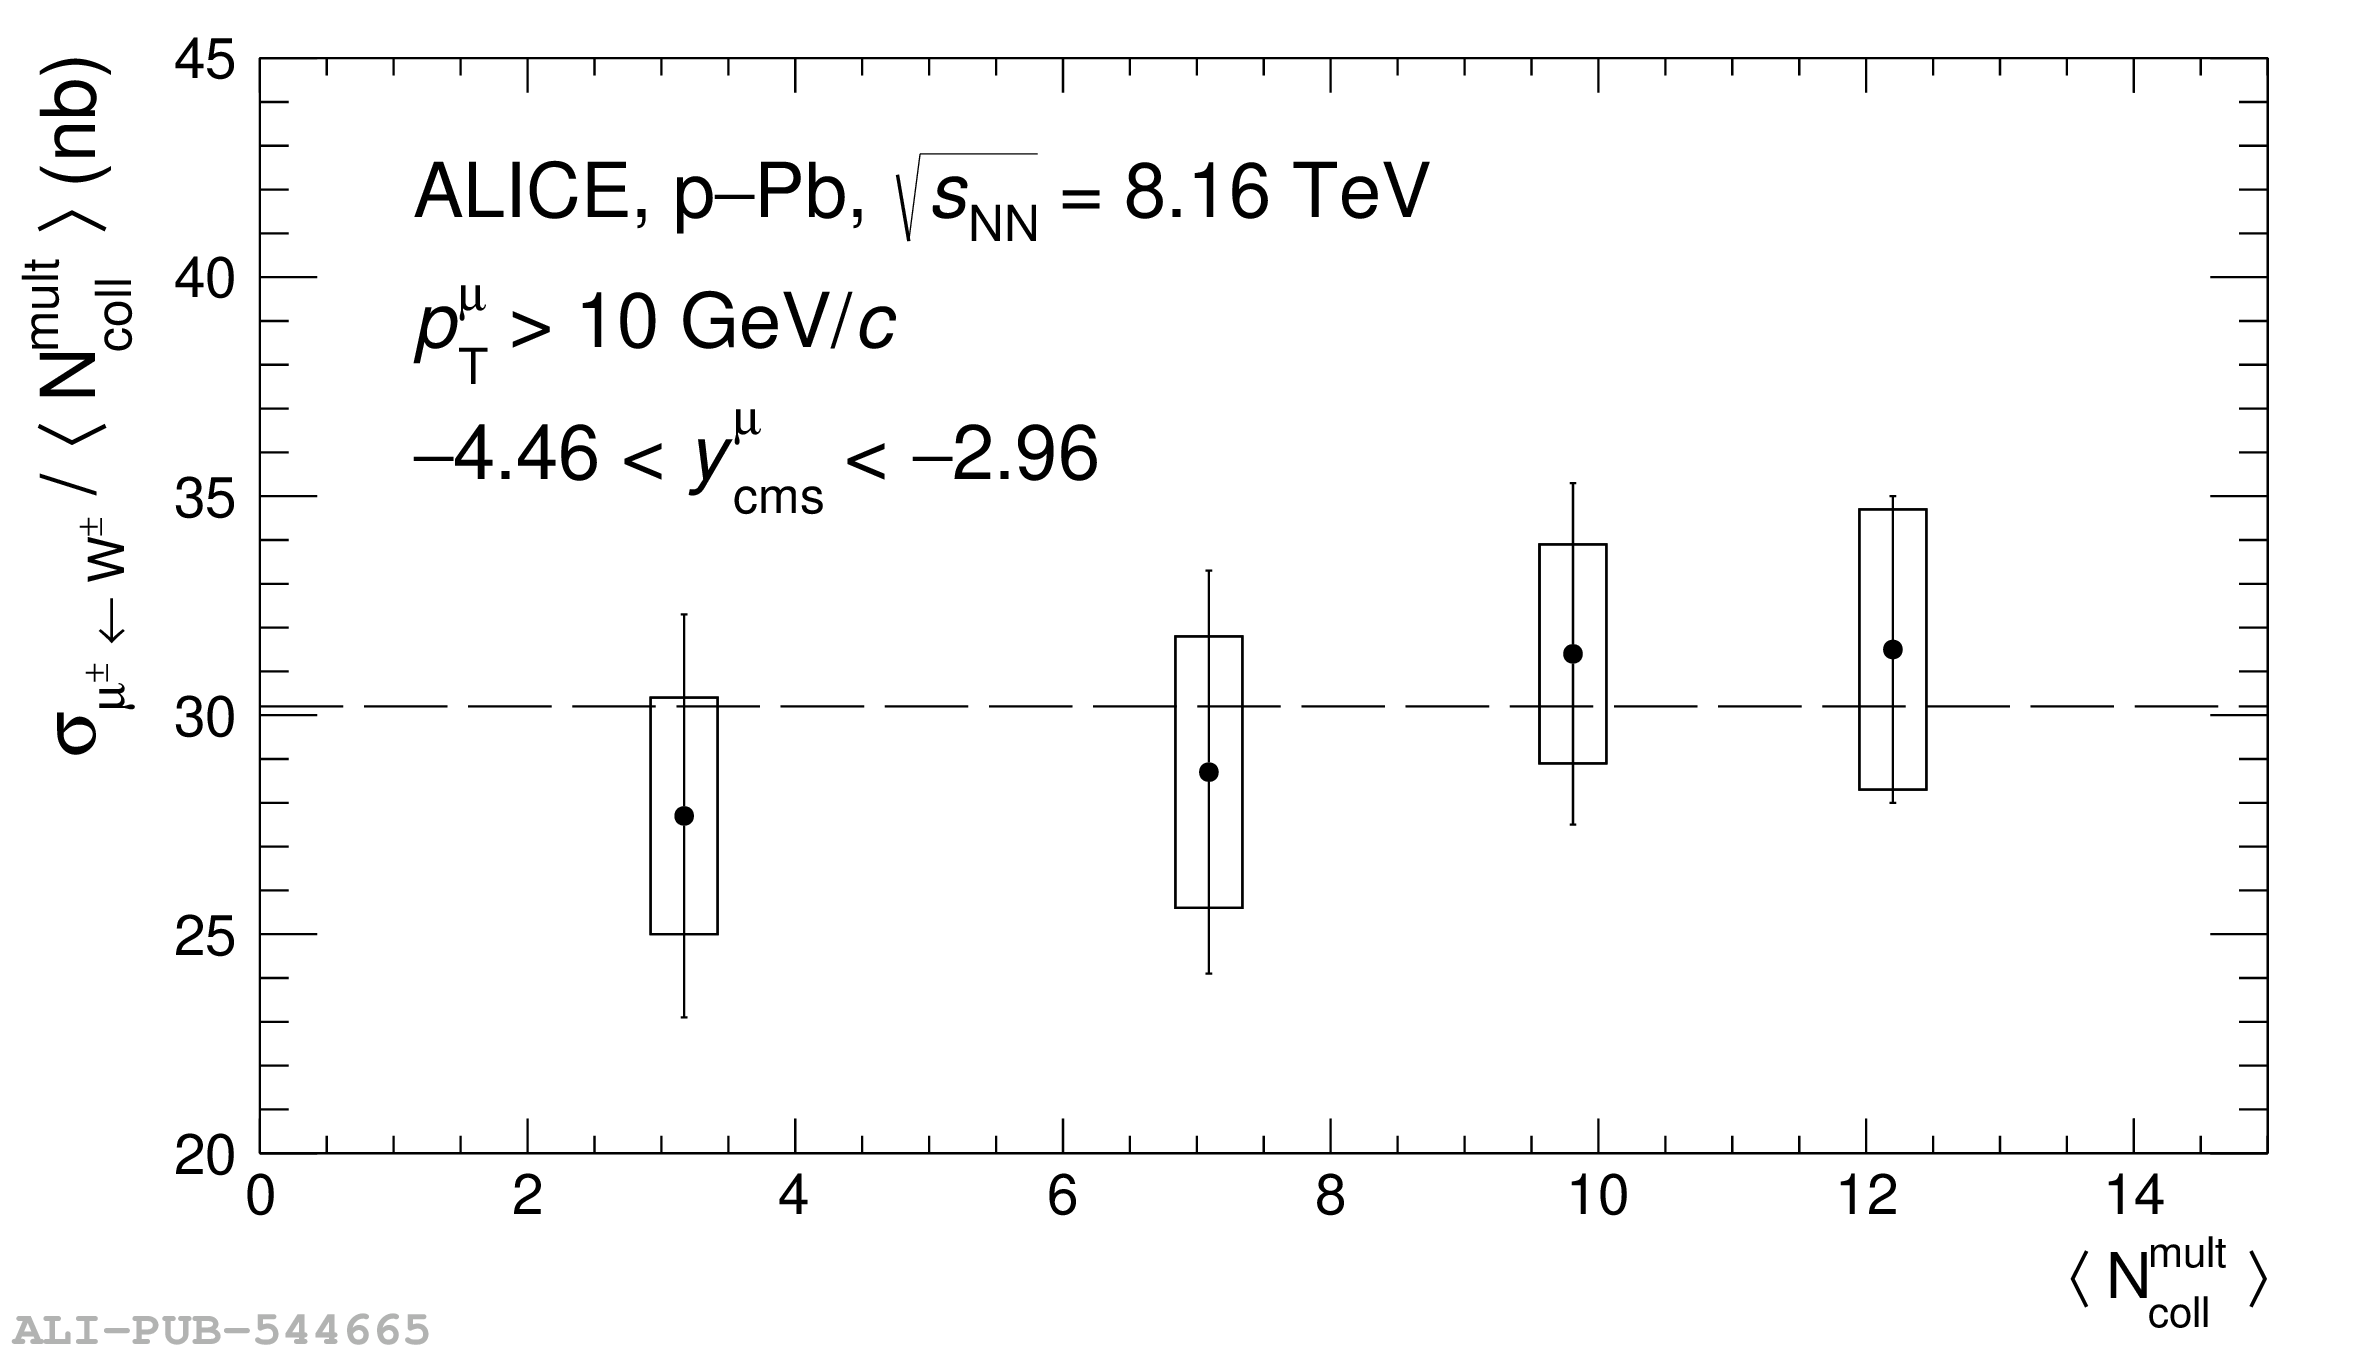  |
Figure 8
Production cross section (left panel) and lepton charge asymmetry (right panel) of the W$^\pm \rightarrow \mu^\pm \nu_\mu$ processes for the 0--90\% centrality class, for muons with $\pt^\mu > 10$ GeV/c and $2.5 < y^\mu_{\rm cms} < 4.0$, in Pb-Pb collisions at $\sqrt{s_{\rm NN}}=5.02$ TeV. The measured cross sections and the asymmetry are compared with predictions using the CT14+EPPS16 combination, nNNPDF2.0 nPDF model, as well as calculations with the CT14 PDF without nuclear corrections. All the calculations include the isospin effect. The vertical bars and boxes around the data points indicate the statistical and systematic uncertainties, respectively. |  |
Figure 9
$\langle T_{\rm AA} \rangle$-scaled yield of muons from W$^-$ (left) and W$^+$ (right) decays in Pb-Pb collisions at $\sqrt{s_{\rm NN}}=5.02$ TeV for muons with $\pt^\mu > 10$ GeV/$c$ and $2.5 < y^\mu_{\rm cms} < 4.0$. In the top panels the yield is compared with pQCD calculations using the CT14 PDF as baseline and implementing the EPPS16 nuclear modifications. The ratio to theory of the measured yield normalised with $\langle T_{\rm AA} \rangle$ evaluated with $\sigma^{\rm inel}_{\rm NN}$ = 67.6 mb and 47.5 mb is shown in the middle and bottom panels, respectively (see the text for details). The horizontal bars indicate the width of the centrality intervals, the vertical bars and boxes correspond to the statistical and systematic uncertainties, respectively. The band indicate the uncertainty on the theoretical computations. | 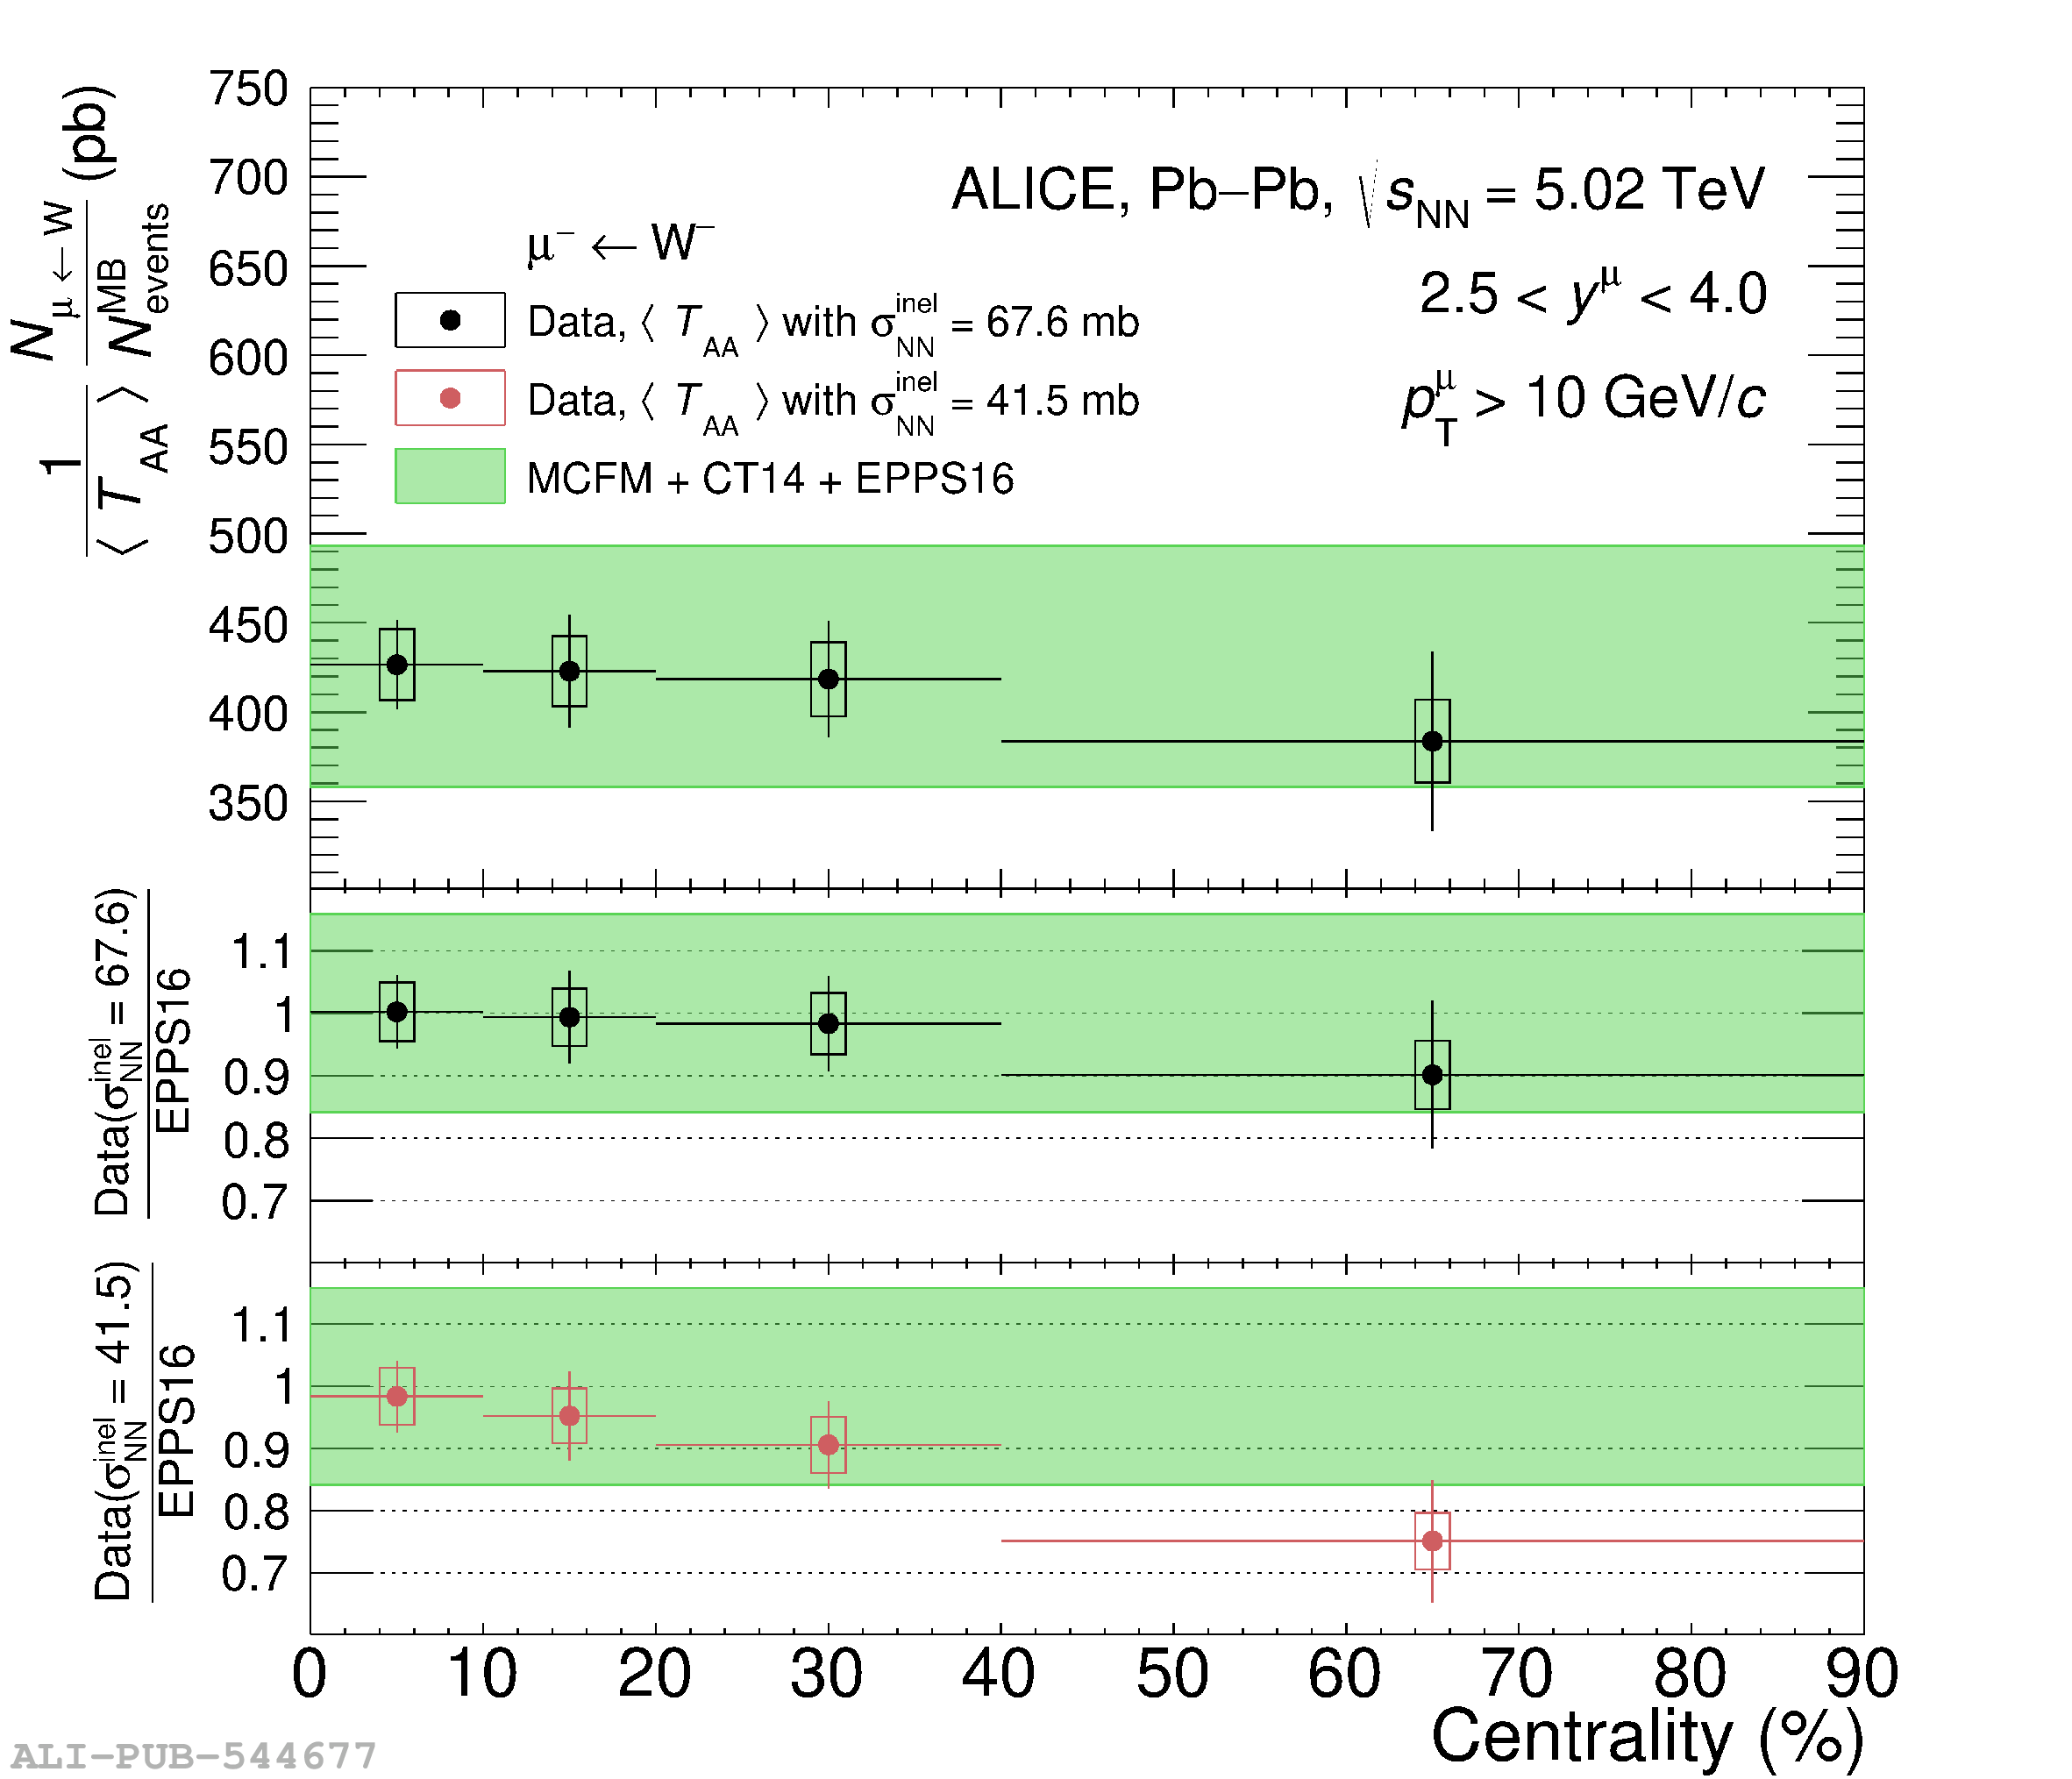 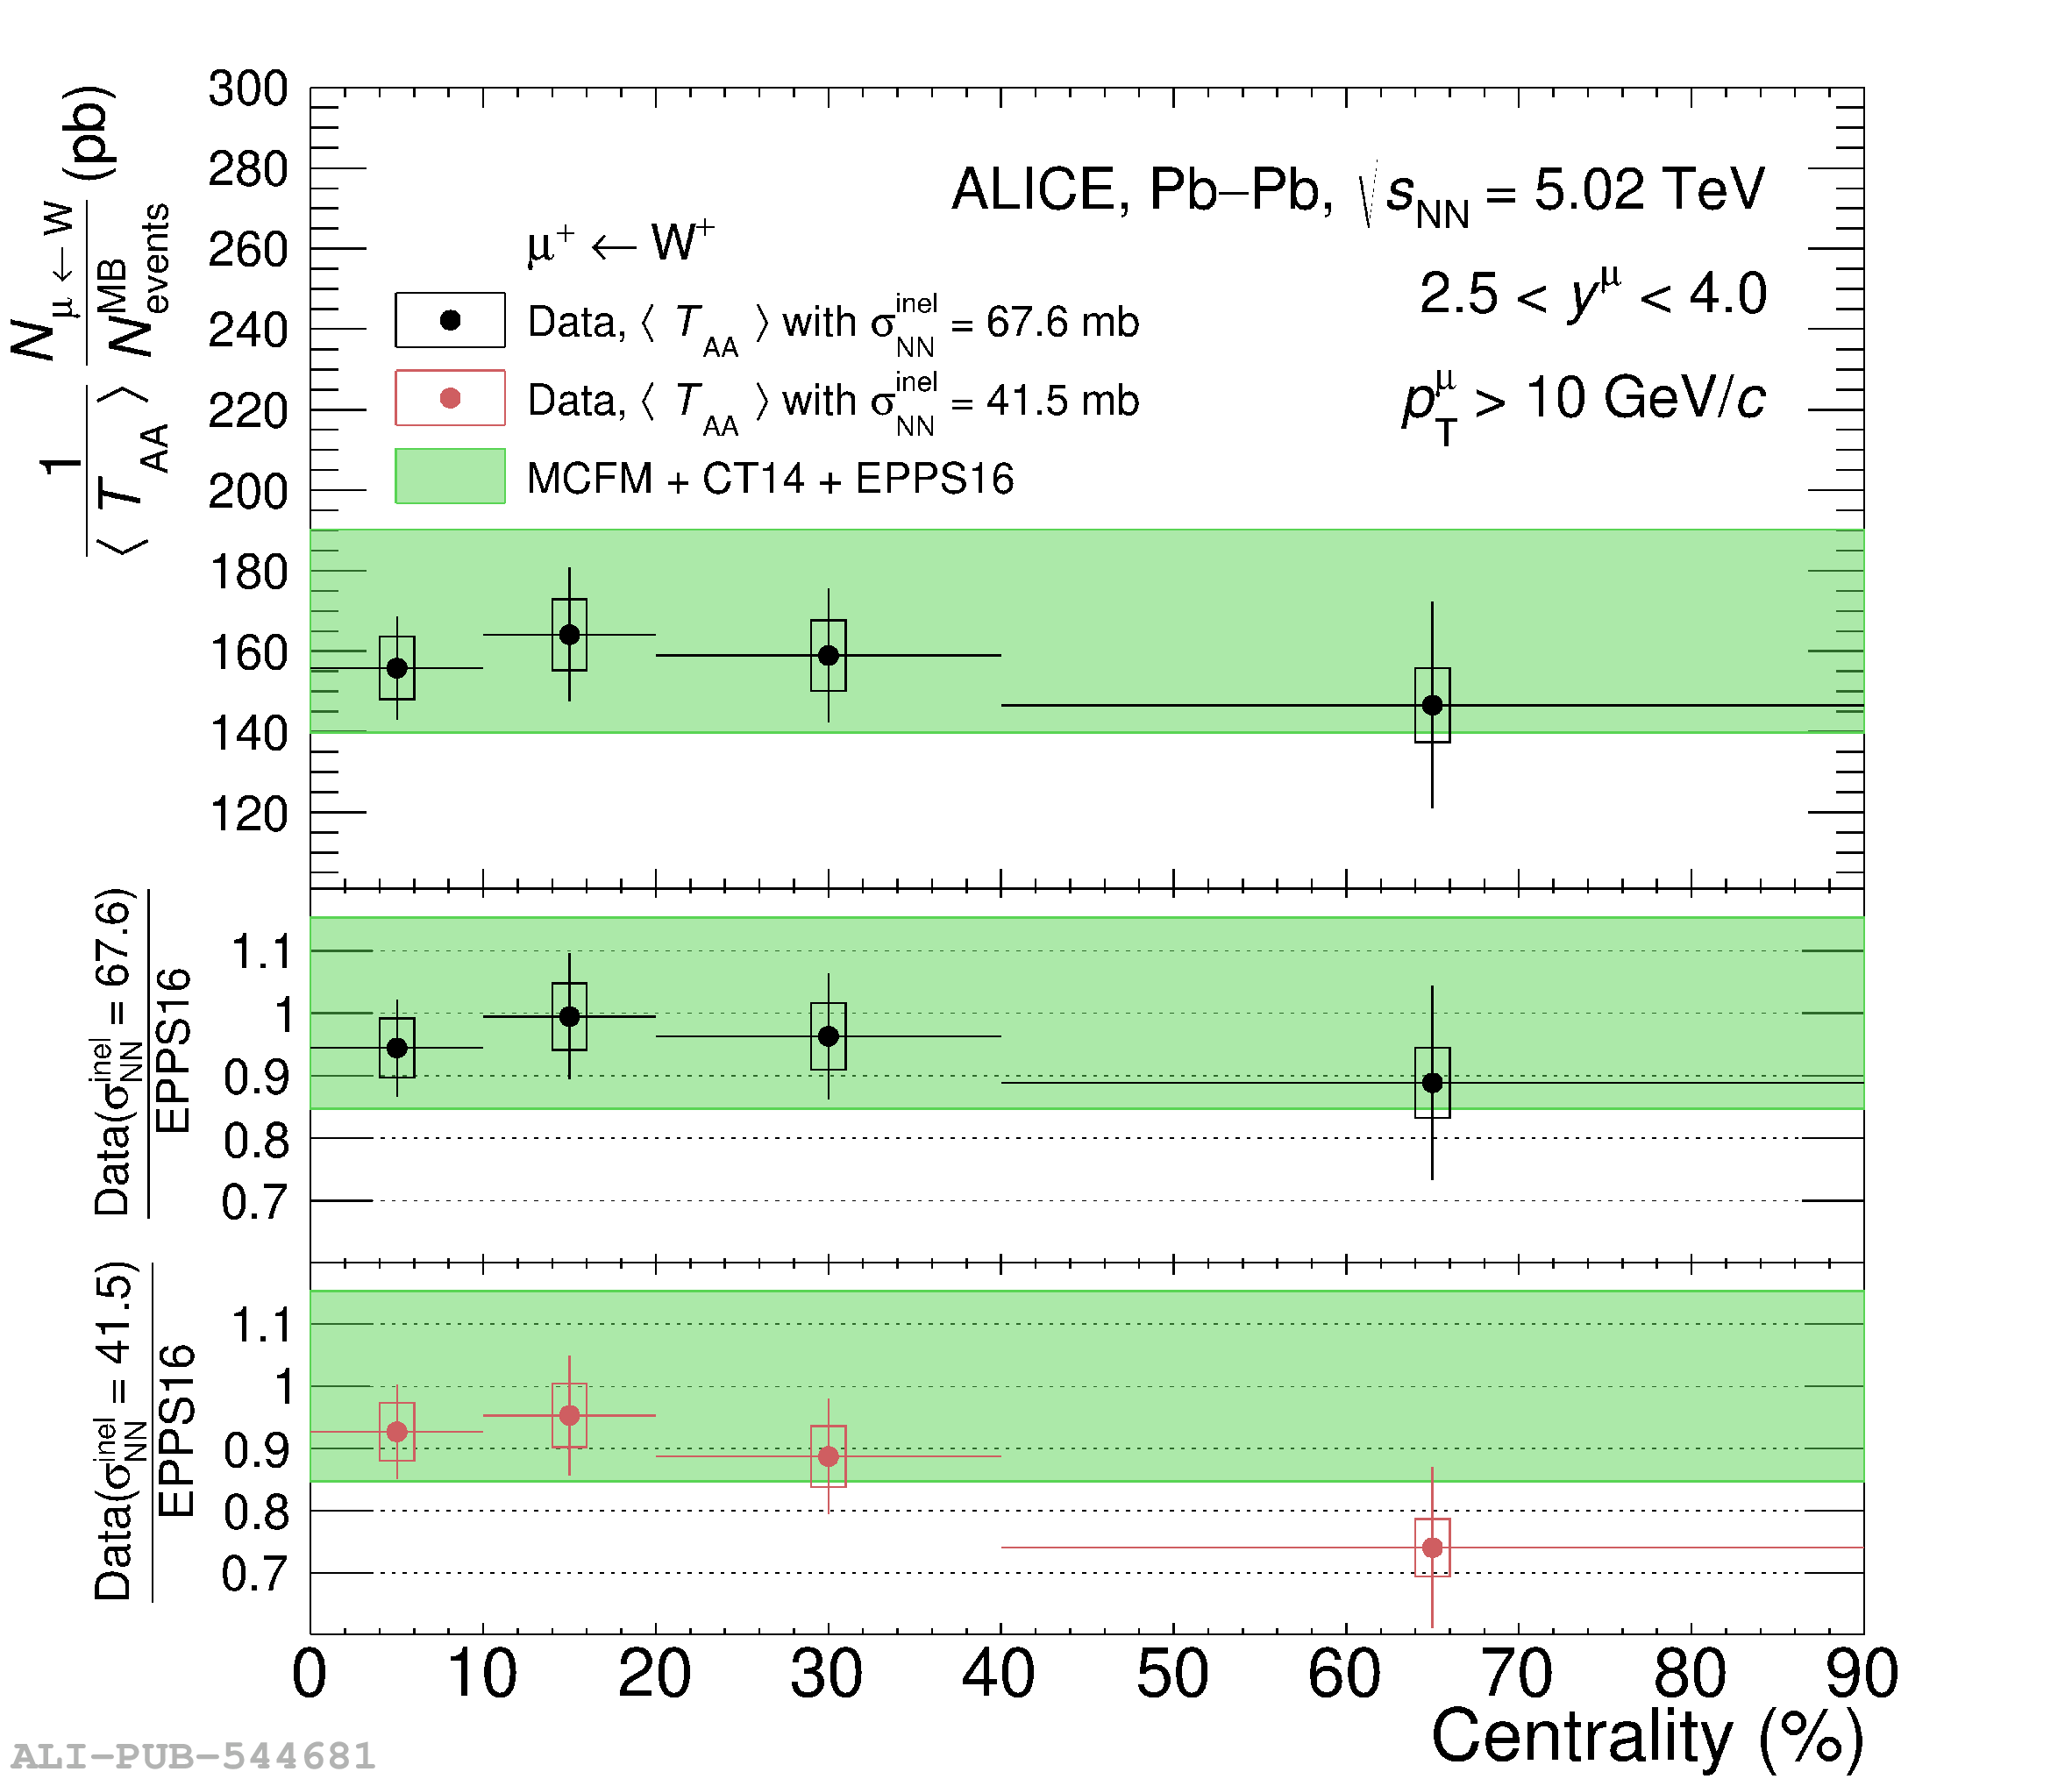 |
Figure 10
$\langle T_{\rm AA} \rangle$-scaled yield of muons from W$^-$ and W$^+$ decays in Pb-Pb collisions at $\sqrt{s_{\rm NN}}=5.02$ TeV for muons with $\pt^\mu > 10$ GeV/$c$ and $2.5 < y^\mu_{\rm cms} < 4.0$. The measured production is compared with HG-PYTHIA calculations of the $R_{\rm AA}$ of hard scatterings scaled with the centrality-averaged production in 0--90\% centrality, indicated as dashed lines. The horizontal bars correspond to the width of the centrality intervals, the vertical bars and boxes indicate the statistical and systematic uncertainties, respectively. | 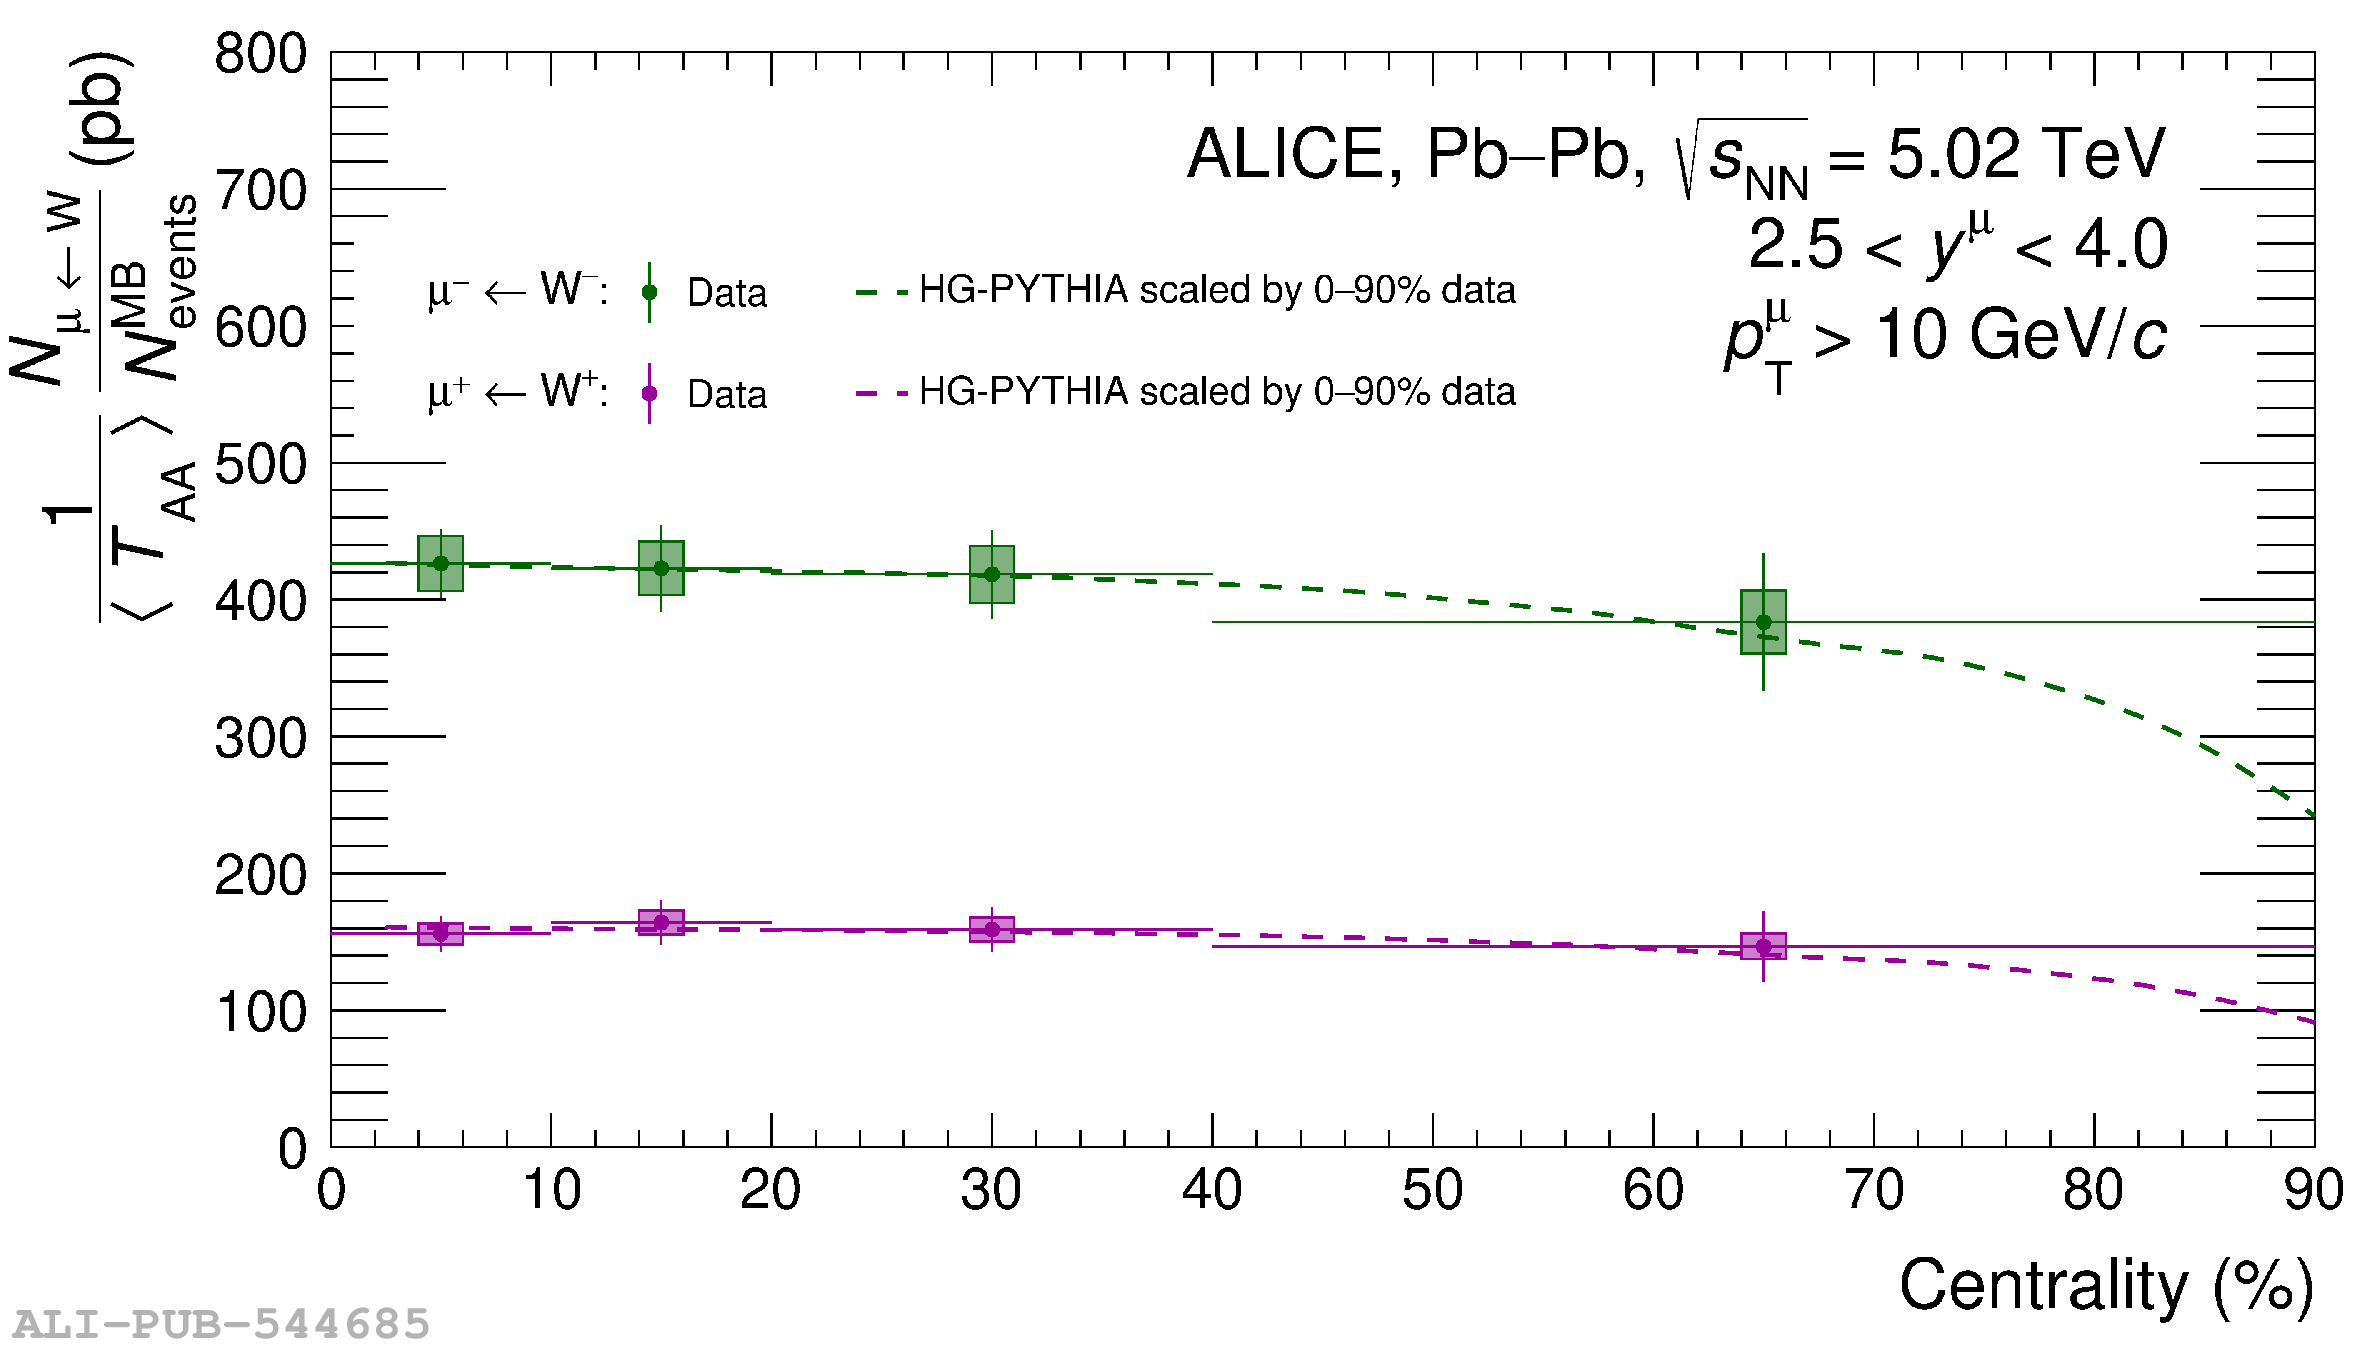 |
Figure 11
Ratio to pQCD calculations with CT14 PDFs of the production of muons from W$^-$ (top) and W$^+$ (bottom) decays measured as a function of rapidity in Pb-Pb collisions at $\sqrt{s_{\rm NN}}=5.02$ TeV by the ALICE and ATLAS Collaborations. The ratio of EPPS16+CT14 calculations to that of CT14-only calculations is also shown. The grey band around the line at unity indicates the uncertainty on the calculations with CT14 PDFs. | 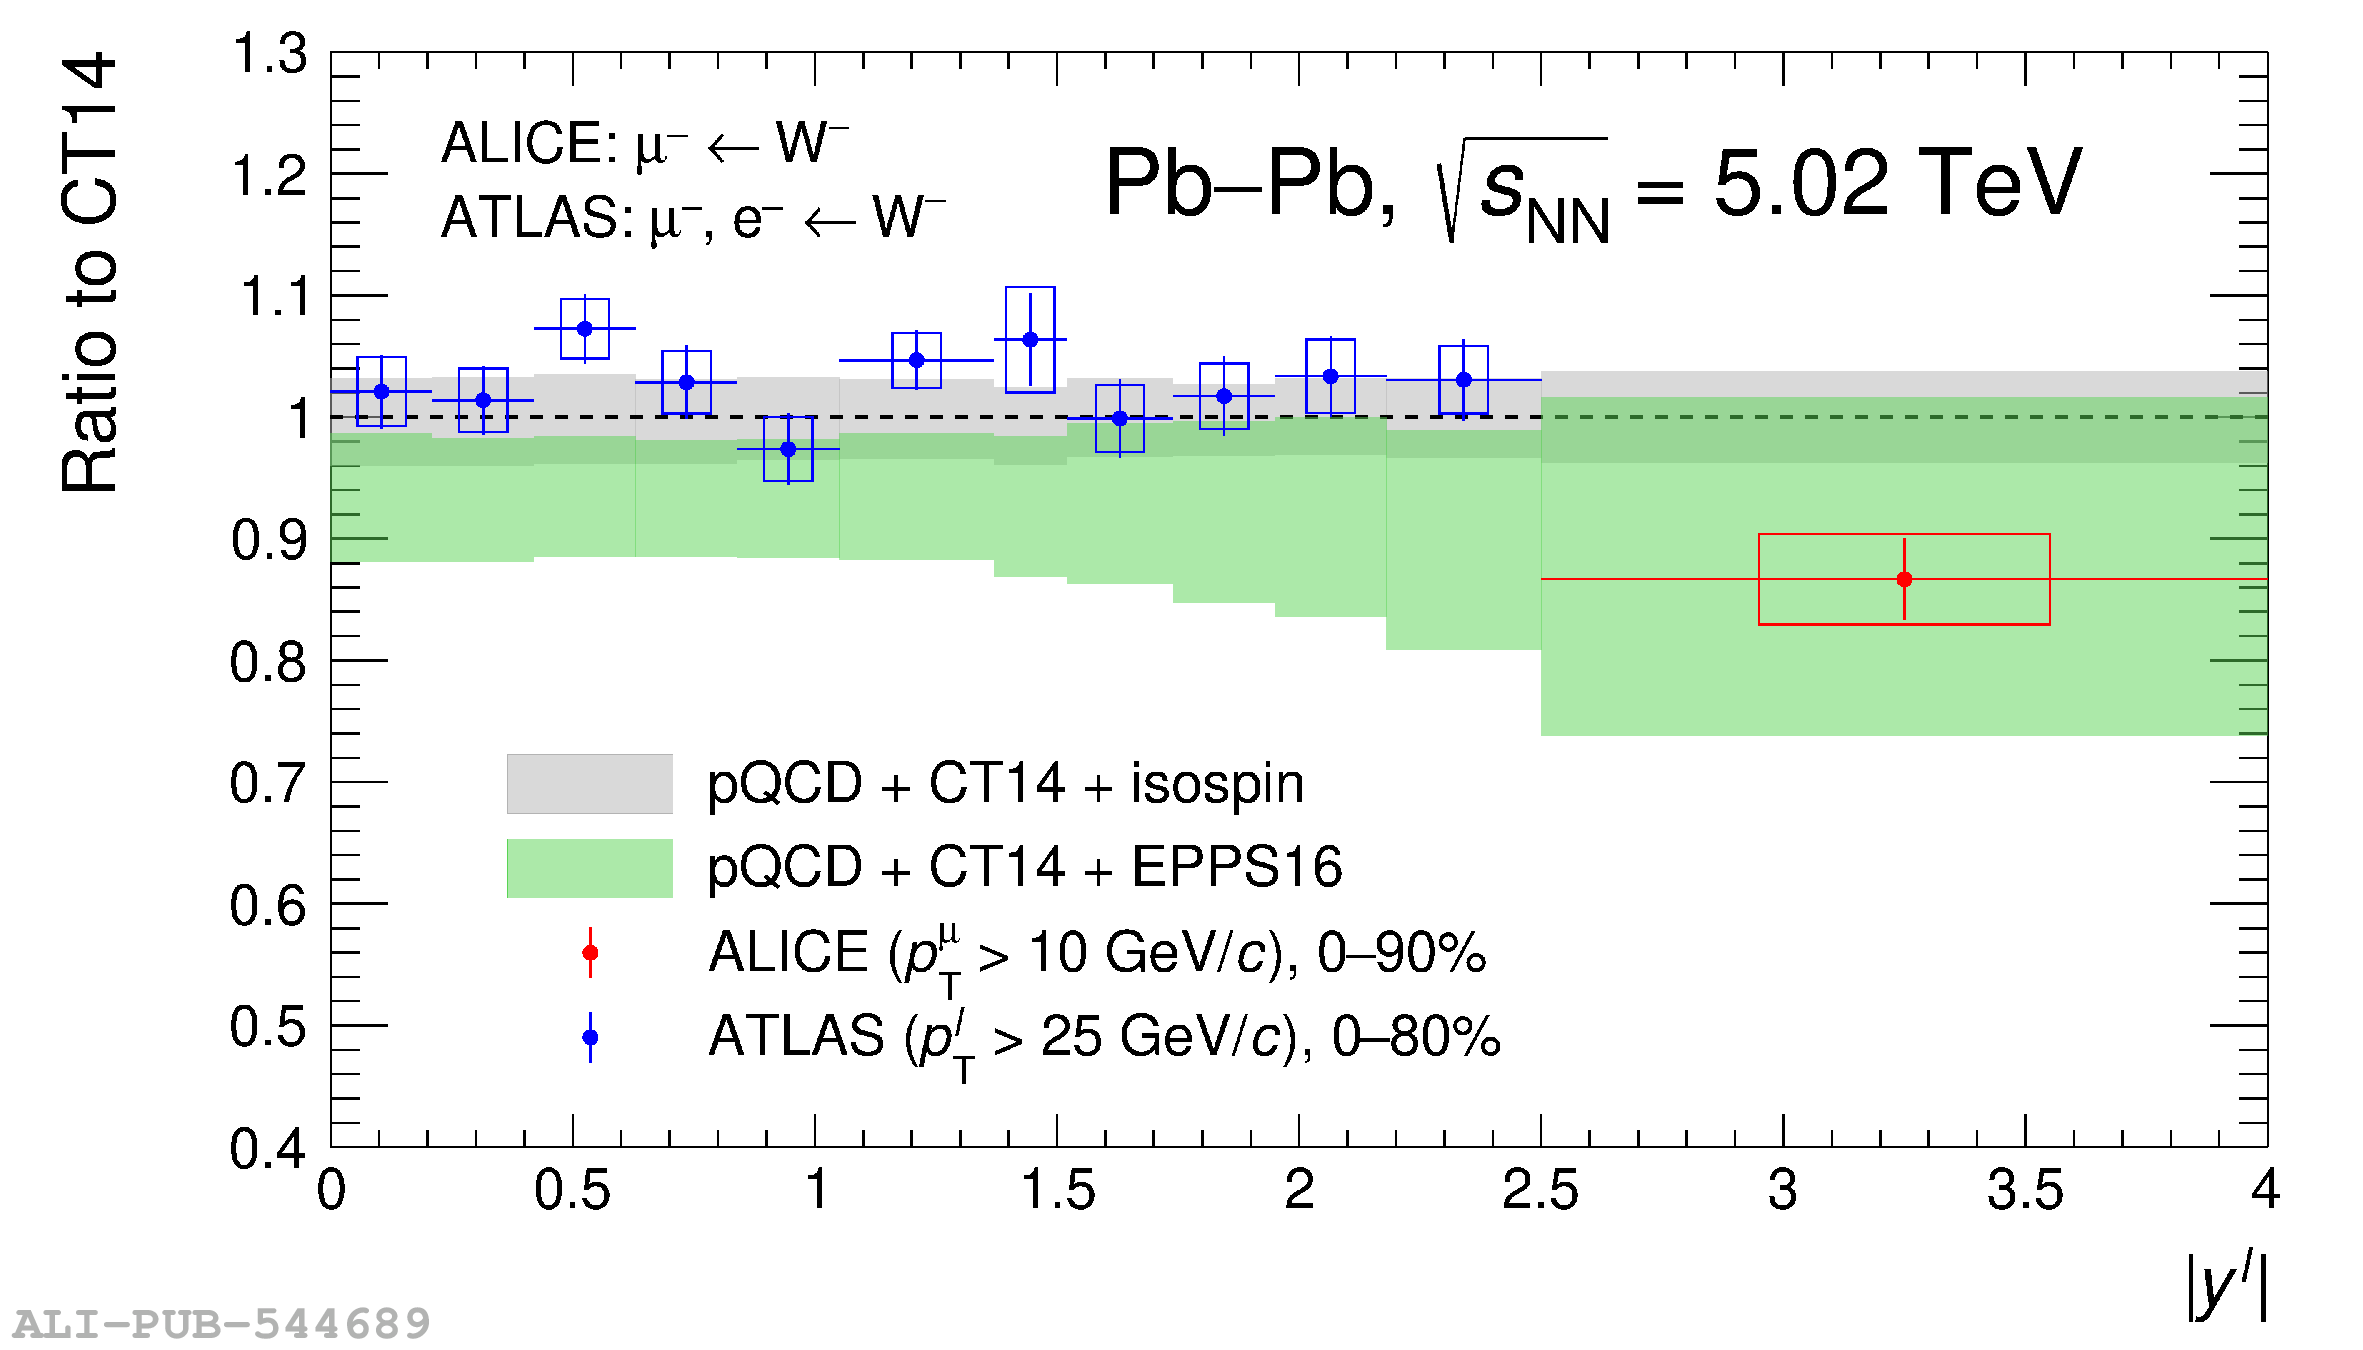 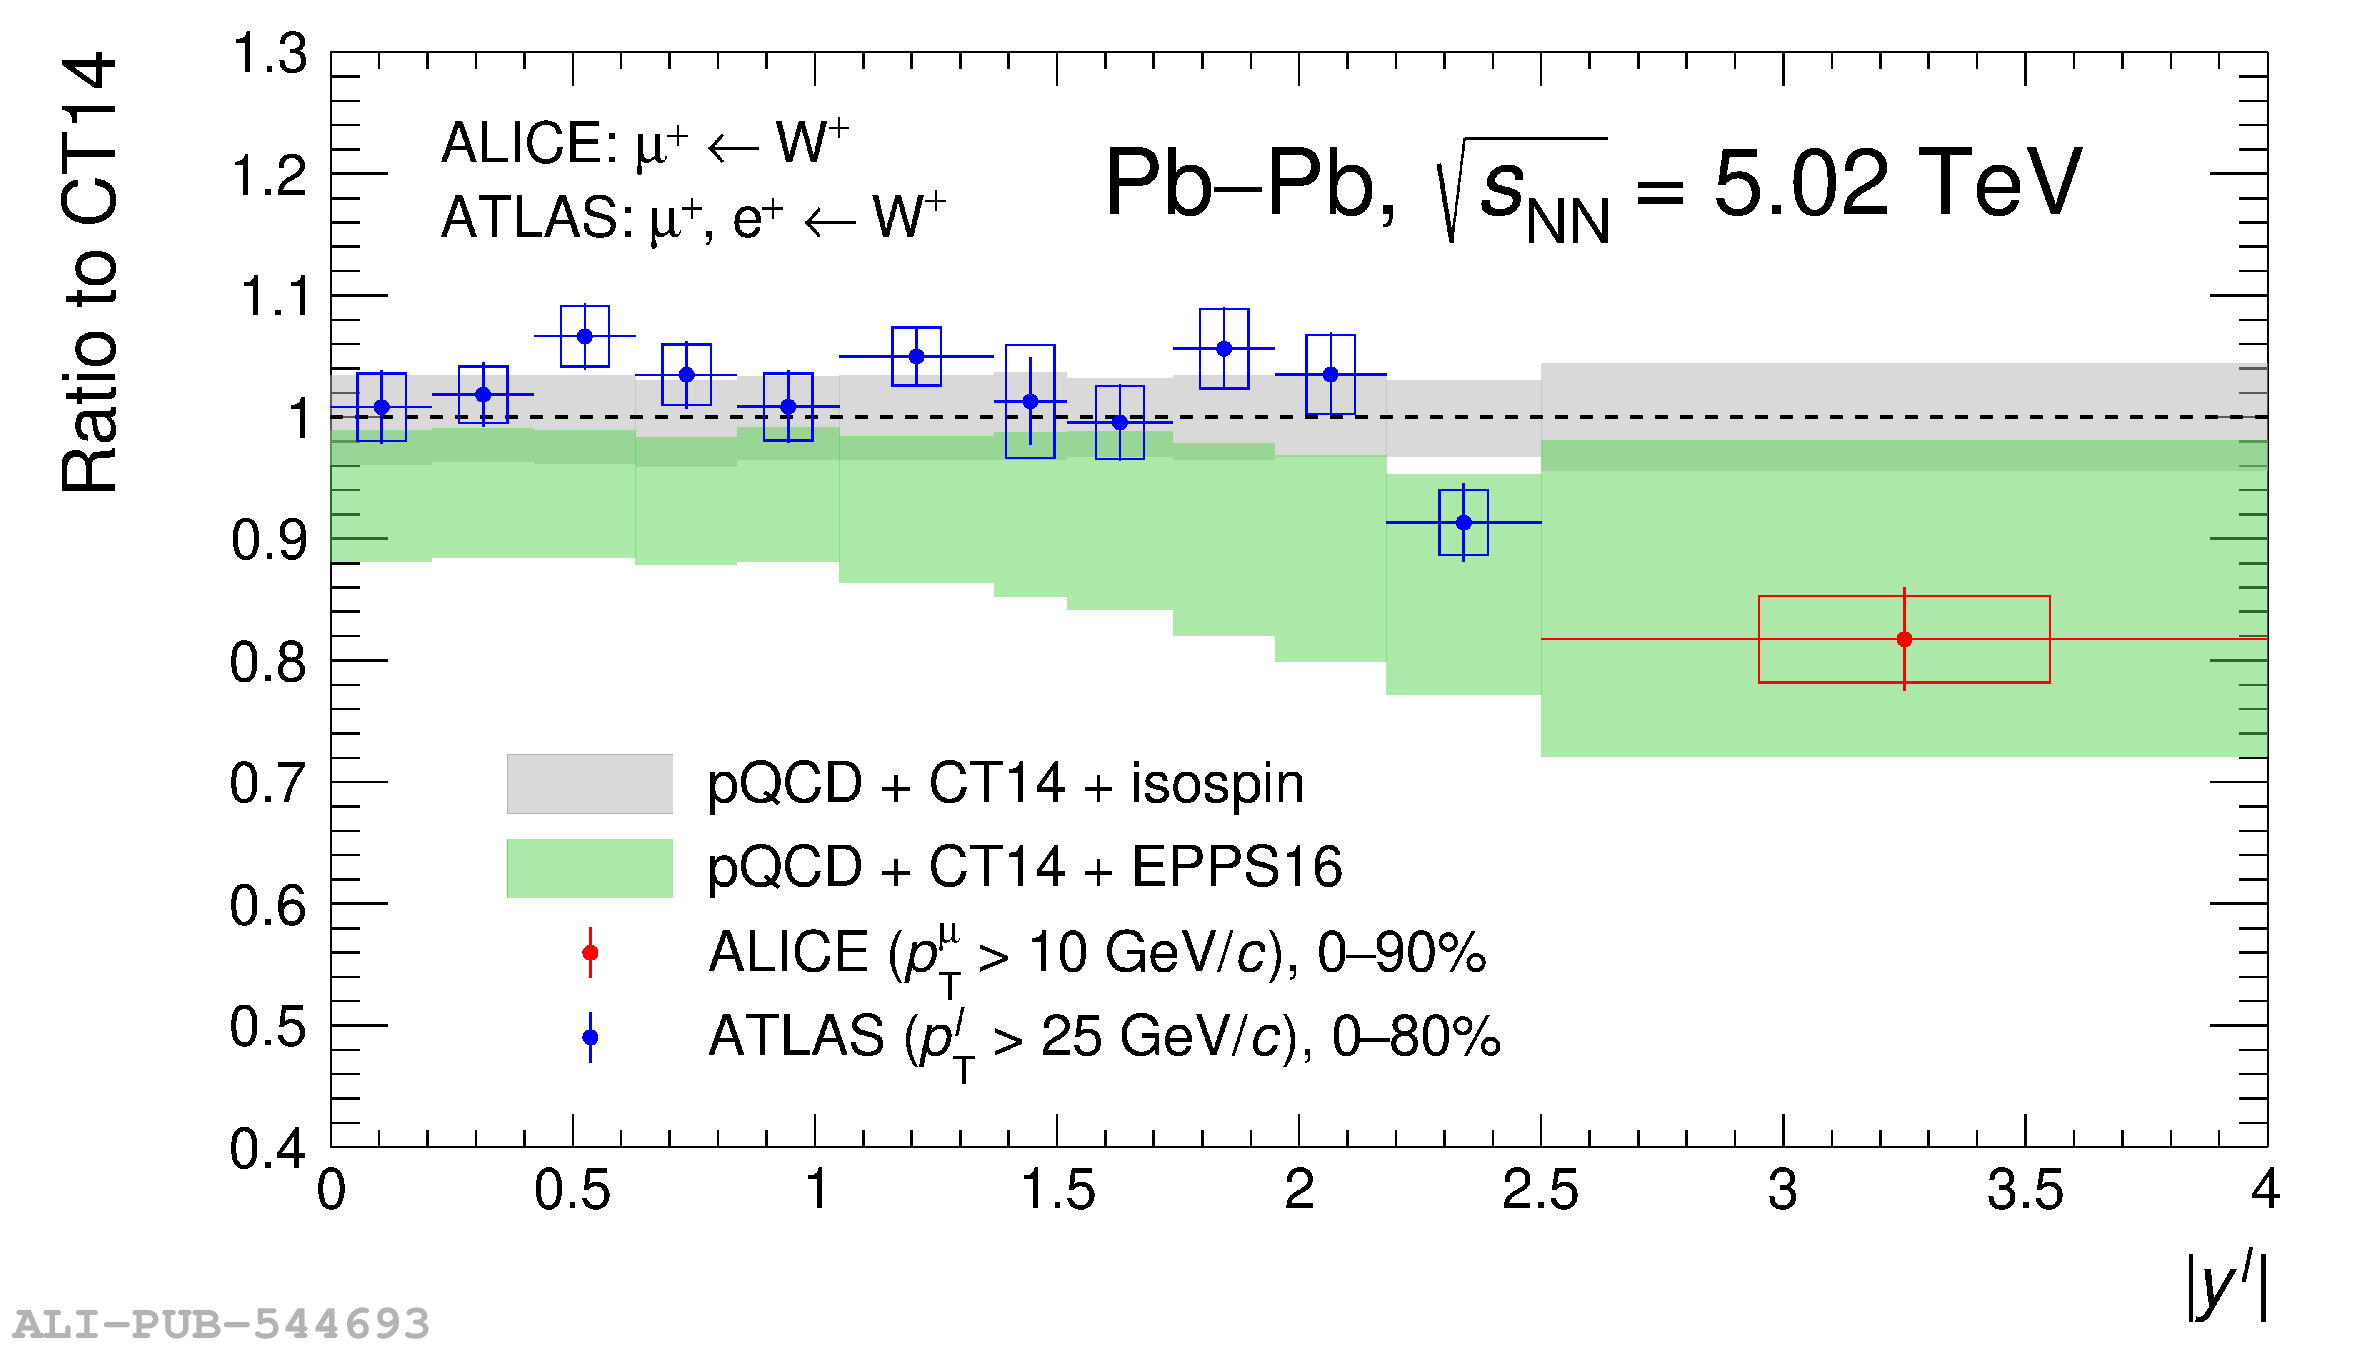 |
Figure 12
Nuclear modification factor of muons from W$^-$ (top) and W$^+$ (bottom) decays in Pb-Pb collisions at $\sqrt{s_{\rm NN}}=5.02$ TeV, for muons with $\pt^\mu > 10$ GeV/$c$ and $2.5 < y^\mu_{\rm cms} < 4.0$, in different centrality intervals (left panels) and for the 0--90\% range (right panels). The centrality-dependent distributions are compared with the dashed curve, corresponding to the HG-PYTHIA model scaled with the measured $R_{\rm AA}$ in the 0--90\% centrality interval. The centrality-averaged measurement is compared with CT14+nCTEQ15WZ and NNPDF3.1+nNNPDF2.0 calculations. The horizontal bars indicate the width of the centrality bins, the vertical bars and boxes correspond the statistical and systematic uncertainties on the Pb-Pb measurement, respectively. The grey boxes indicate the uncertainty on the pp reference cross section. | 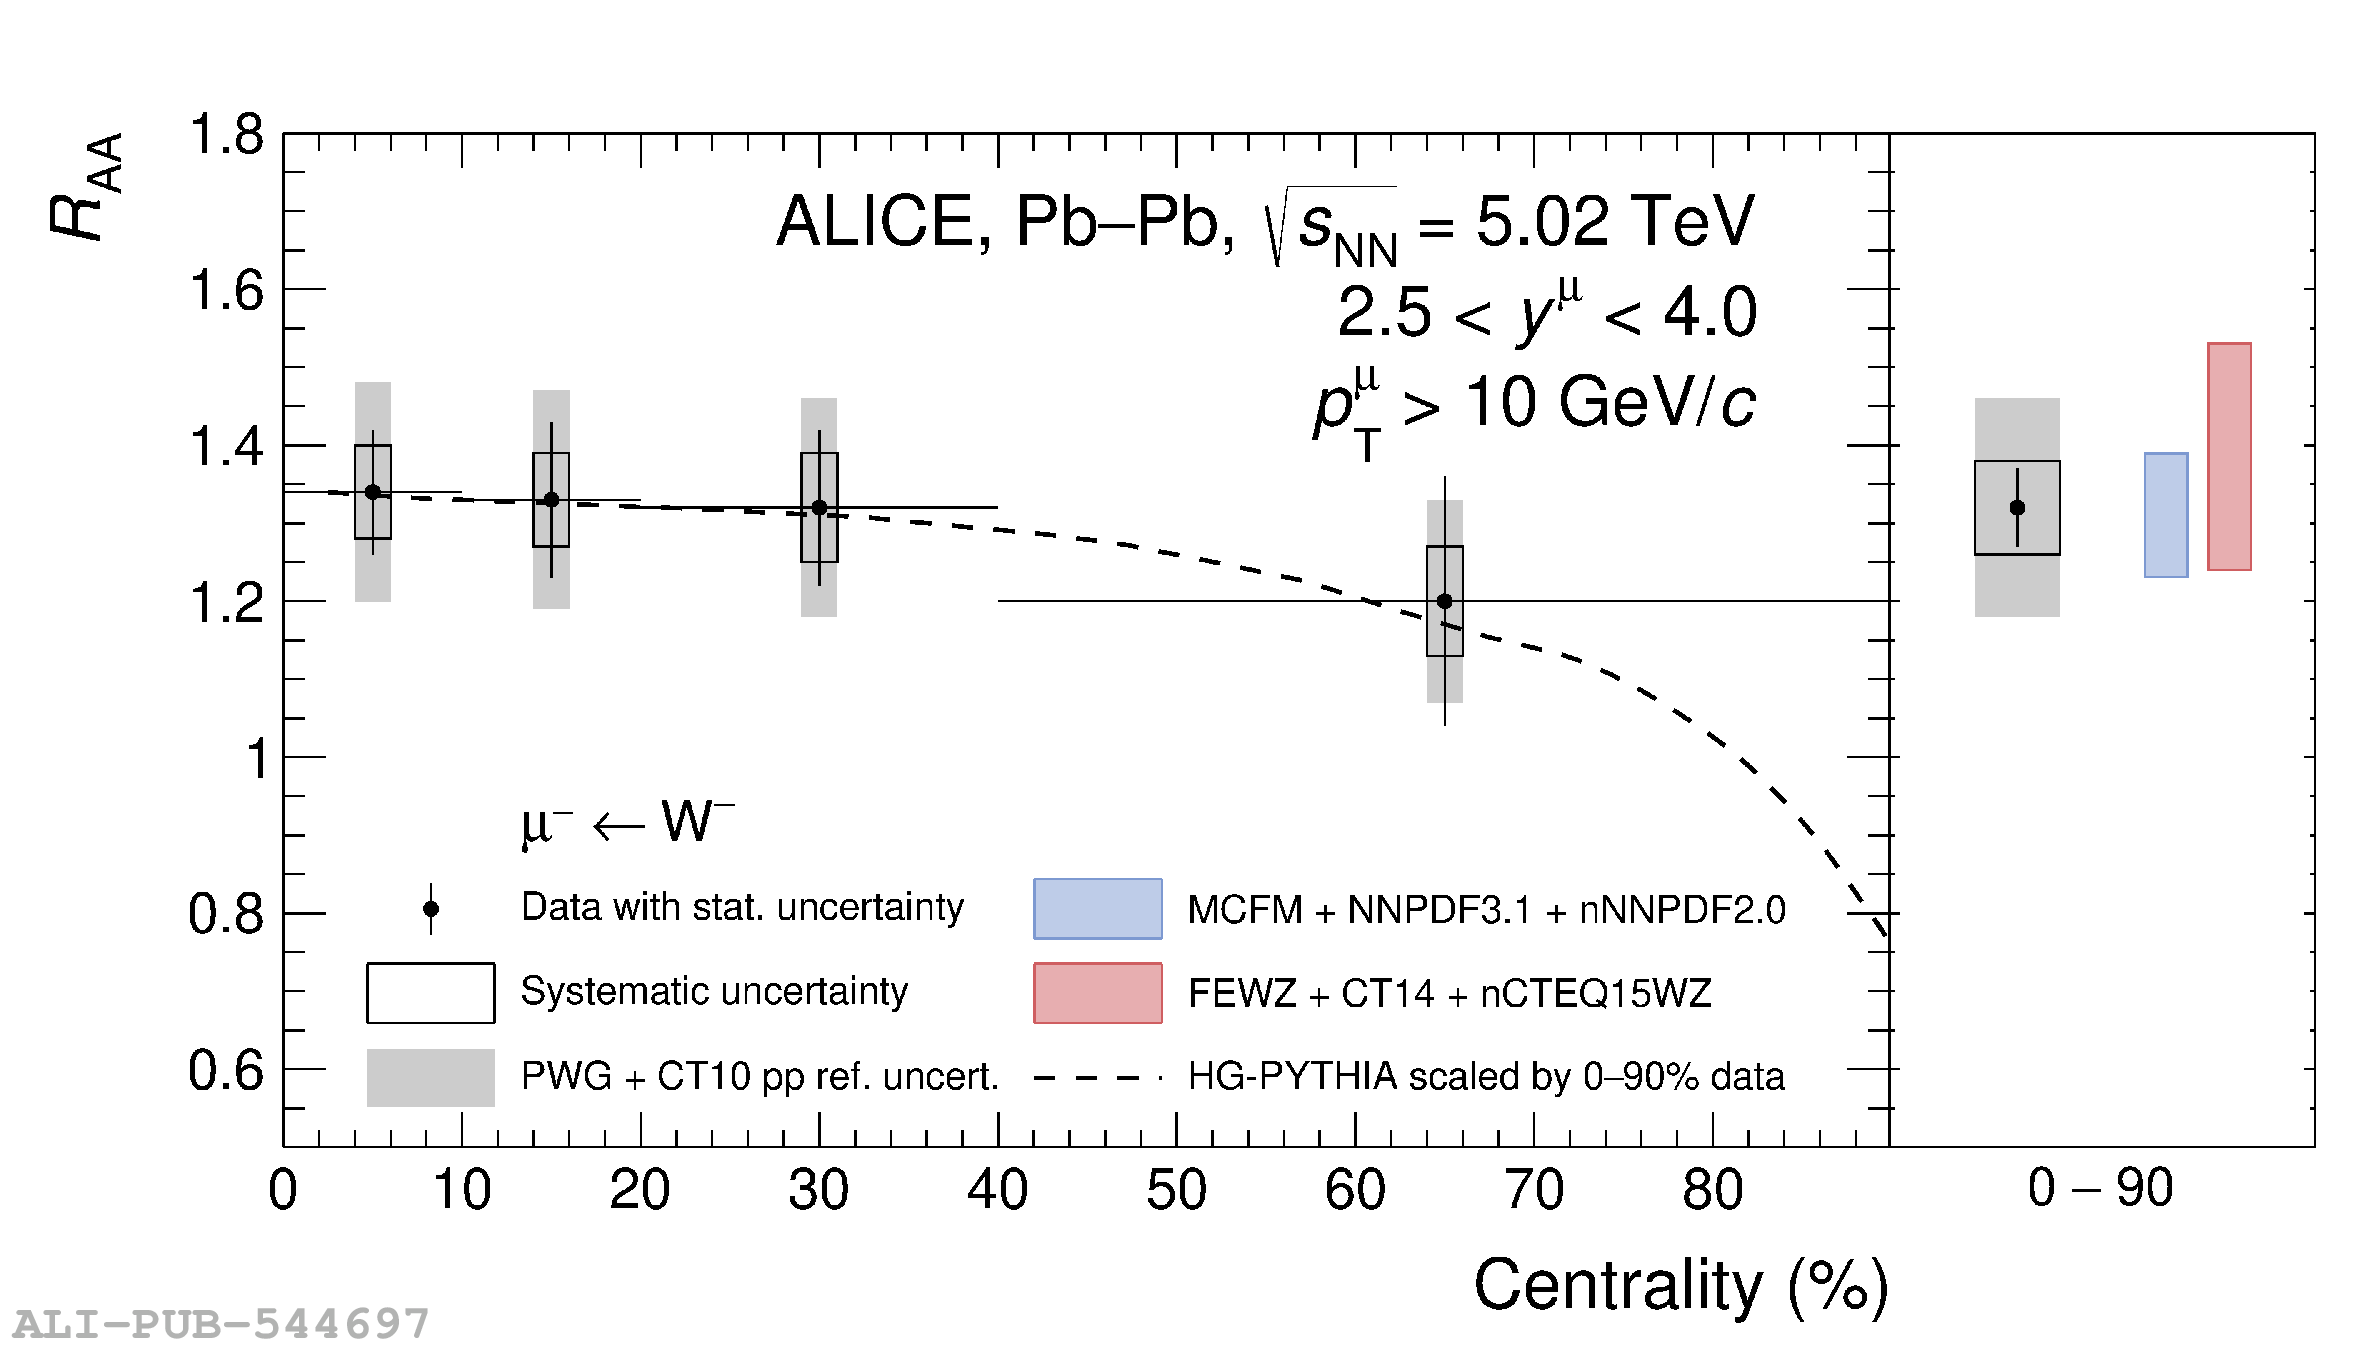 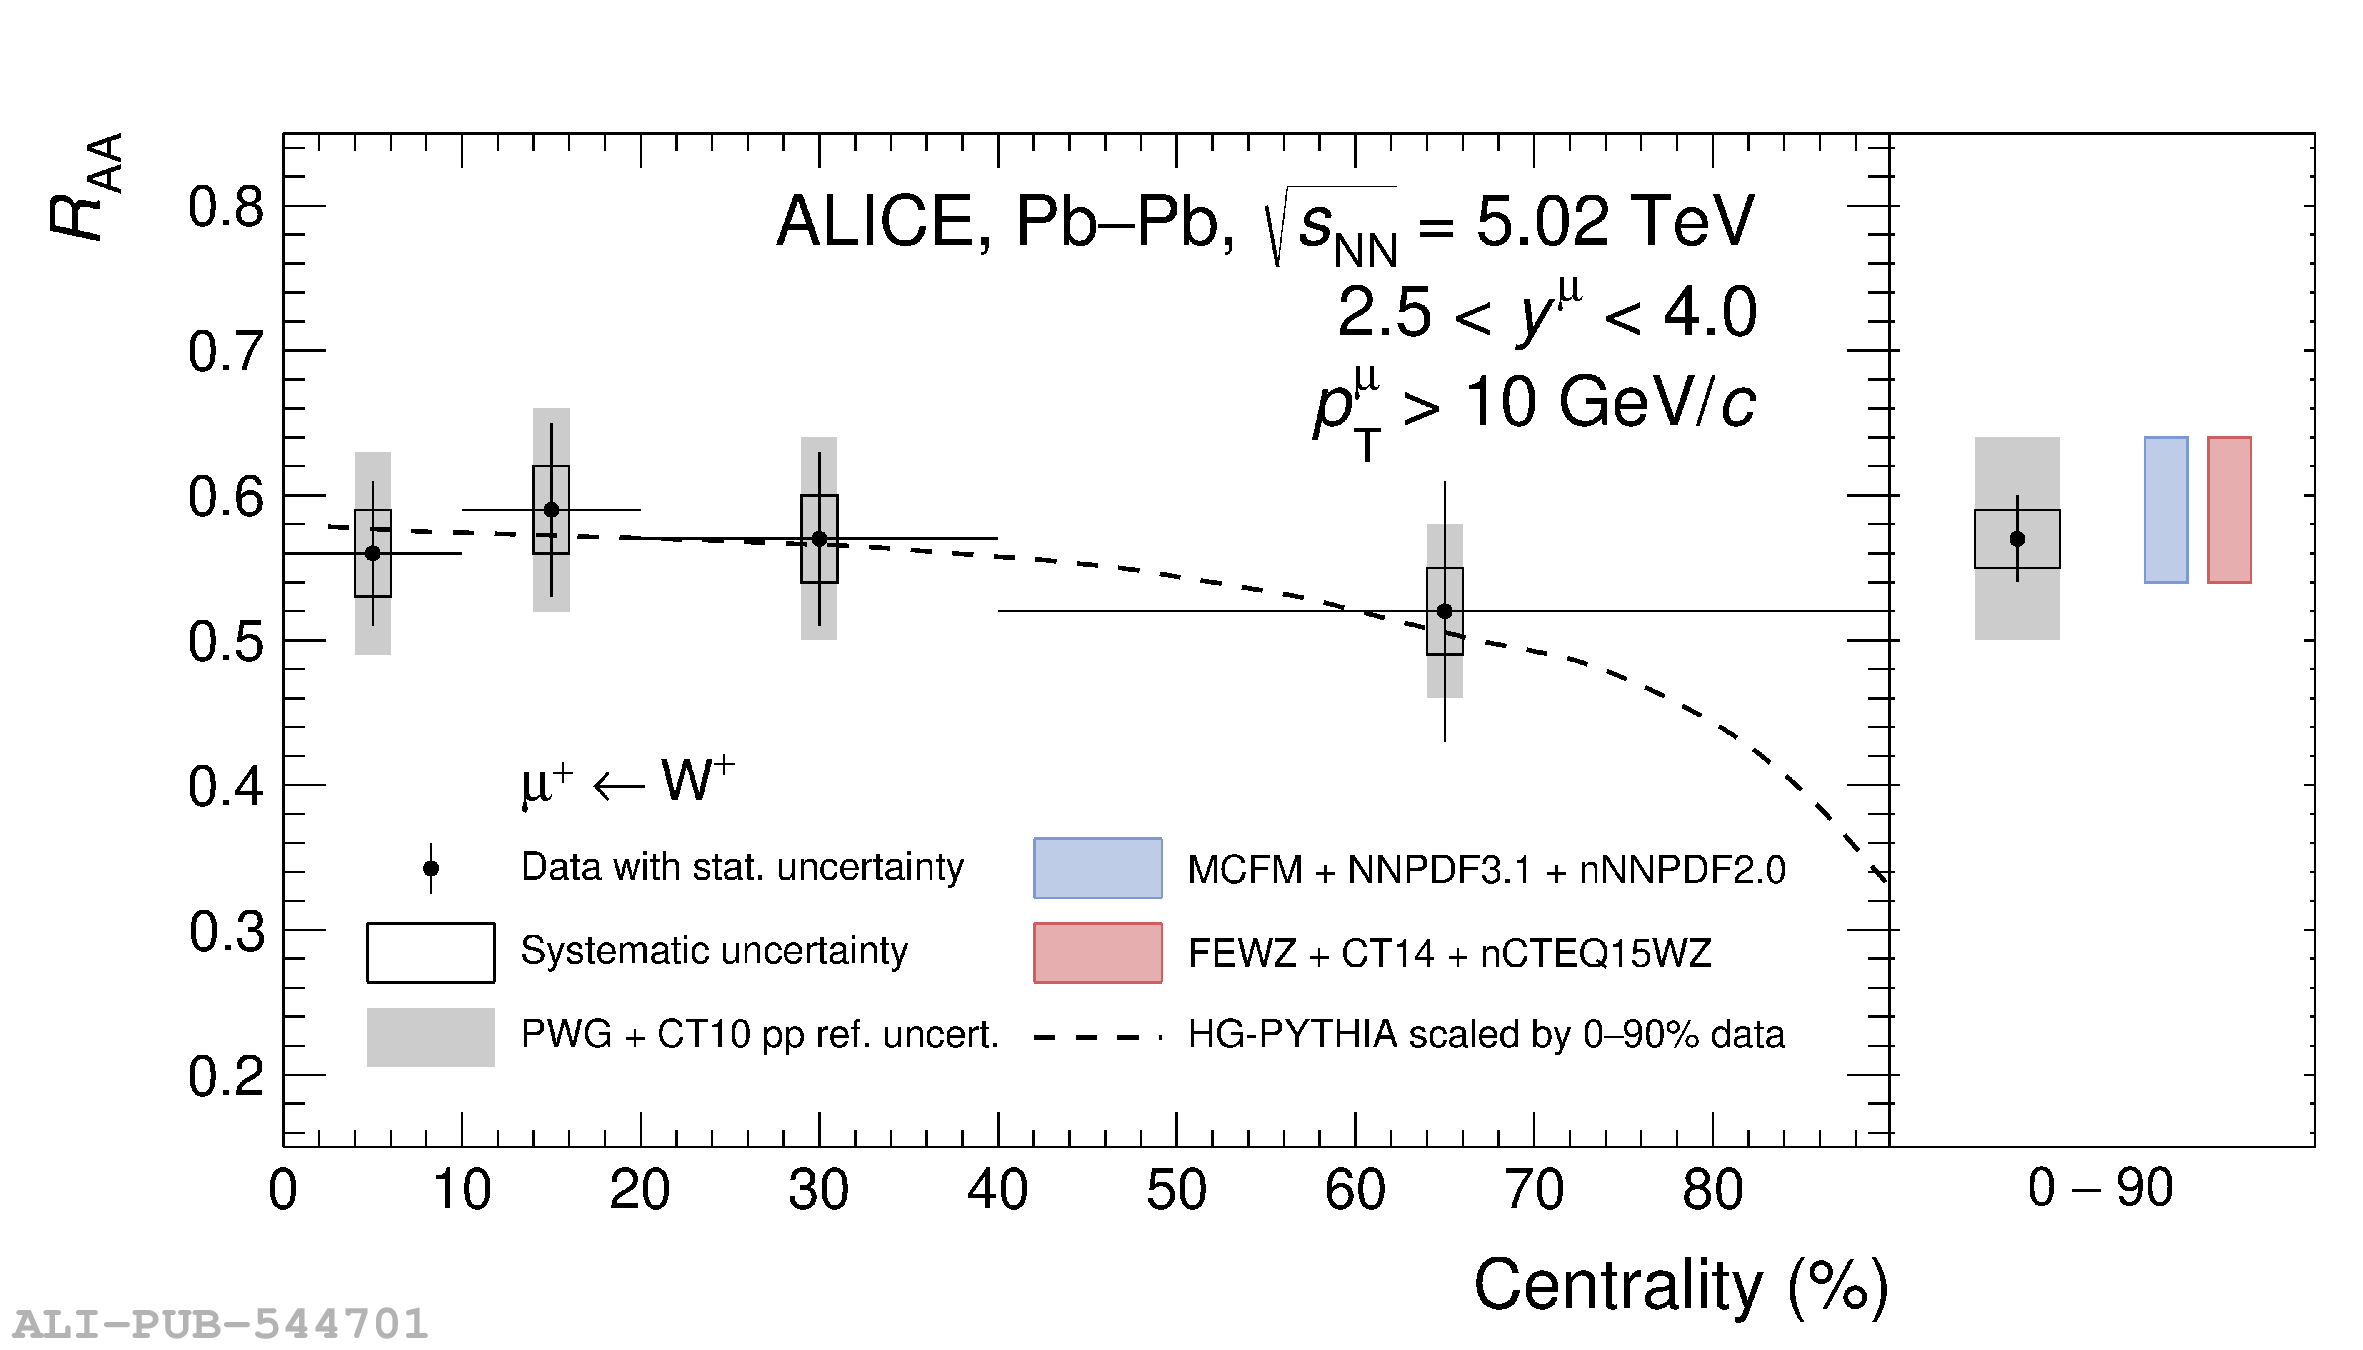 |