Nuclear modification factor of muons from W$^-$ (top) and W$^+$ (bottom) decays in Pb-Pb collisions at $\sqrt{s_{\rm NN}}=5.02$ TeV, for muons with $\pt^\mu > 10$ GeV/$c$ and $2.5 < y^\mu_{\rm cms} < 4.0$, in different centrality intervals (left panels) and for the 0--90\% range (right panels). The centrality-dependent distributions are compared with the dashed curve, corresponding to the HG-PYTHIA model scaled with the measured $R_{\rm AA}$ in the 0--90\% centrality interval. The centrality-averaged measurement is compared with CT14+nCTEQ15WZ and NNPDF3.1+nNNPDF2.0 calculations. The horizontal bars indicate the width of the centrality bins, the vertical bars and boxes correspond the statistical and systematic uncertainties on the Pb-Pb measurement, respectively. The grey boxes indicate the uncertainty on the pp reference cross section. | 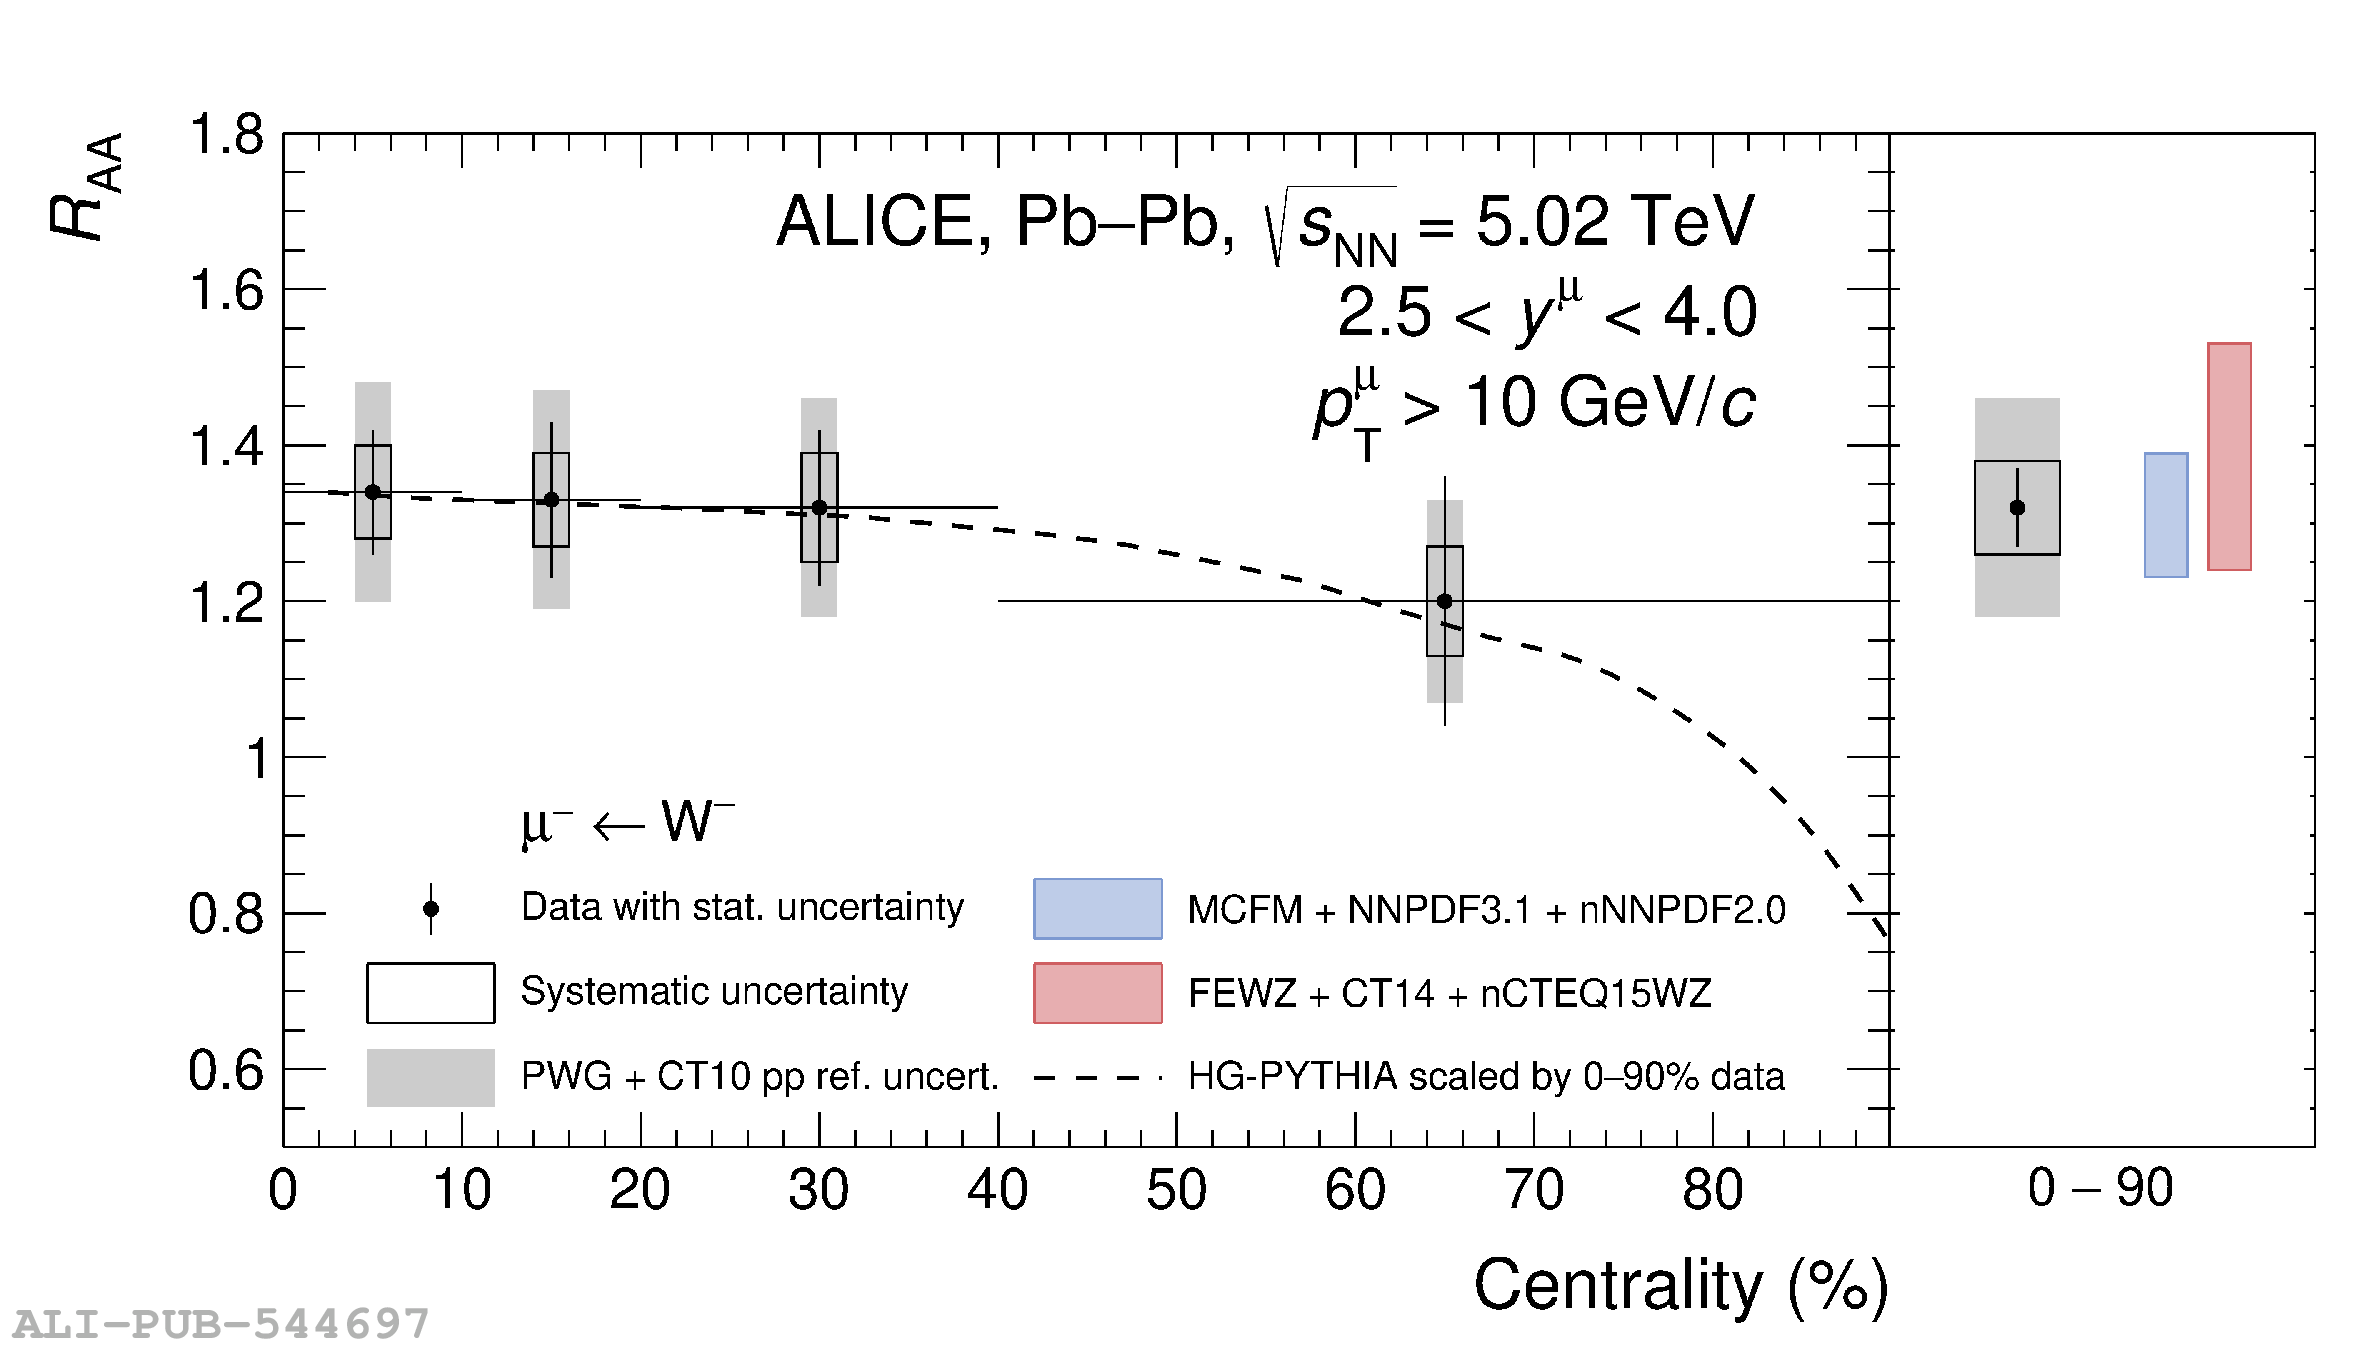 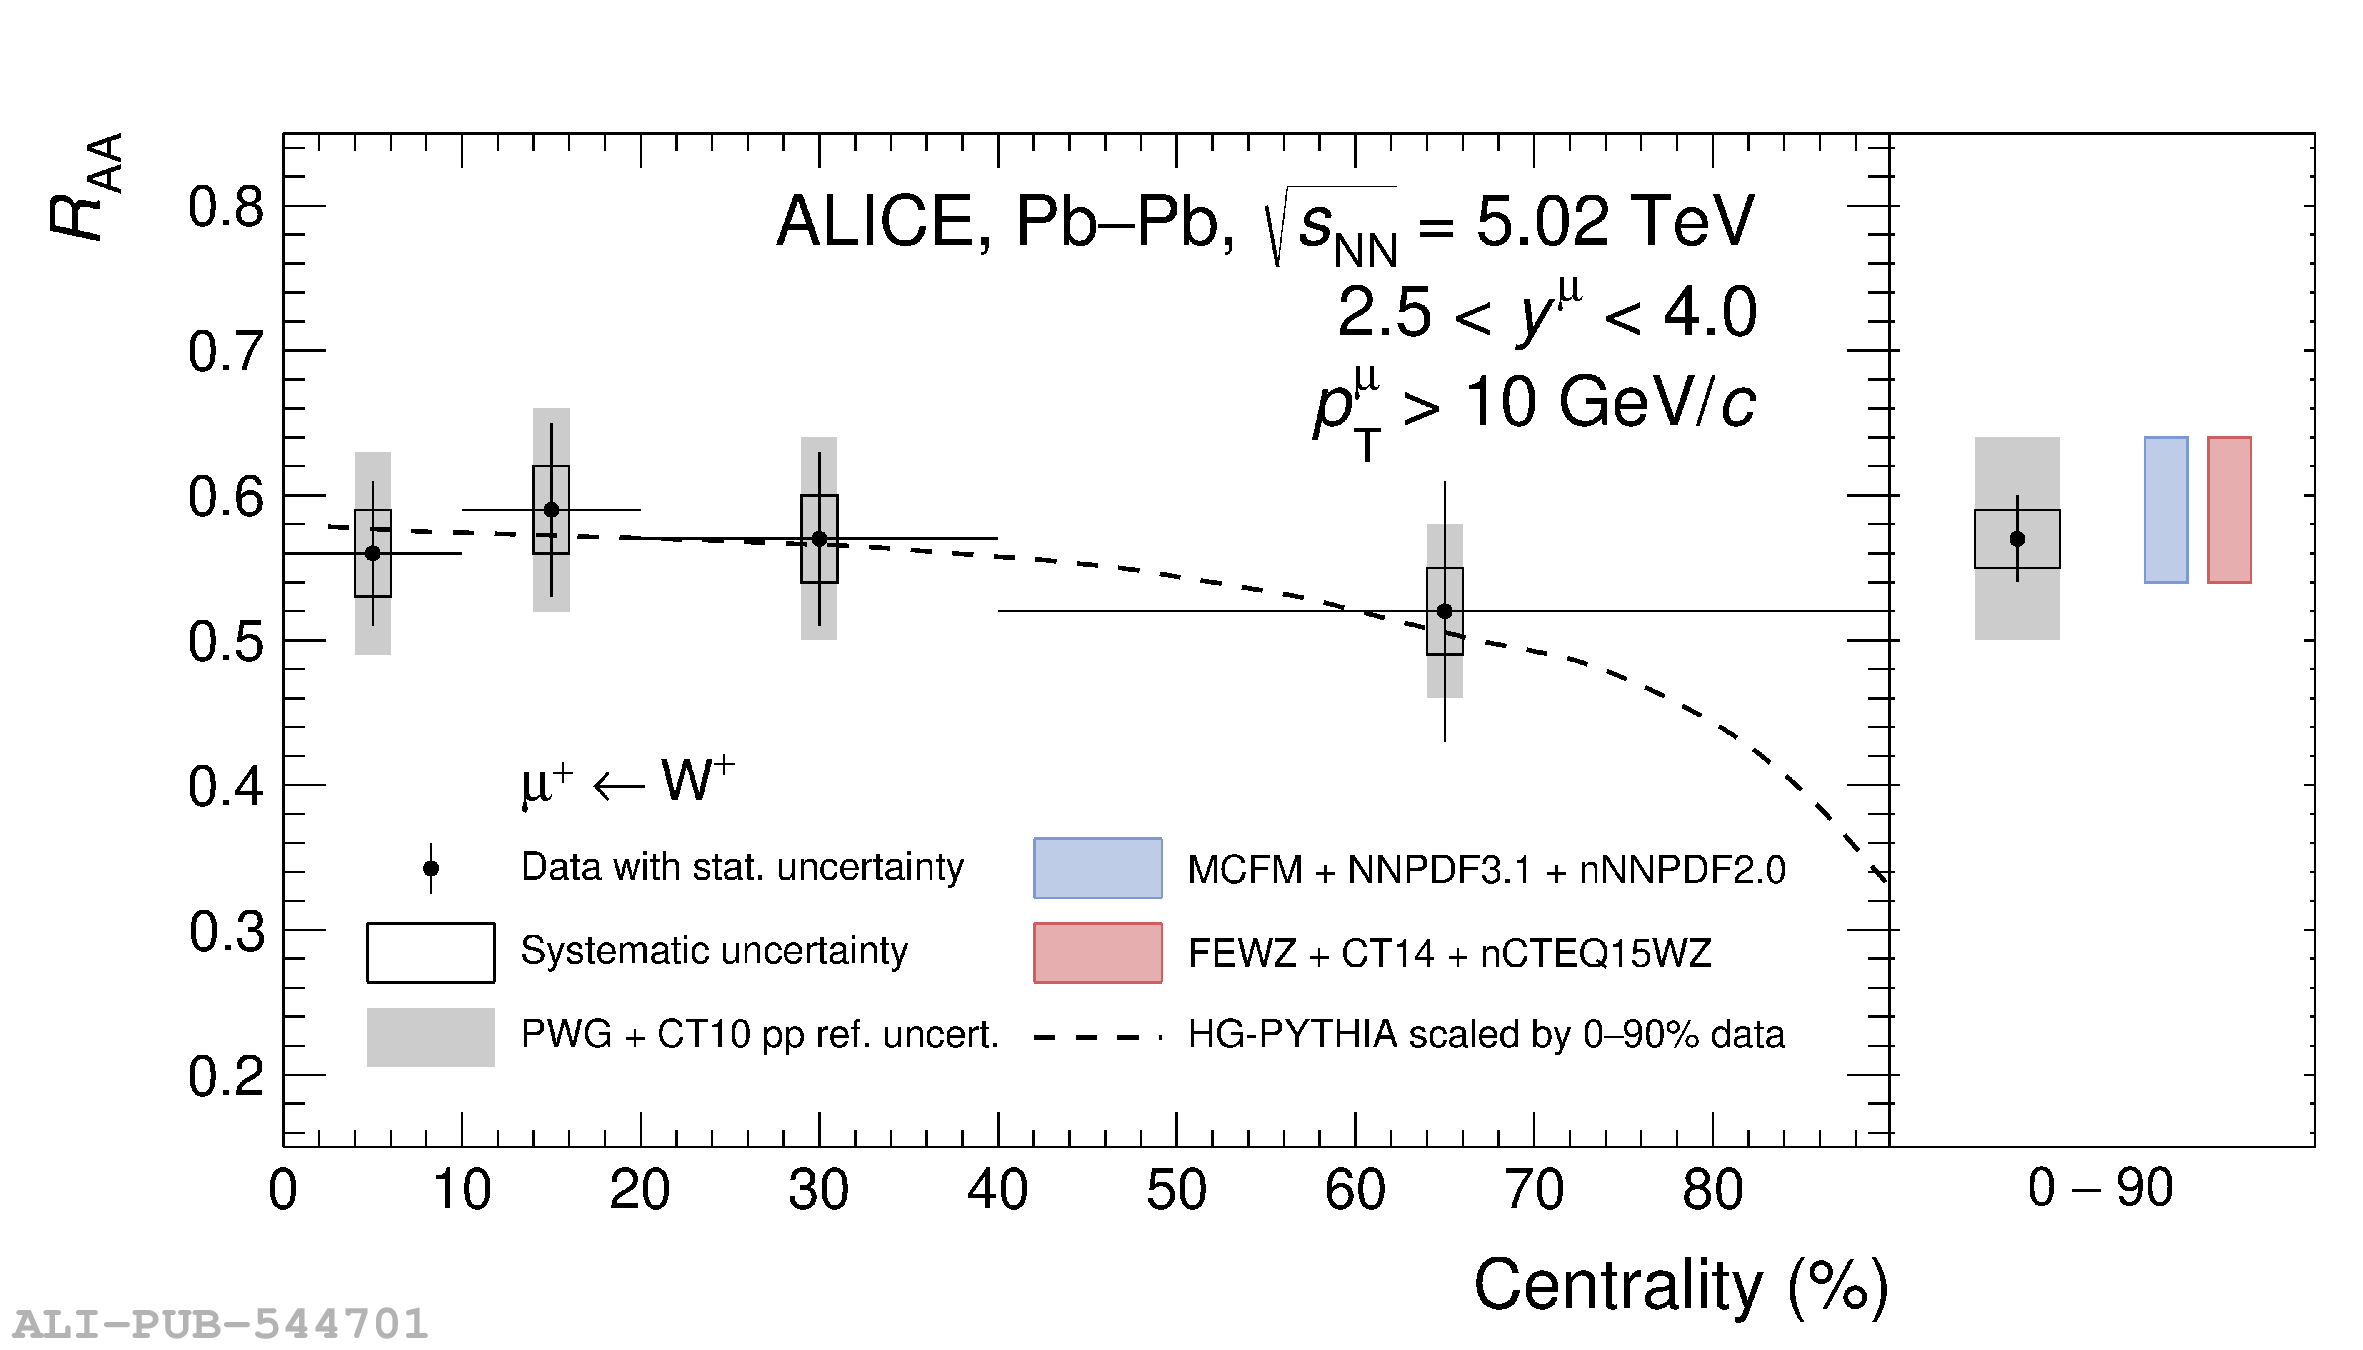 |