Inclusive transverse momentum distribution of negative (top) and positive (bottom) muons for the 0--90\% (left) and 0--10\% (right) centrality intervals in Pb-Pb collisions at $\sqrt{s_{\rm NN}}=5.02$ TeV. The results of the fit to the inclusive spectrum using a combination of MC templates is shown as a continuous line, the green, pink and blue dashed lines representing the contributions of the W$^\pm$-, Z$^0$/$\gamma^*$- and heavy-flavour hadron decay muons, respectively. The bottom panels show the ratio of the data to the fit result. | 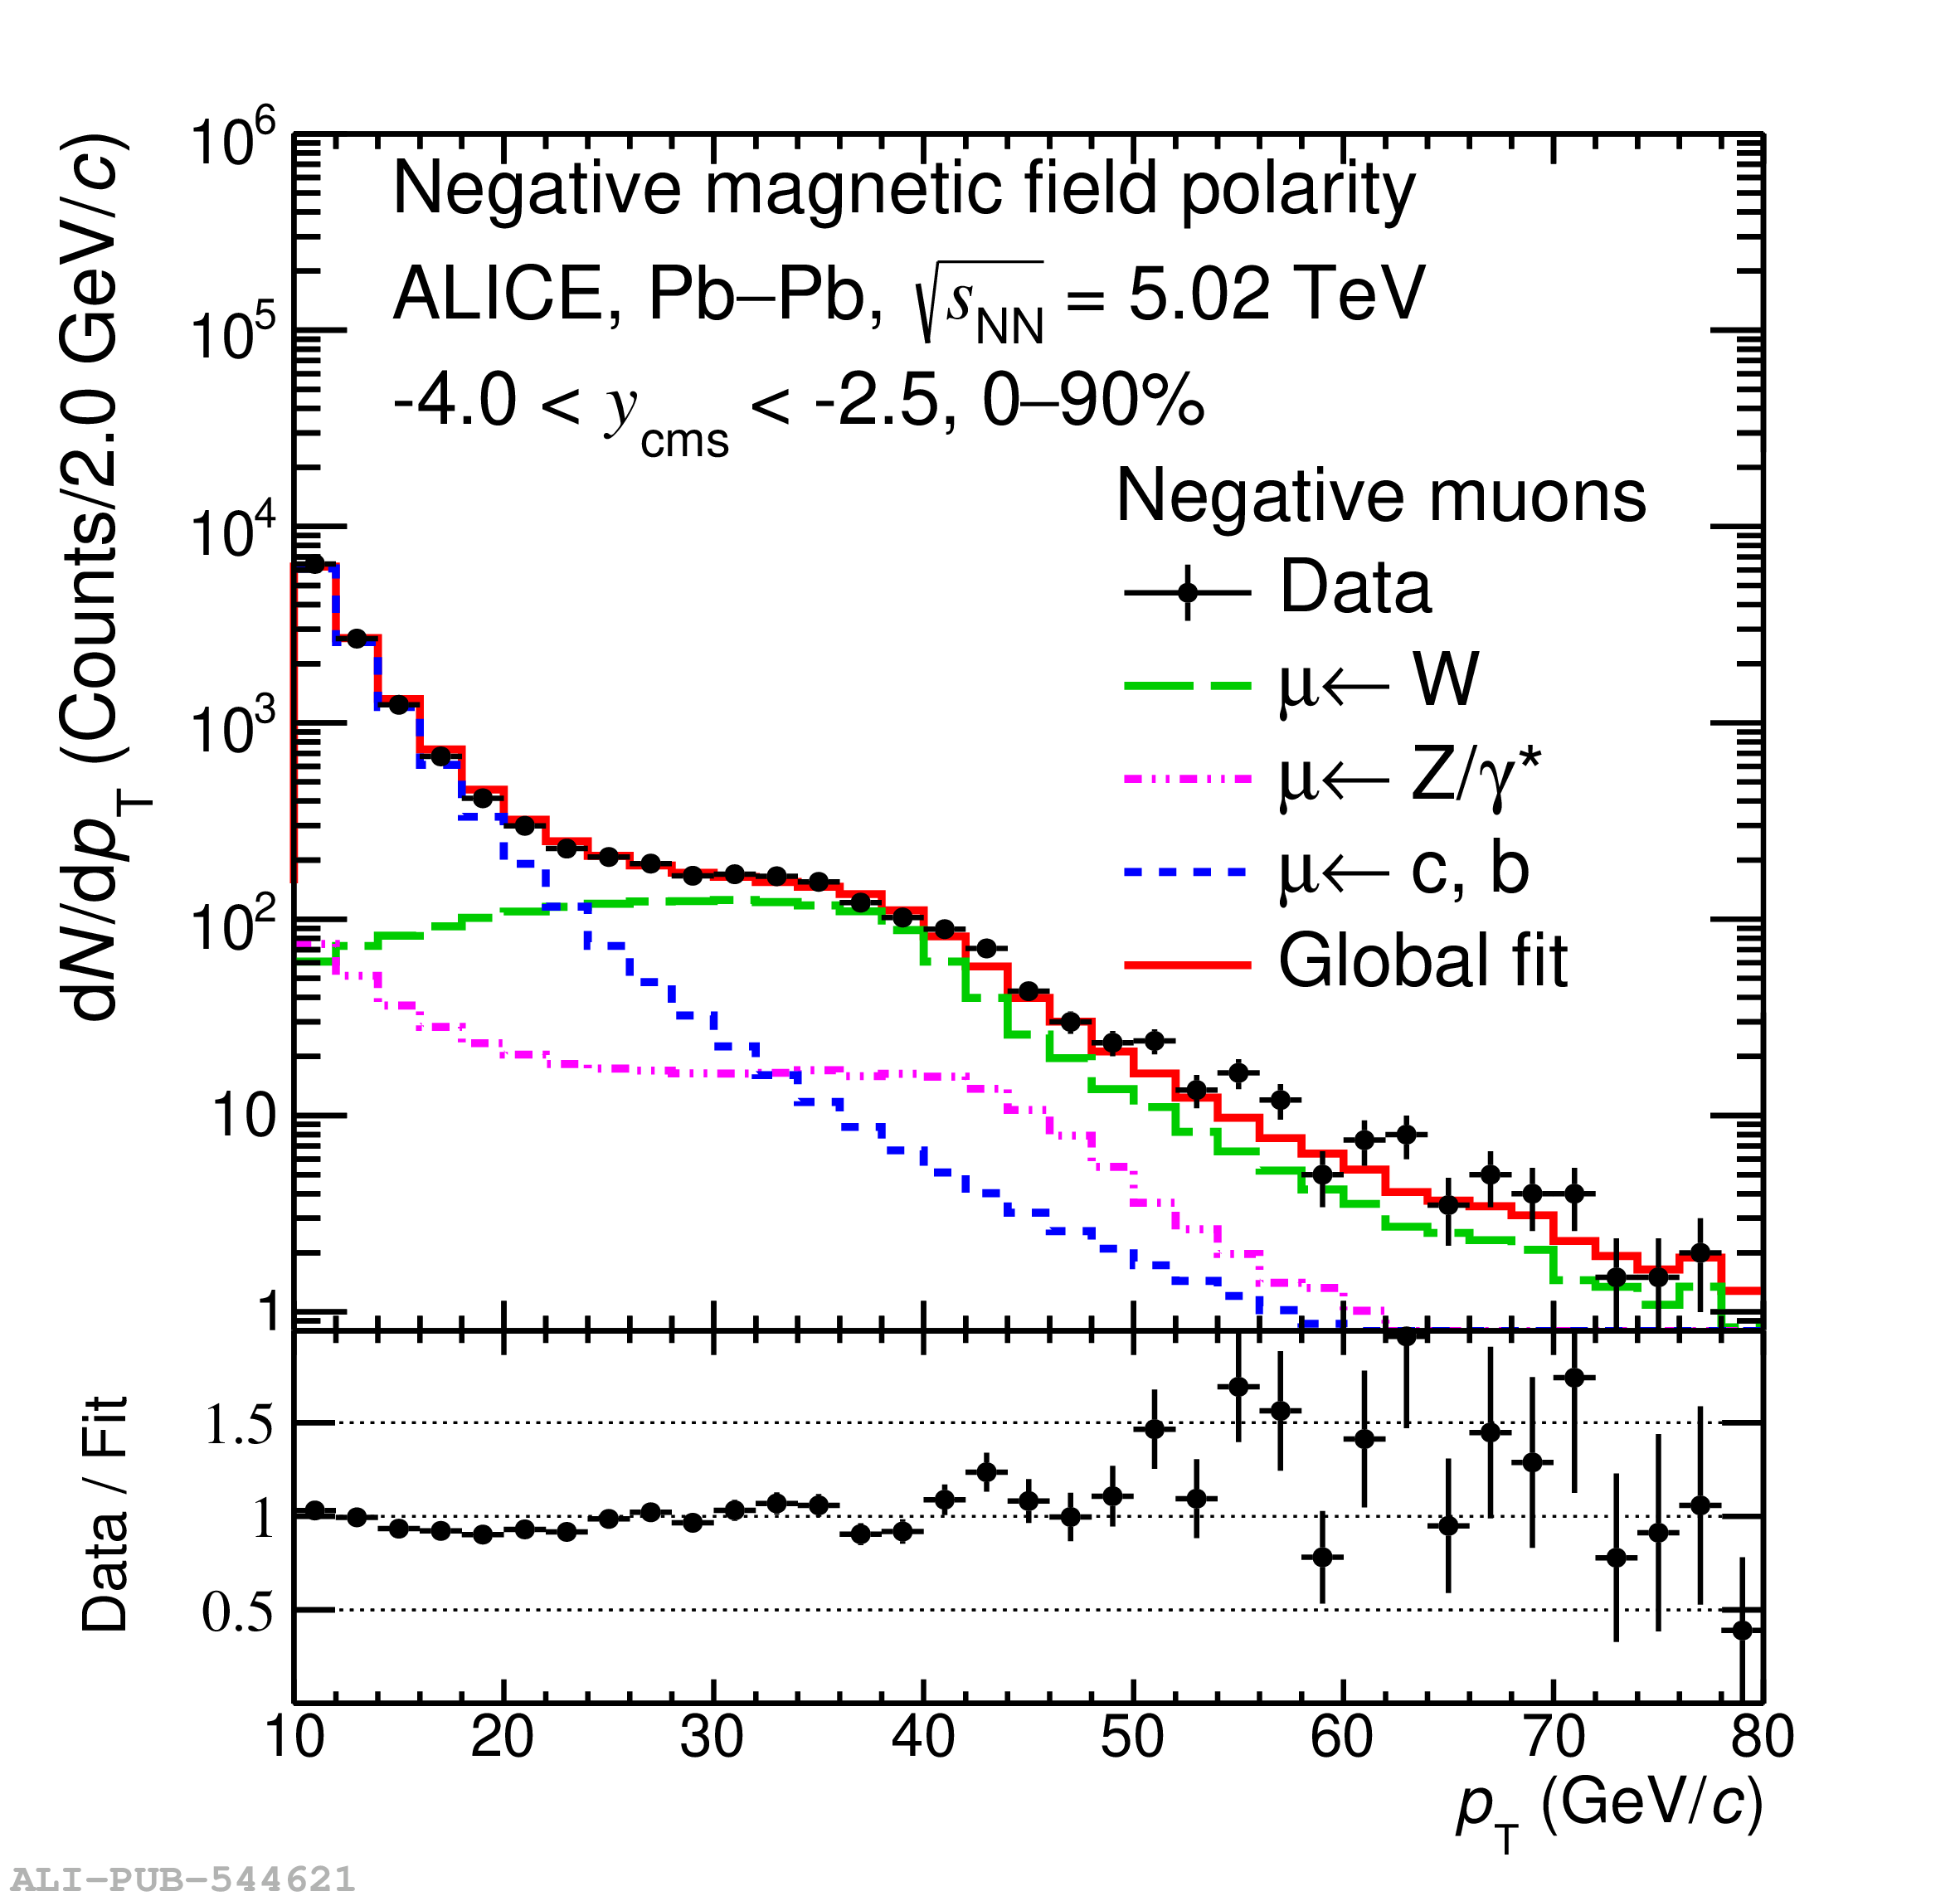 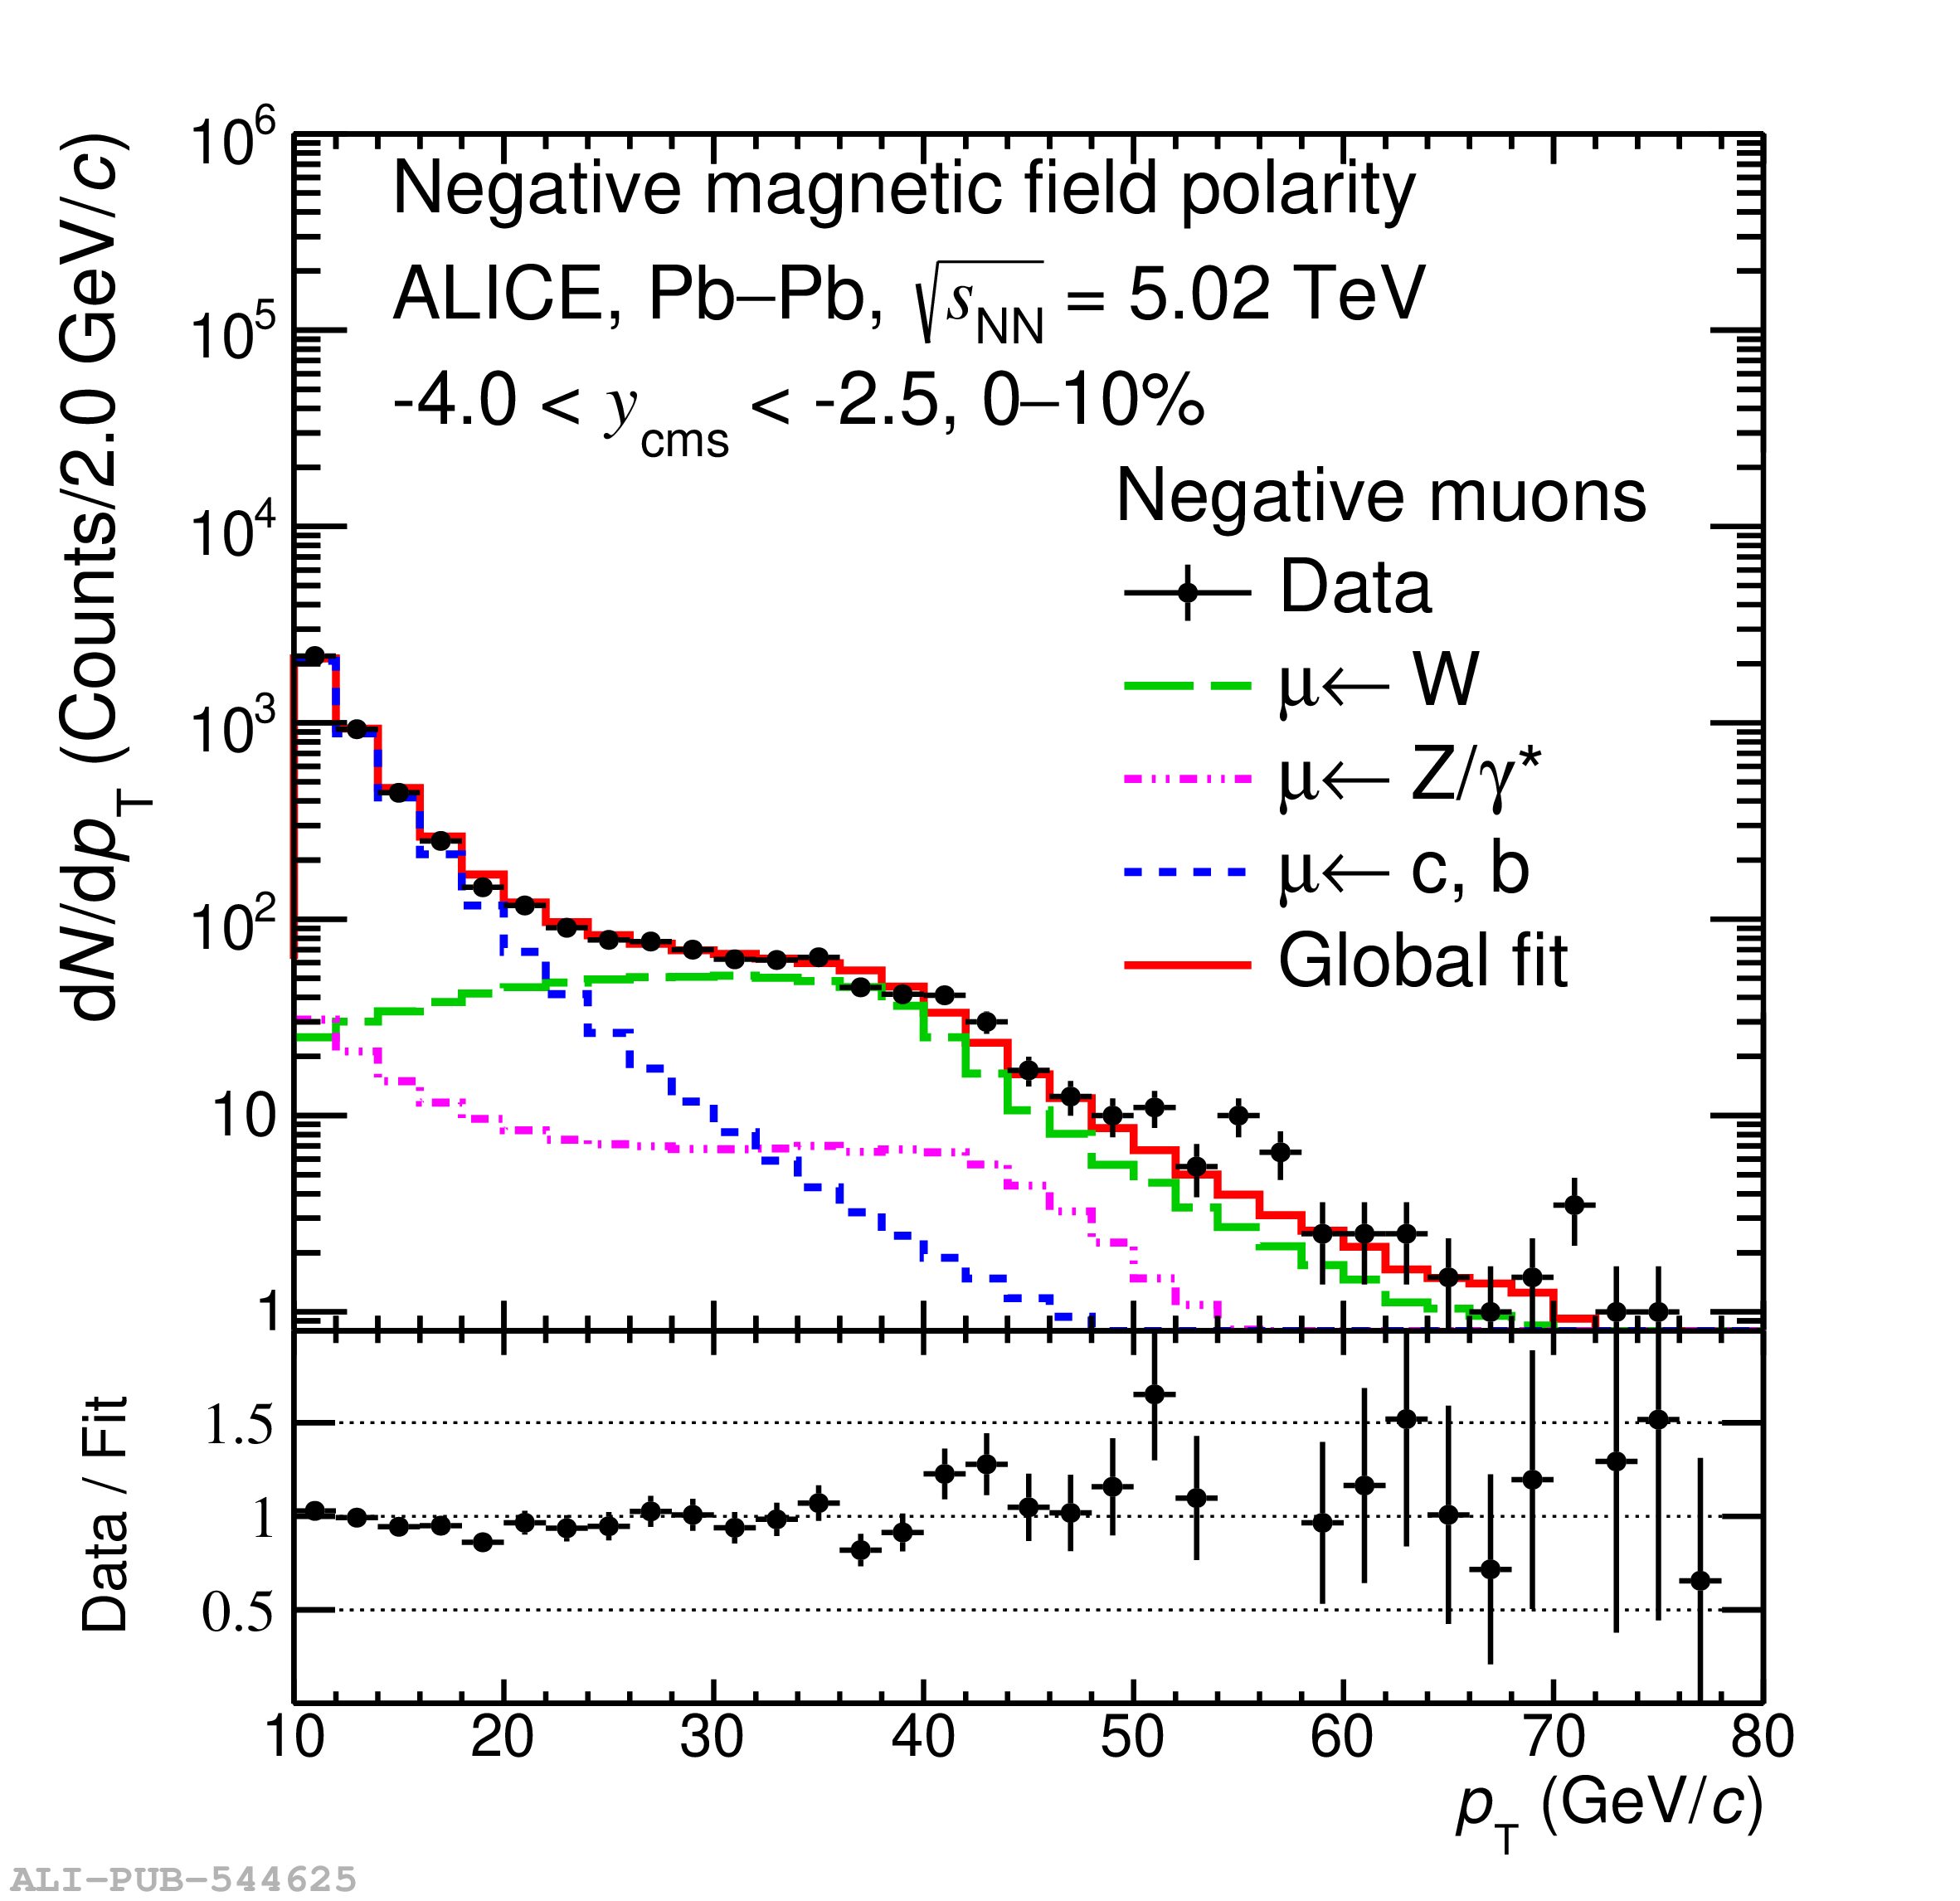 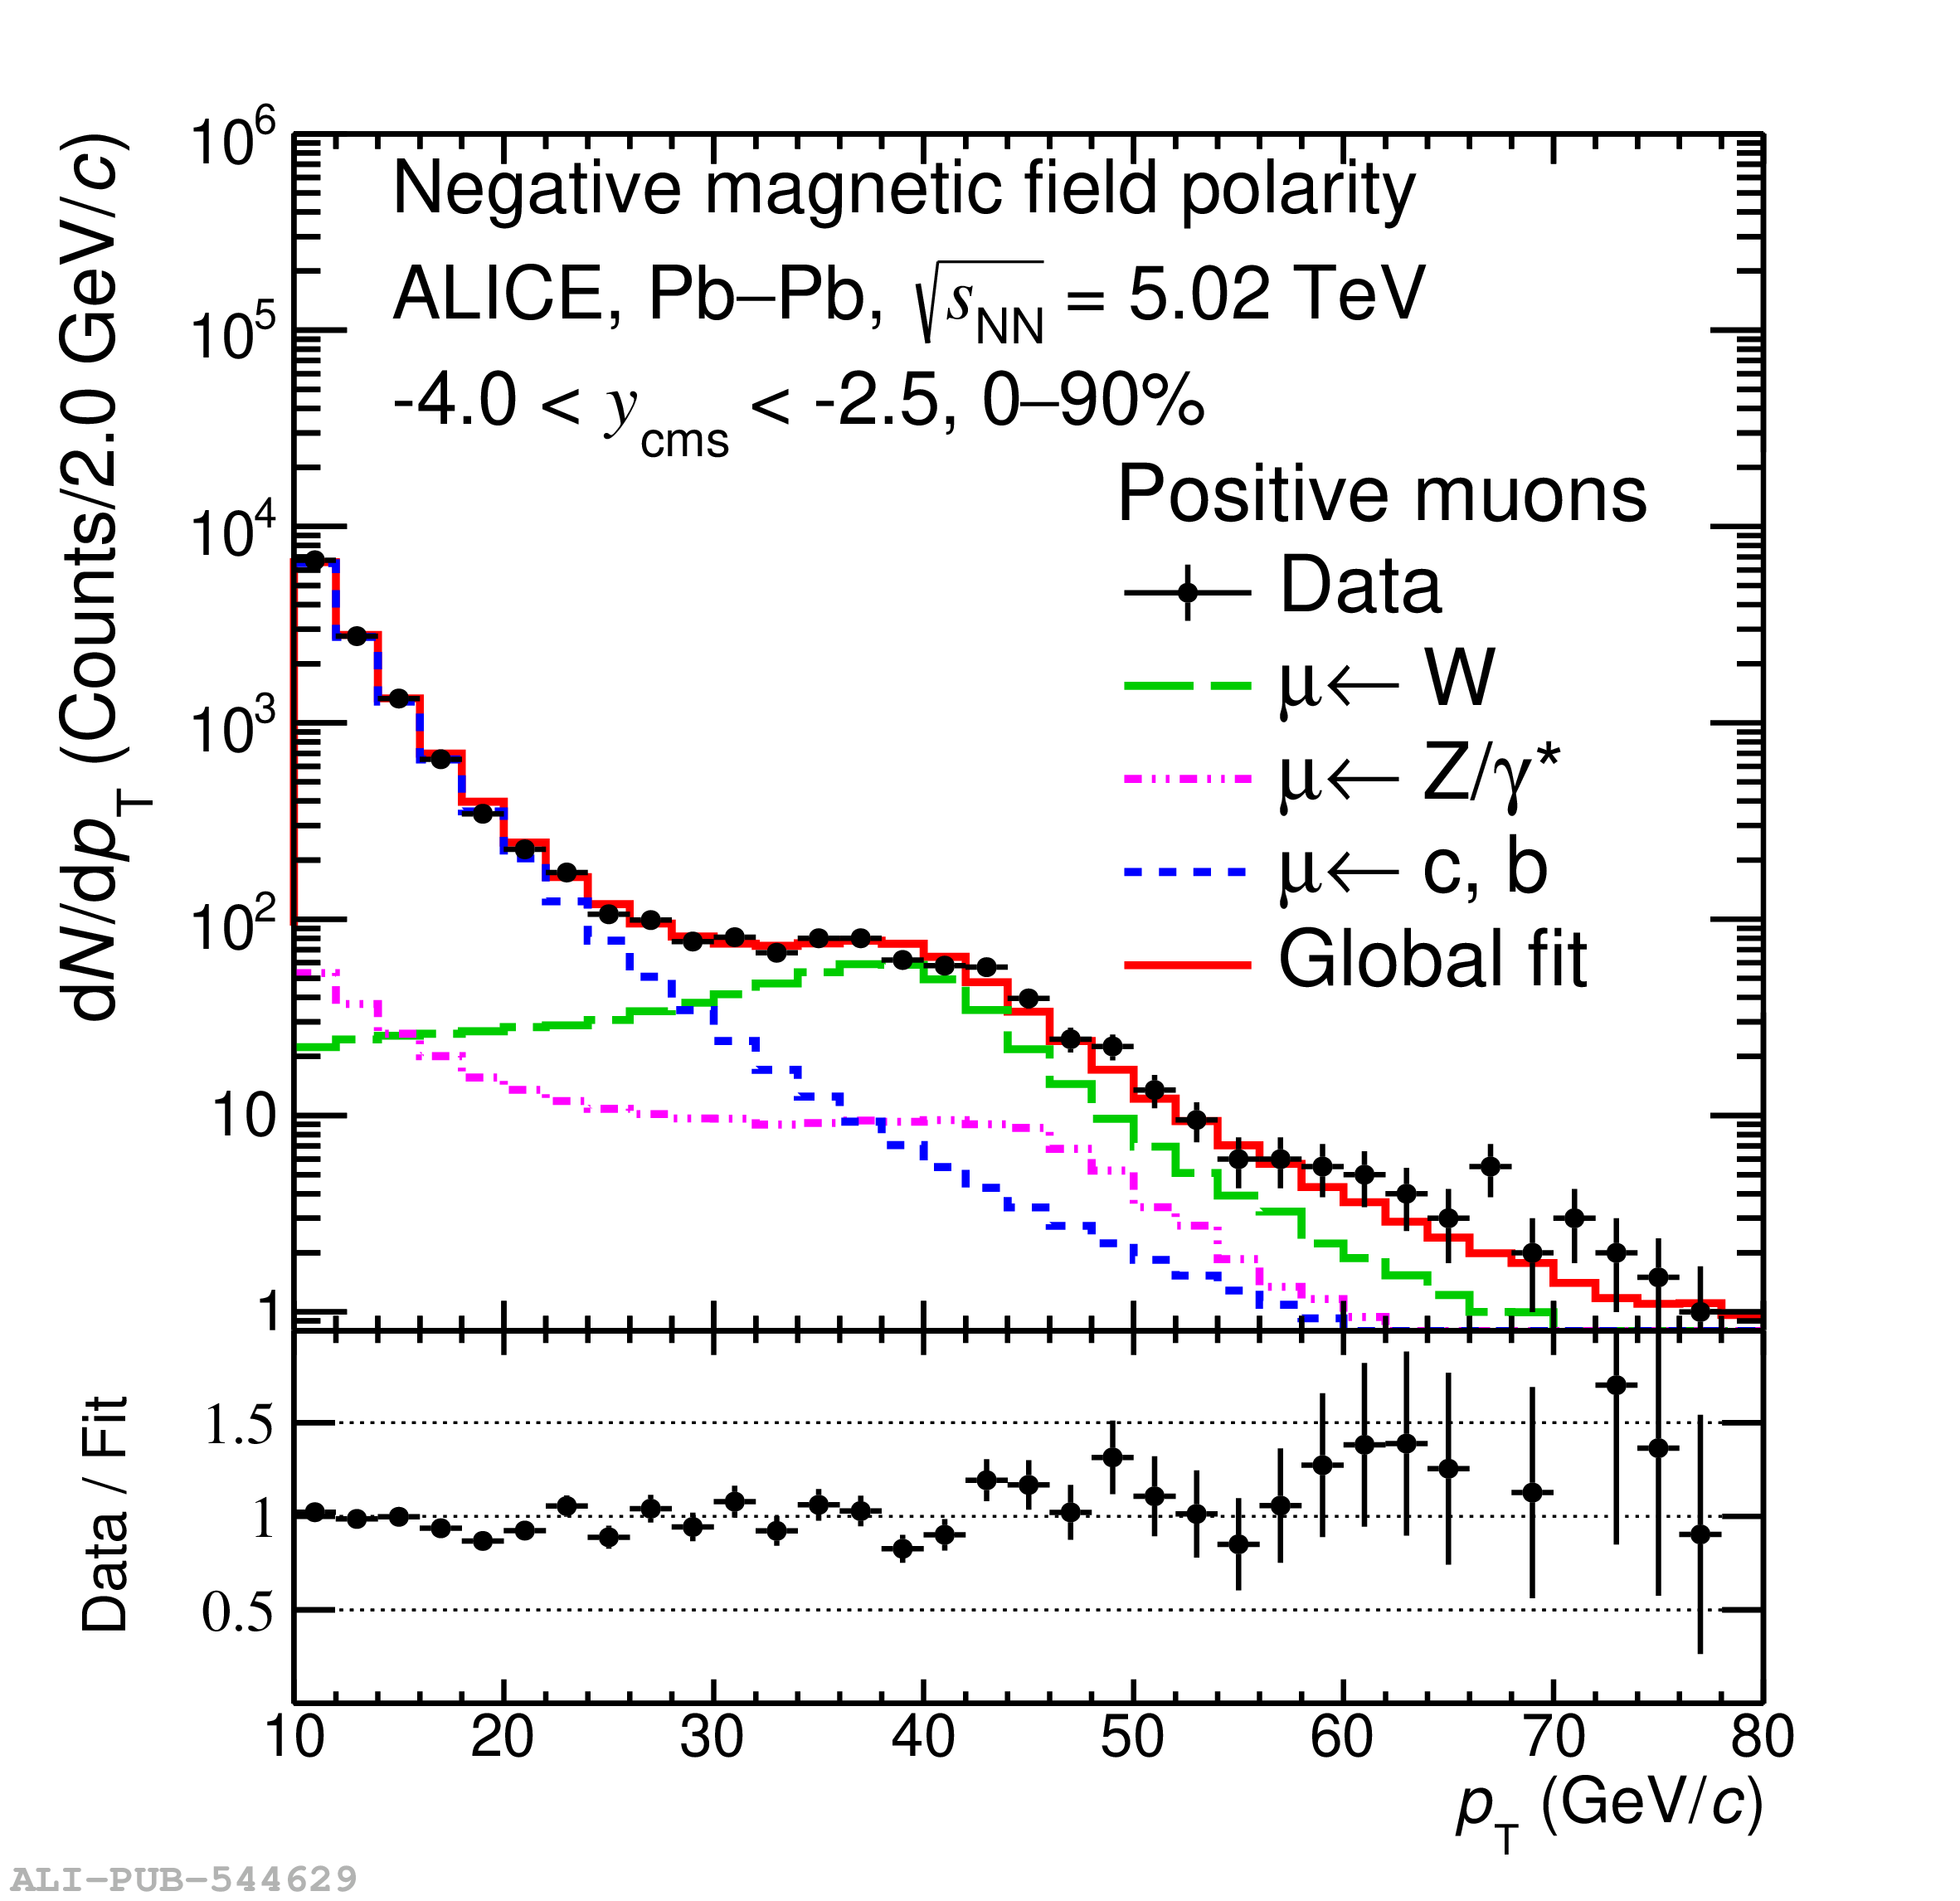 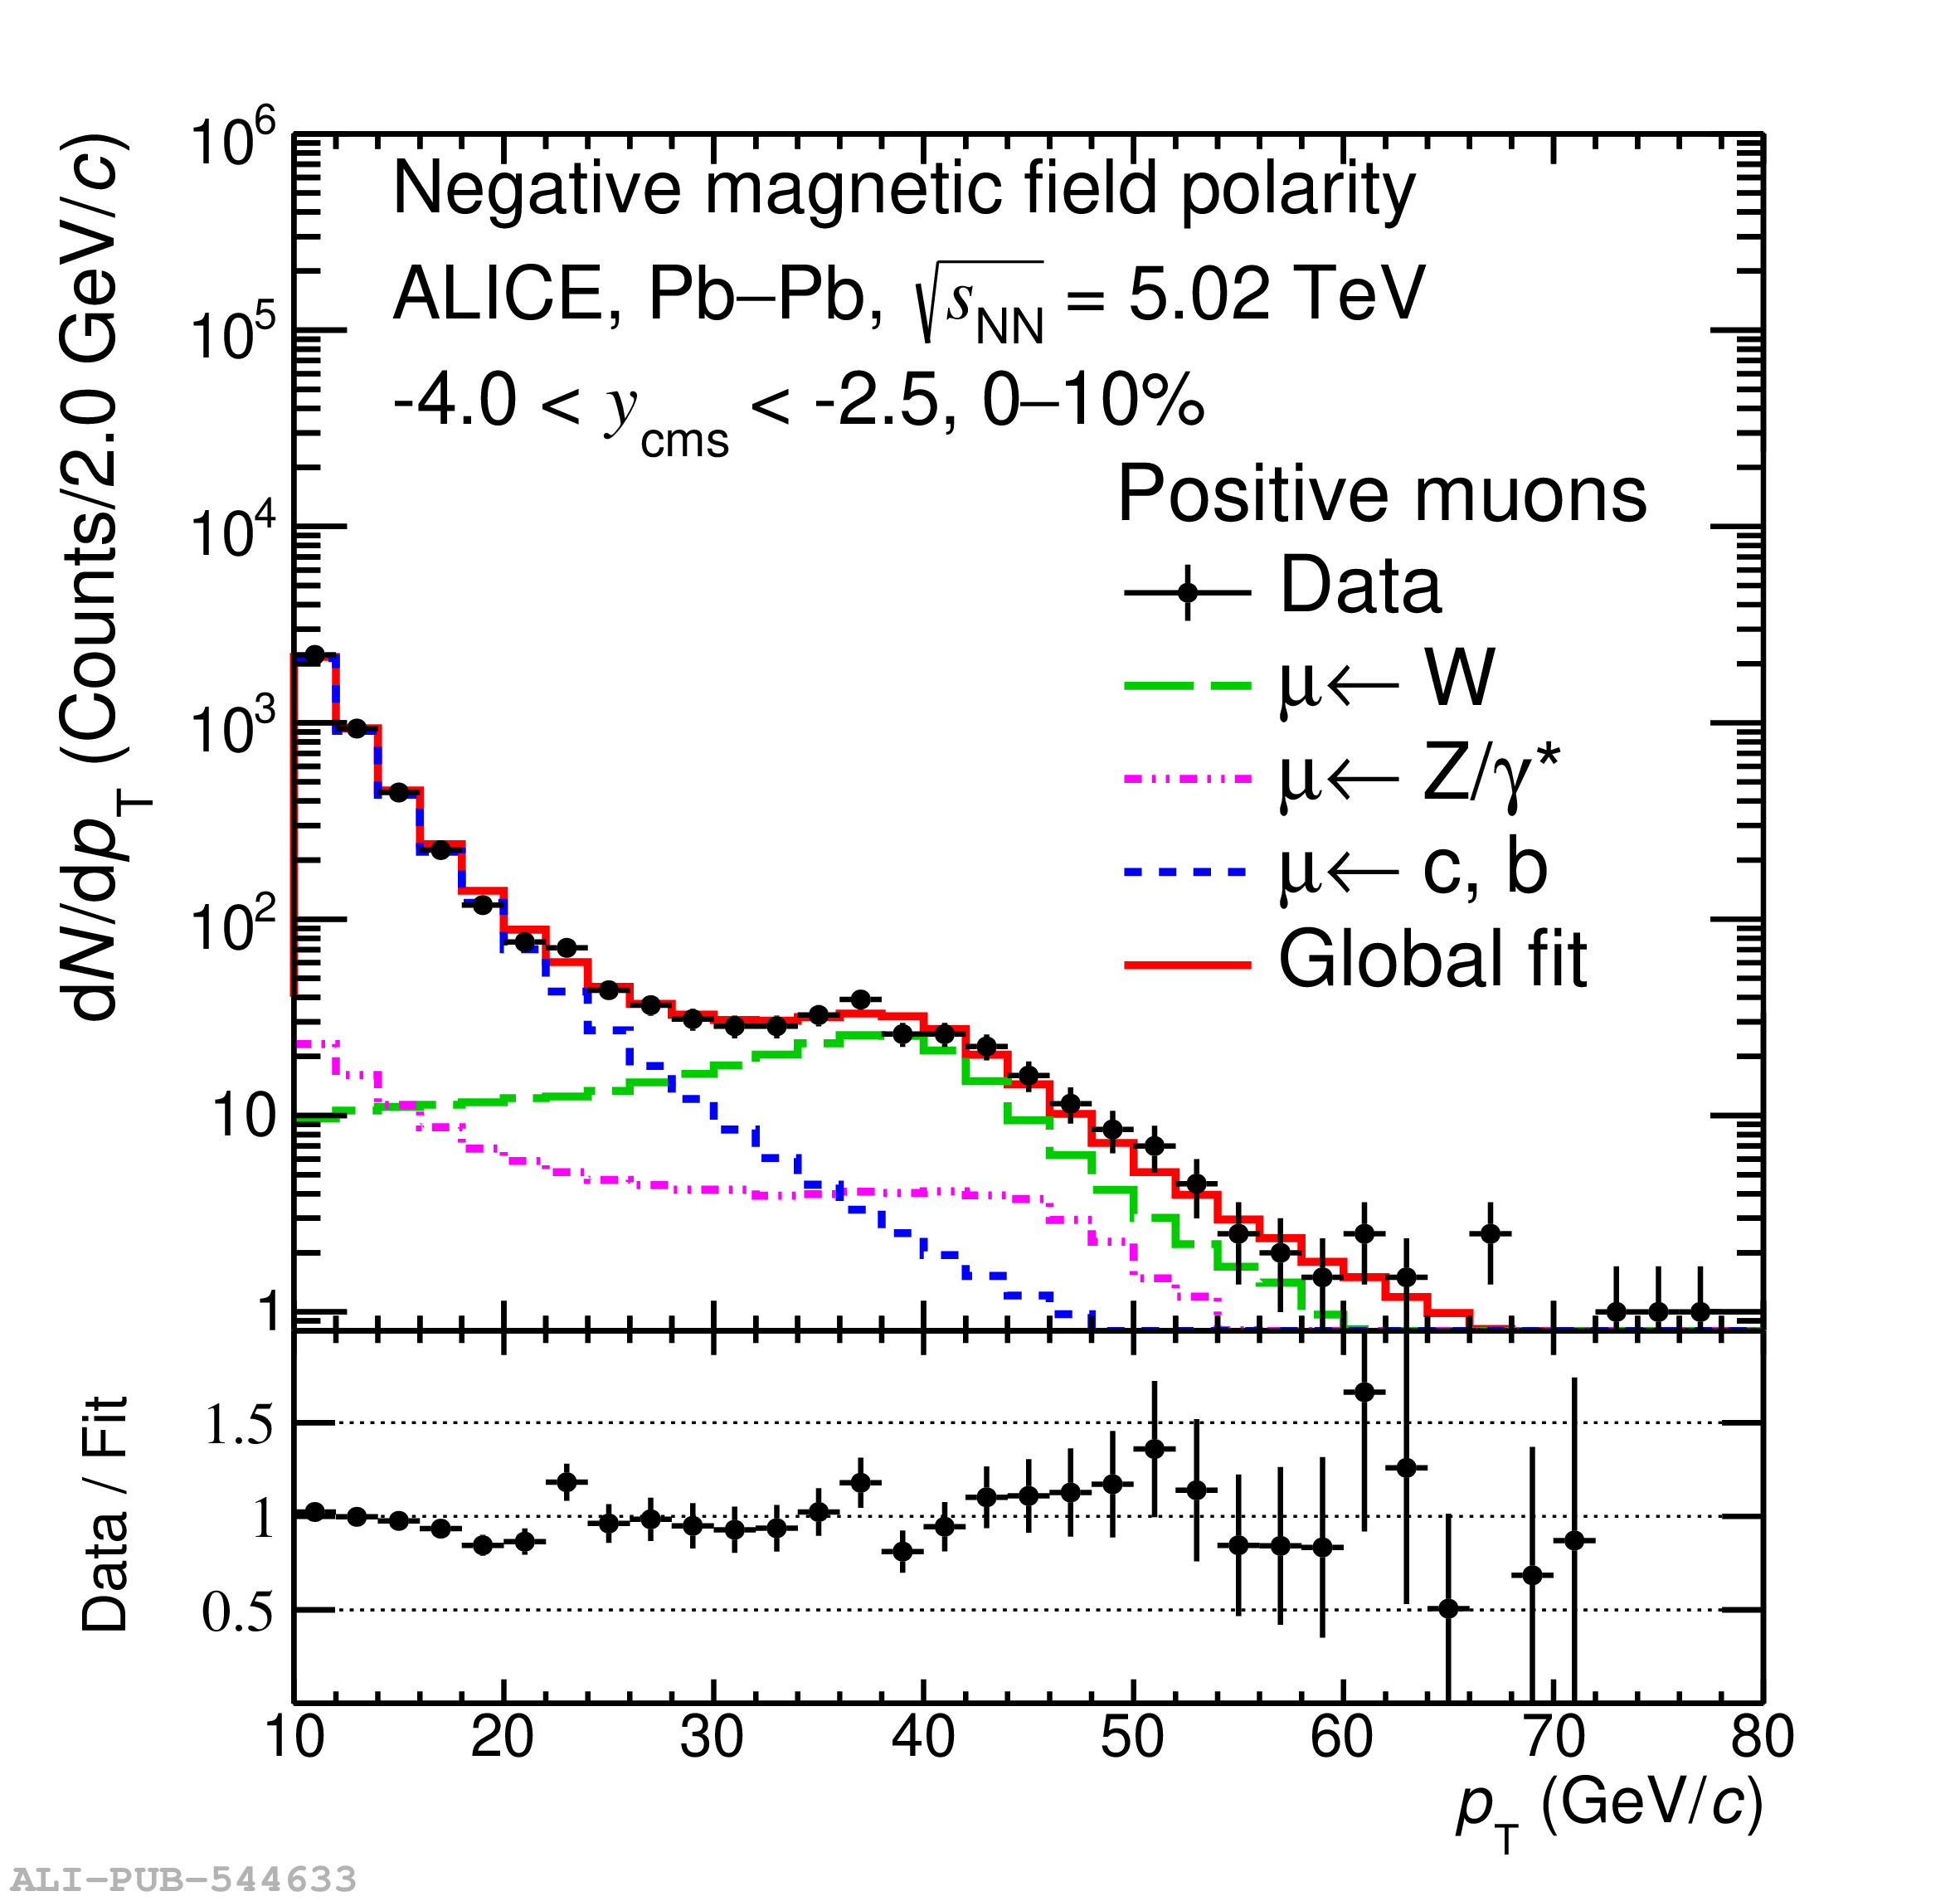 |