Production cross section of muons from W$^-$ (top) and W$^+$ (bottom) decays as a function of rapidity for muons with $\pt^\mu > 10$ GeV/$c$ in p-Pb collisions at $\sqrt{s_{\rm NN}}=8.16$ TeV. The measurements are compared with predictions from several nPDF sets, as well as with calculations based on the CT14 PDF set without nuclear modifications of the PDF. All the calculations include the isospin effect. The bottom panels show the ratio of the calculations to the measured production cross section. The horizontal bars correspond to the width of the rapidity intervals. The vertical bars and boxes indicate the statistical and systematic uncertainties, respectively. The data points are placed at the centres of the rapidity intervals, while the theory predictions are horizontally shifted for better visibility. | 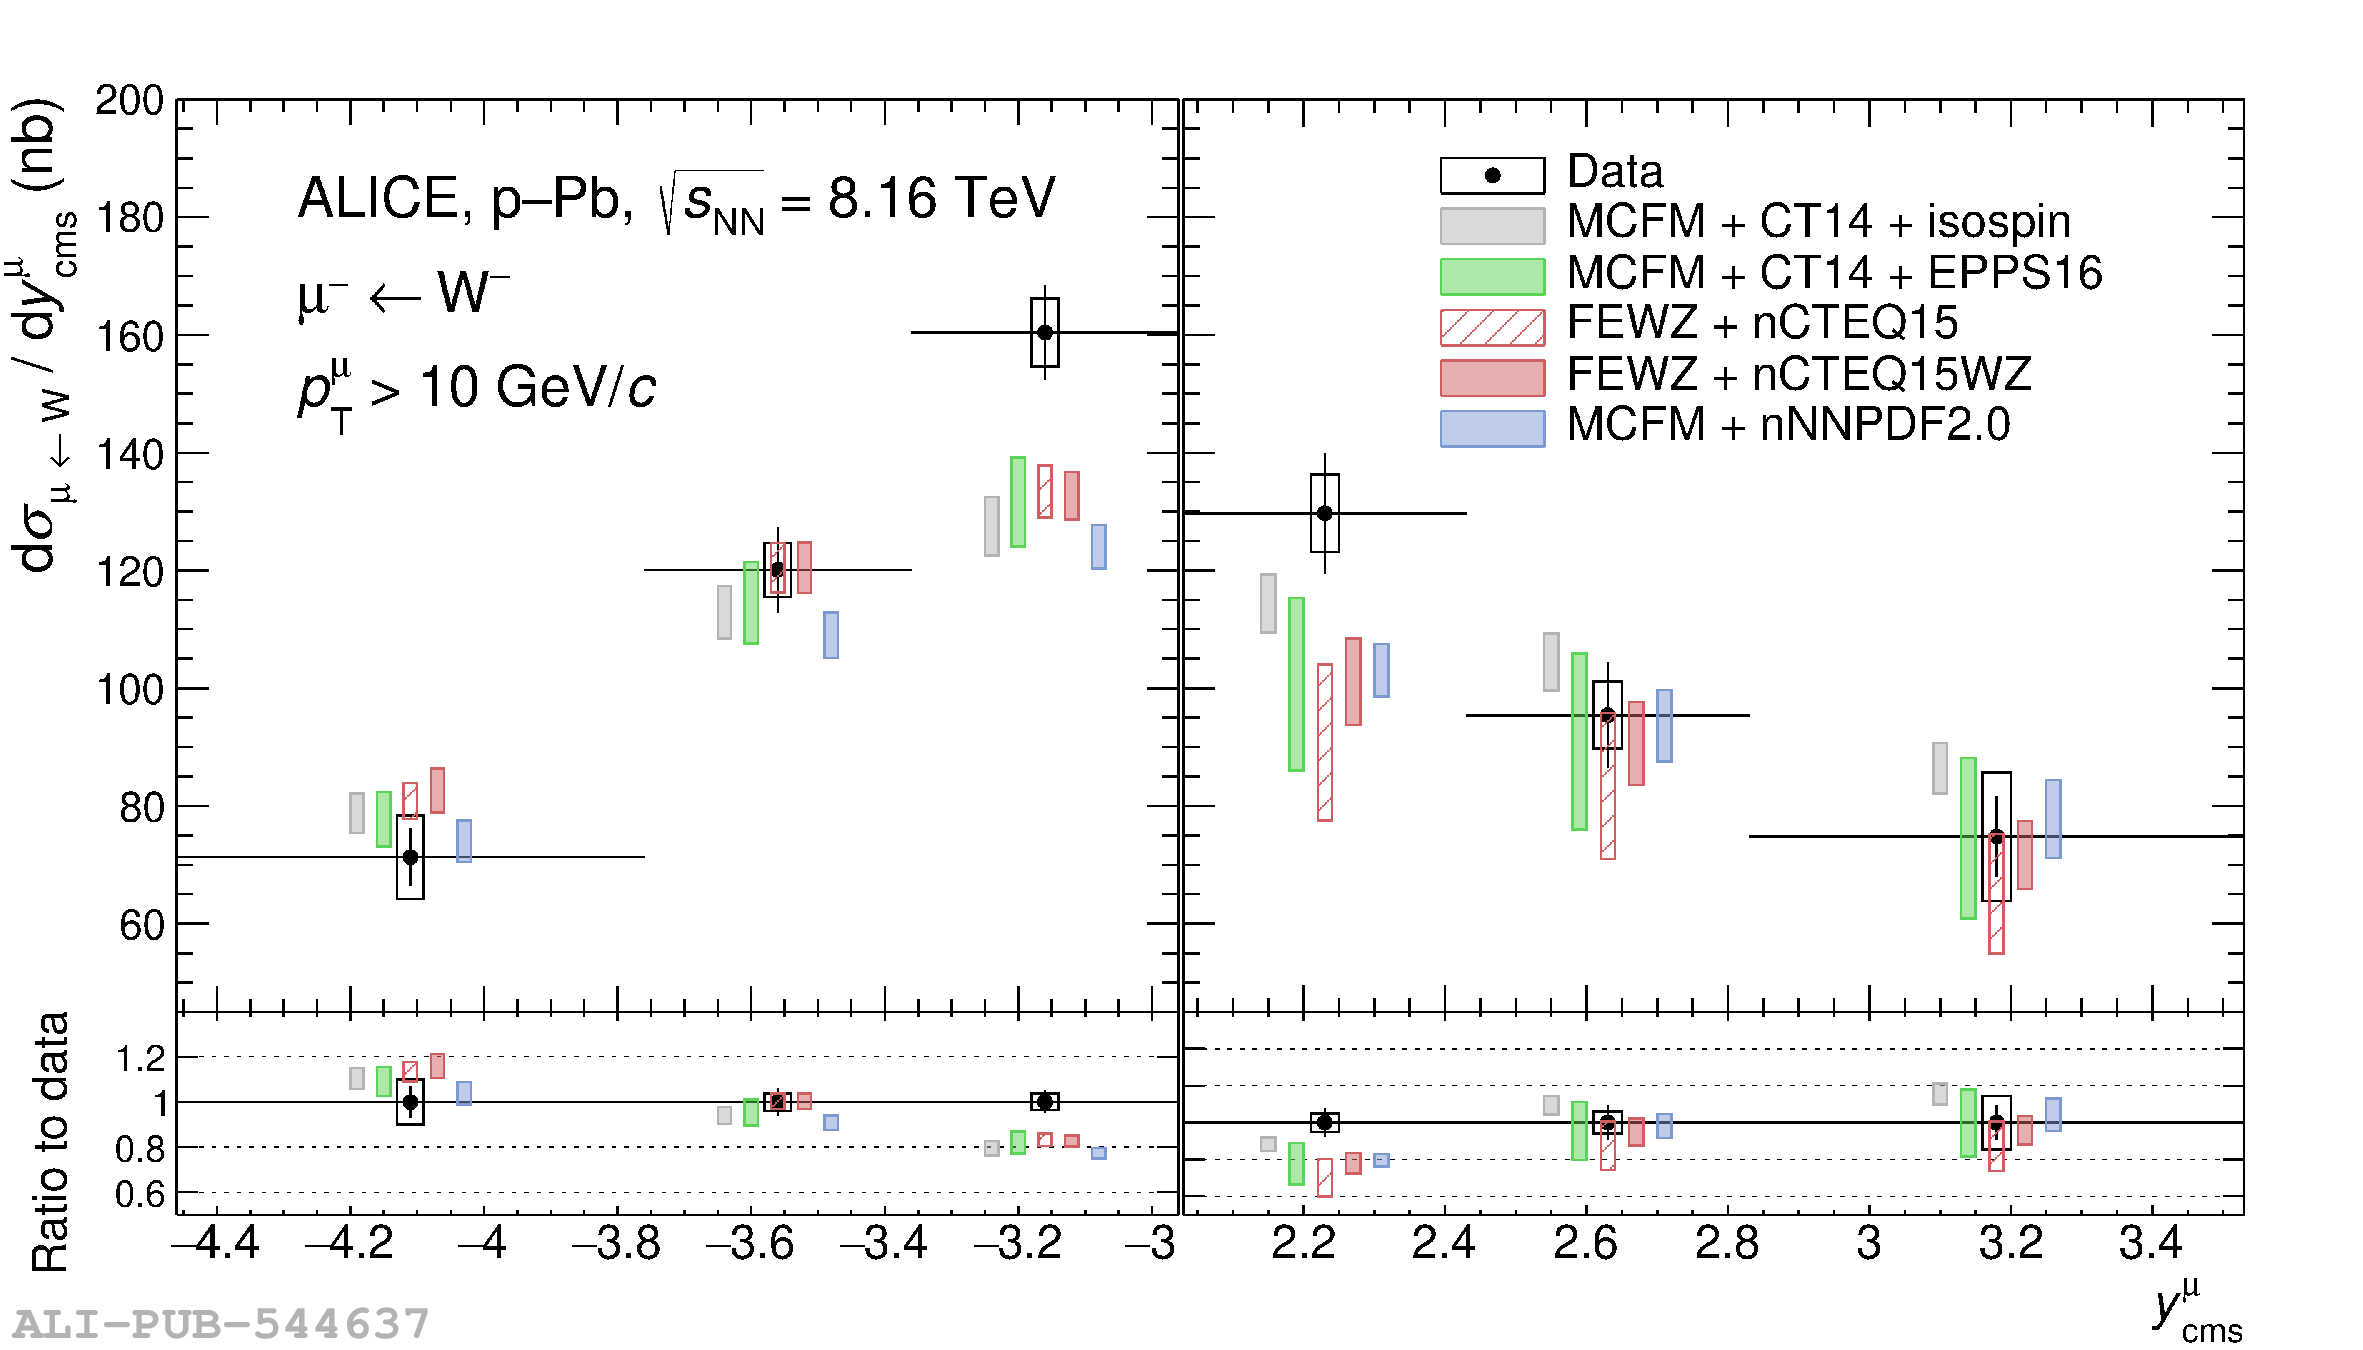 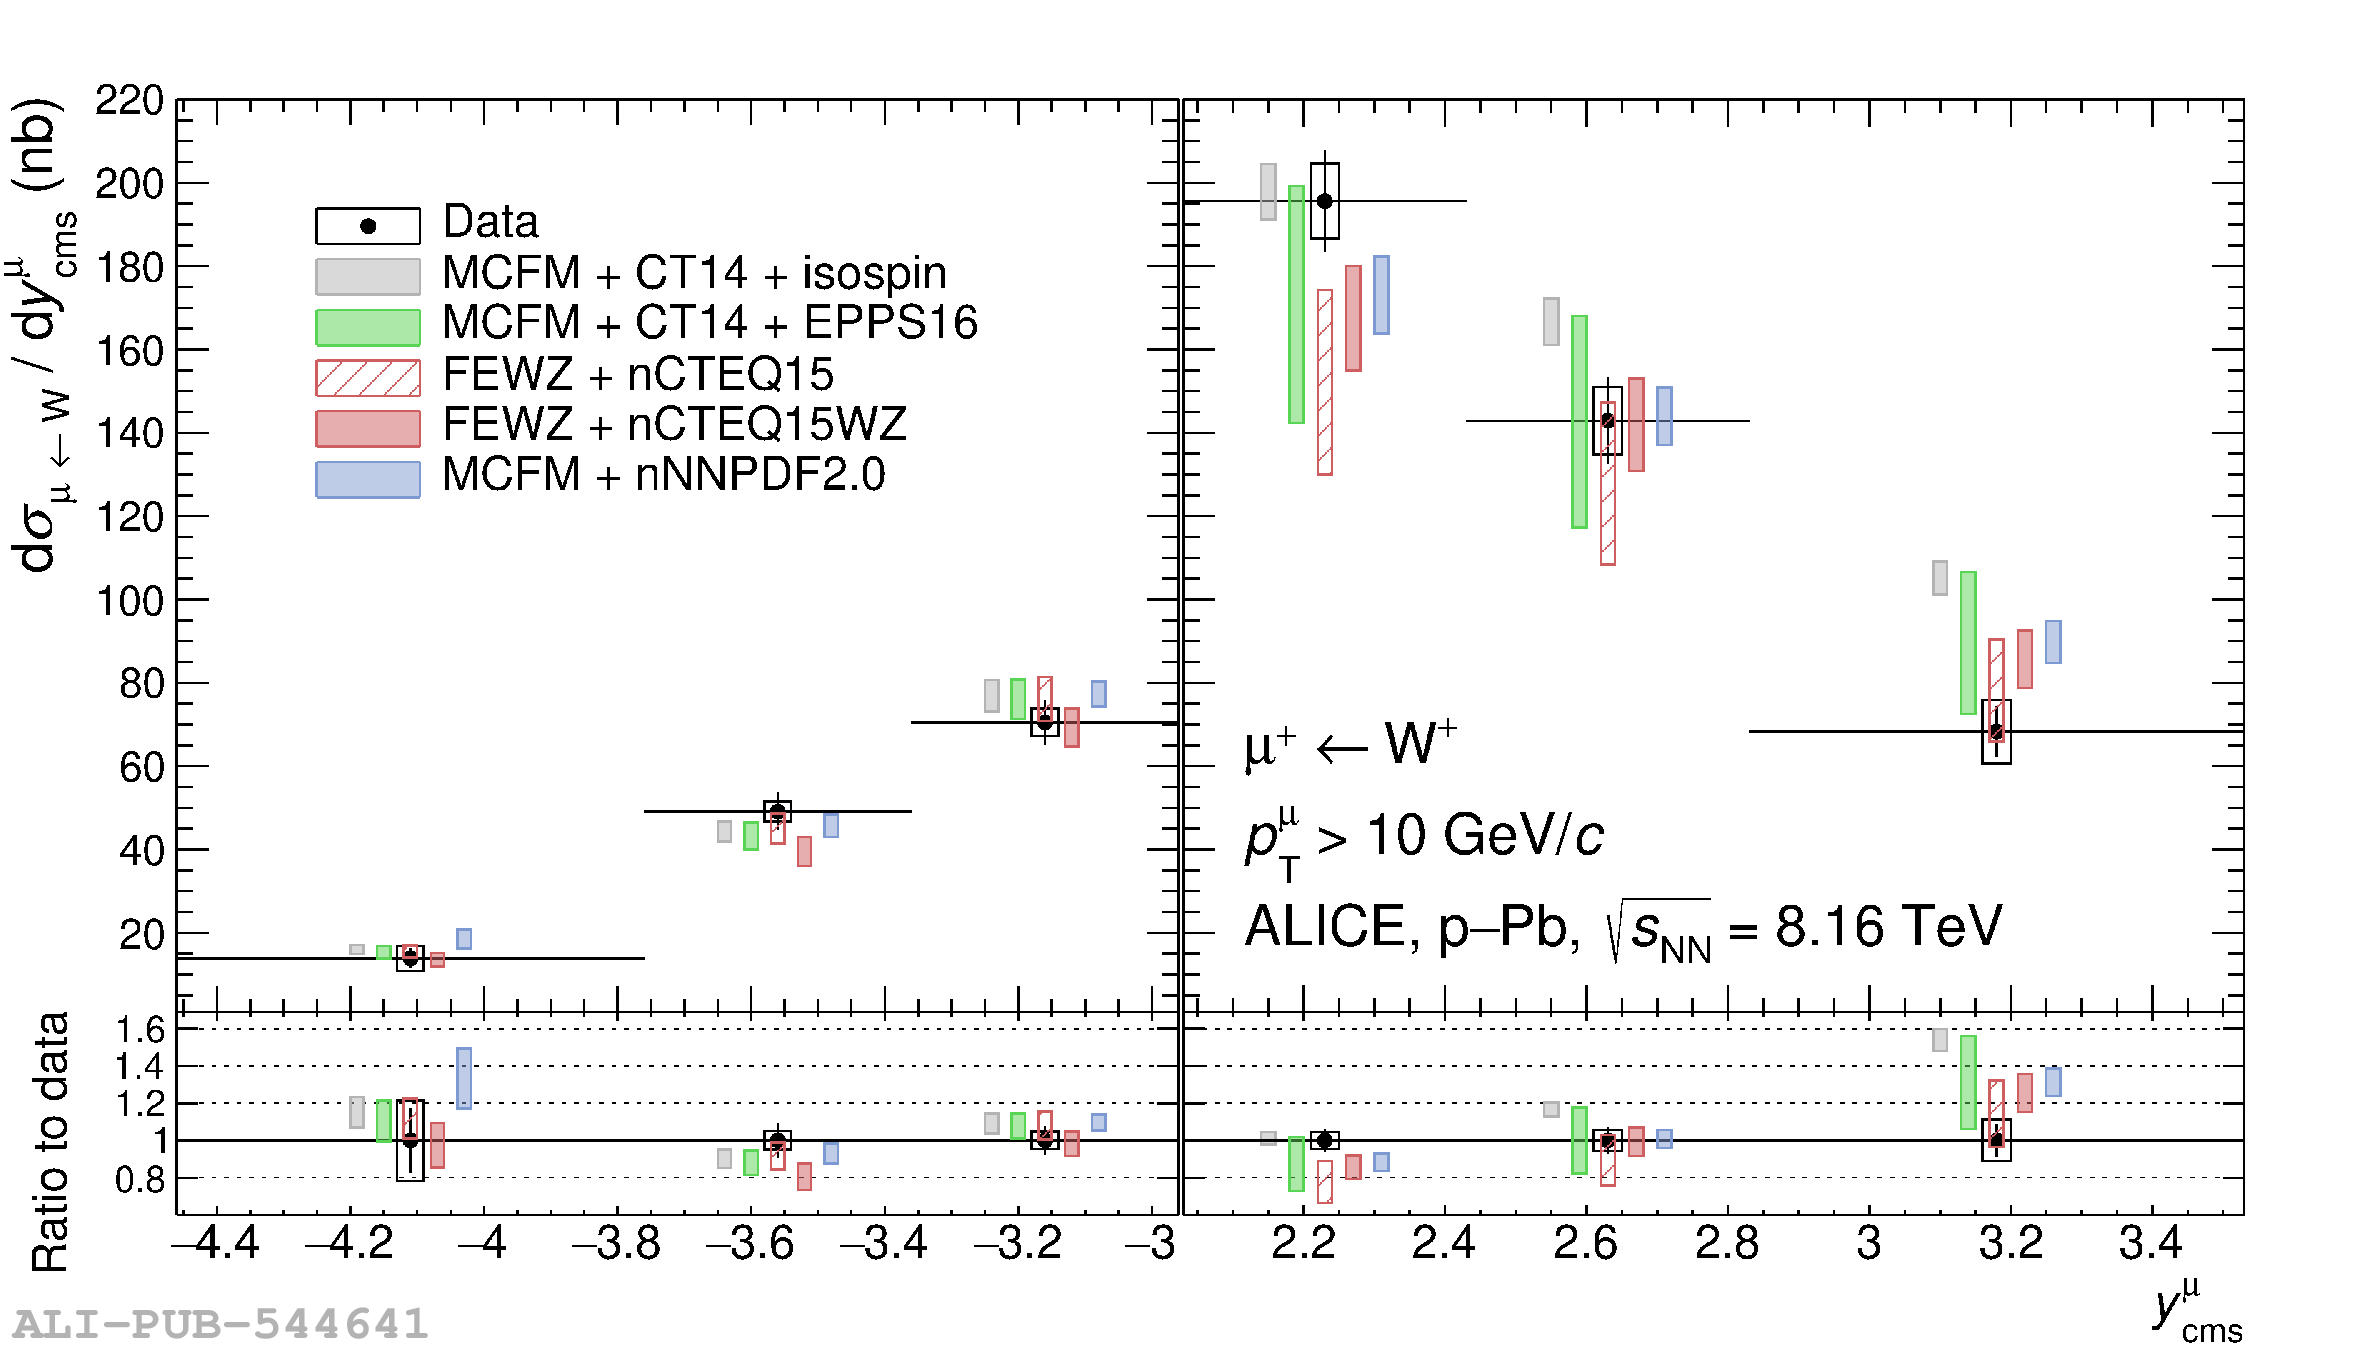 |