Underlying Event properties in pp collisions at $\sqrt{s}$ = 13 TeV

This article reports measurements characterizing the Underlying Event (UE) associated with hard scatterings at midrapidity in pp collisions at $\sqrt{s}=13$ TeV. The hard scatterings are identified by the leading particle, the charged particle with the highest transverse momentum ($p_{\rm T}^{\rm leading}$) in the event. Charged-particle number and summed transverse-momentum densities are measured in different azimuthal regions defined with respect to the leading particle direction: Toward, Transverse, and Away. The Toward and Away regions contain the fragmentation products of the hard scatterings in addition to the UE contribution, whereas particles in the Transverse region are expected to originate predominantly from the UE. The study is performed as a function of $p_{\rm T}^{\rm leading}$ with three different $p_{\rm T}$ thresholds for the associated particles, $p_{\rm T}^{\rm min} >$ 0.15, 0.5, and 1.0 GeV/$c$. The charged-particle density in the Transverse region rises steeply for low values of $p_{\rm T}^{\rm leading}$ and reaches a plateau. The results confirm the trend that the charged-particle density in the Transverse region shows a stronger increase with $\sqrt{s}$ than the inclusive charged-particle density at midrapidity. The UE activity is increased by approximately 20% when going from 7 to 13 TeV. The plateau in the Transverse region ($5 <~ p_{\rm T}^{\rm leading} <~ ~ 40$ GeV/$c$ ) is further characterized by the probability distribution of its charged-particle multiplicity normalized to its average value (relative transverse activity, $R_{T}$) and the mean transverse momentum as a function of $R_{T}$. Experimental results are compared to model calculations using PYTHIA 8 and EPOS LHC. The overall agreement between models and data is within 30%. These measurements provide new insights on the interplay between hard scatterings and the associated UE in pp collisions.


J. High Energ. Phys. 2020, 192 (2020)
HEP Data
e-Print: arXiv:1910.14400 | PDF | inSPIRE
CERN-EP-2019-235

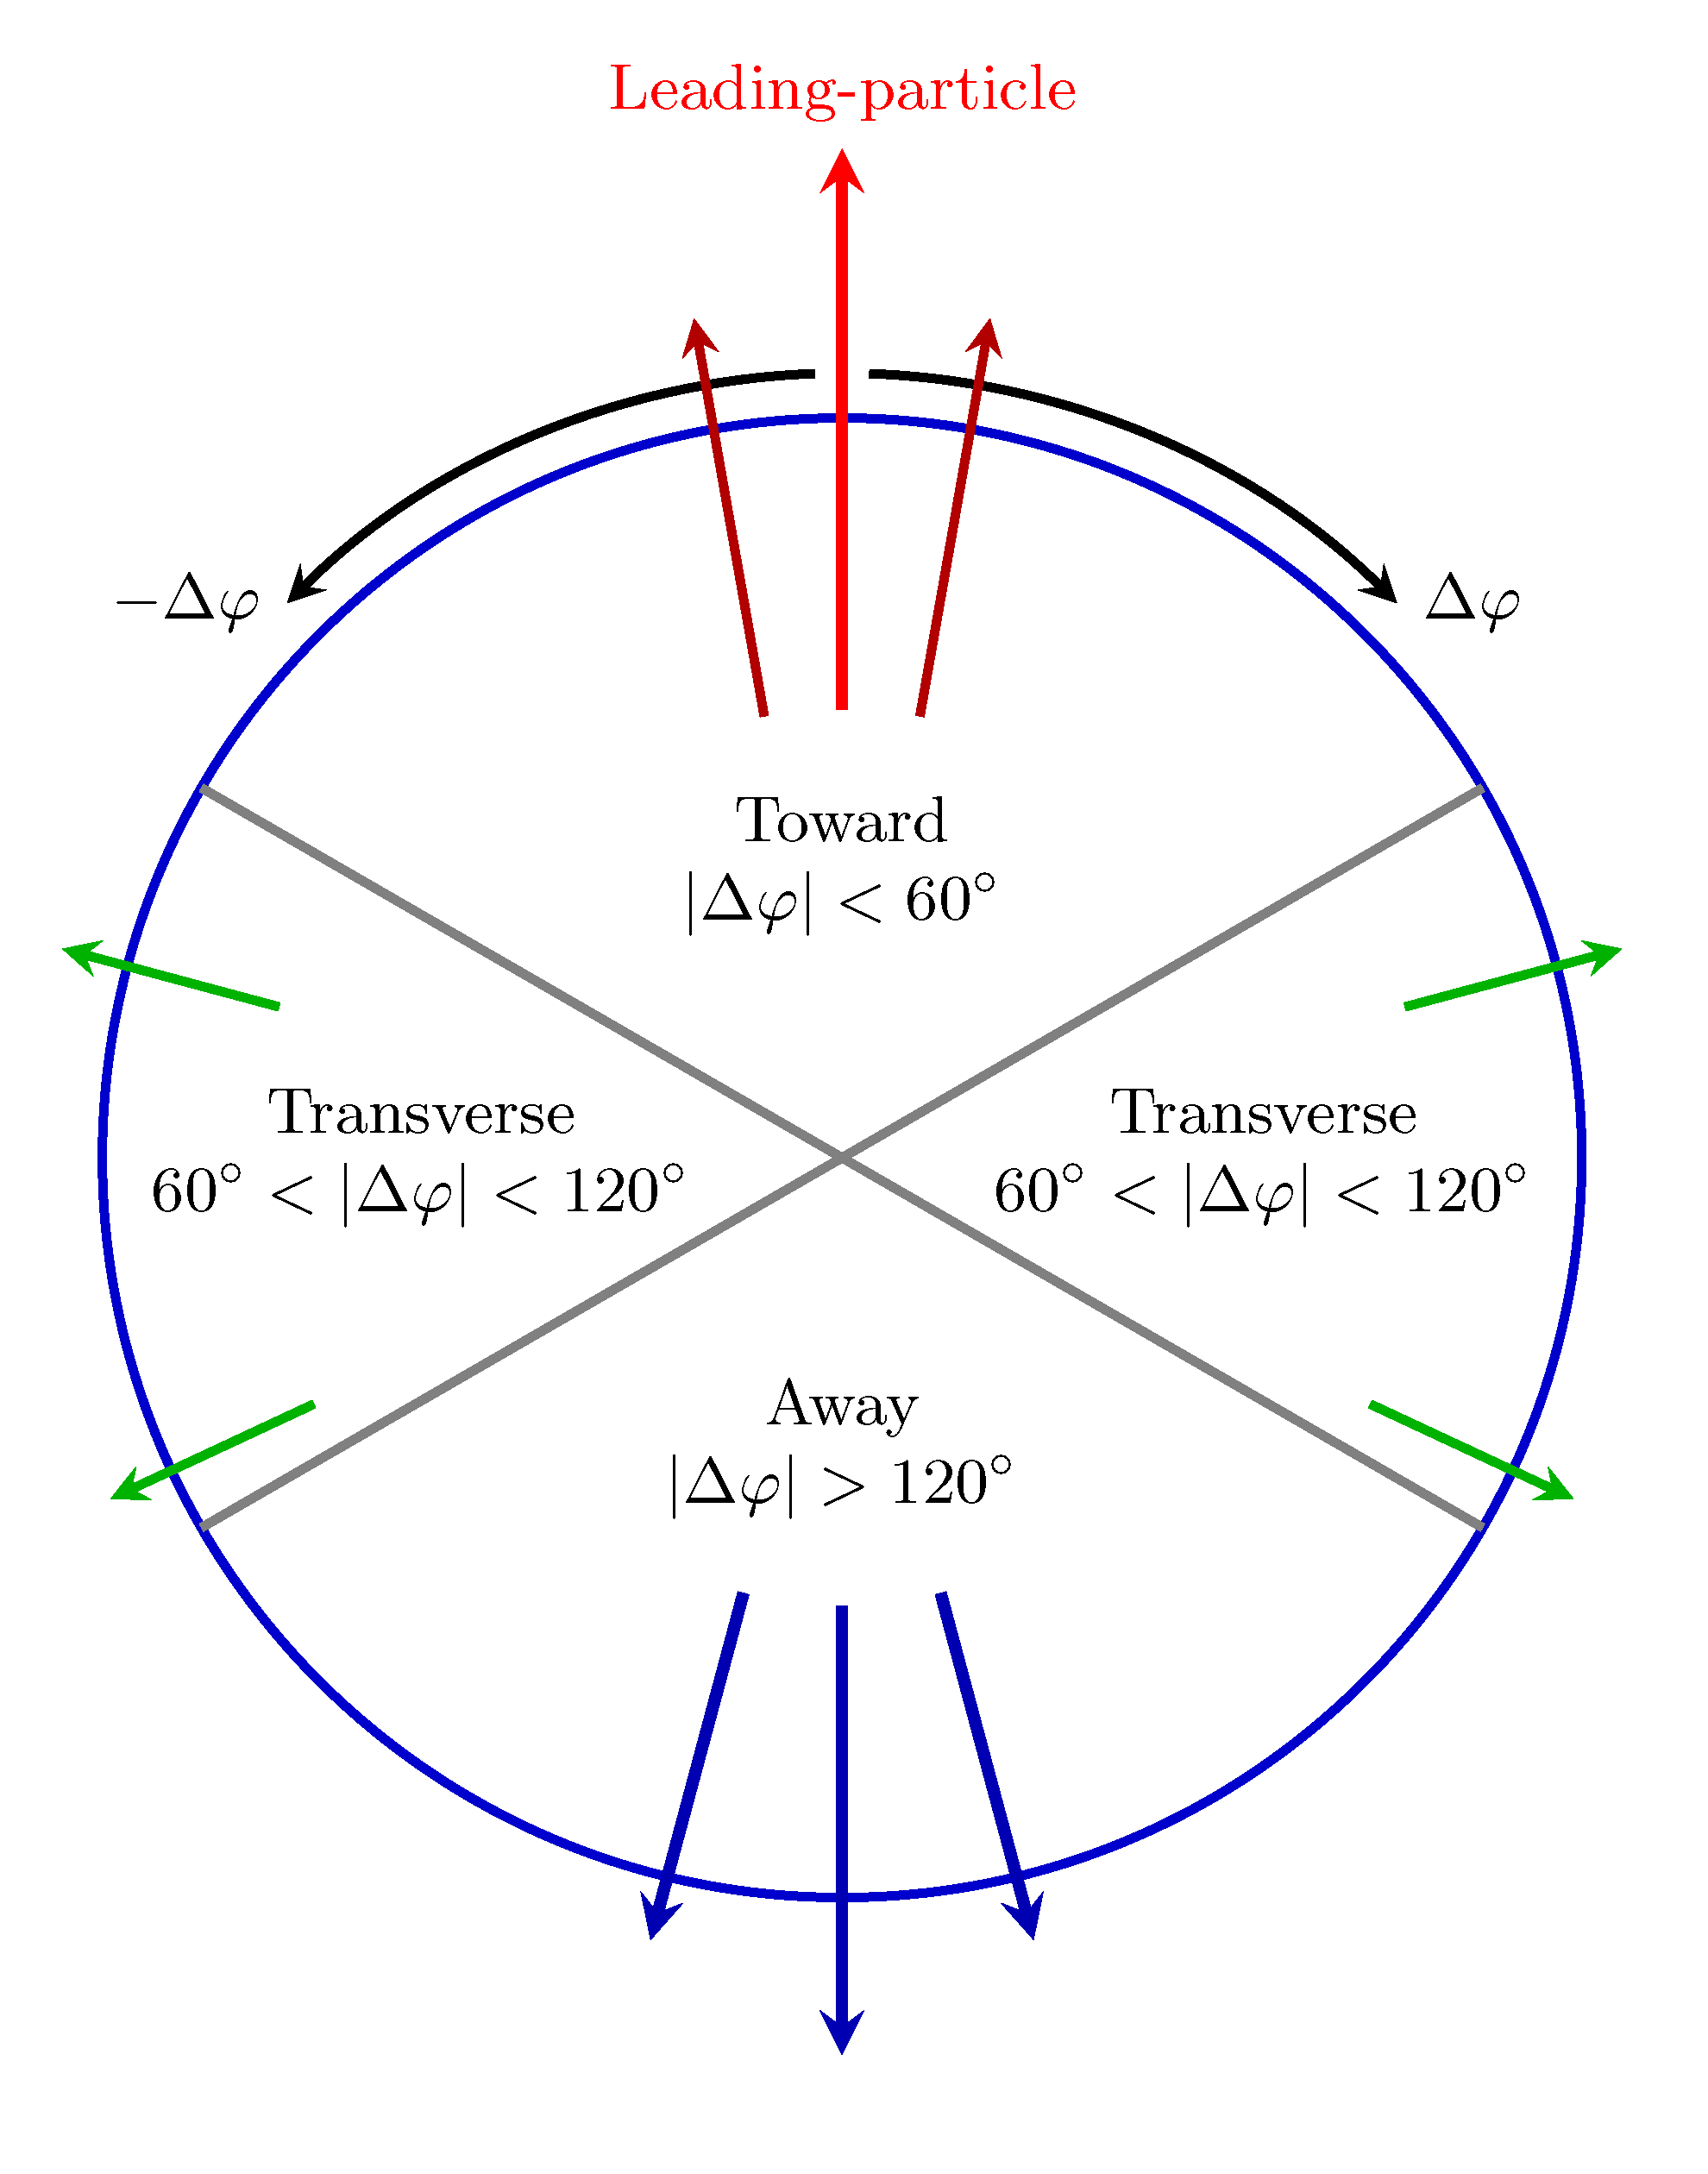
Figure 1

Illustration of the Toward, Transverse, and Away regions in the azimuthal plane with respect to the leading particle direction.

Figure 2

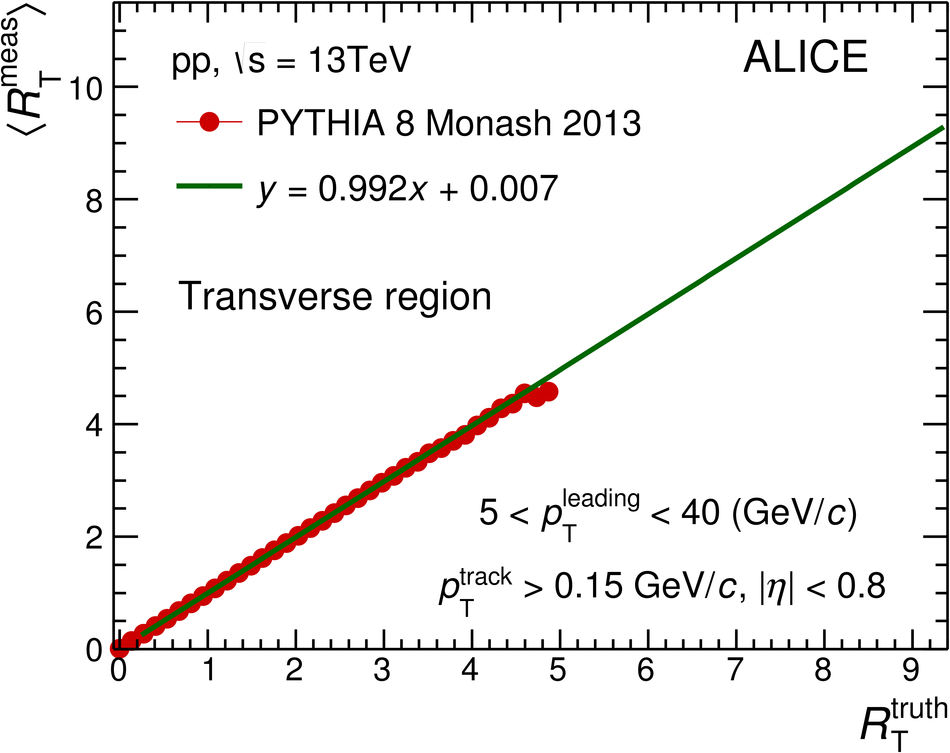
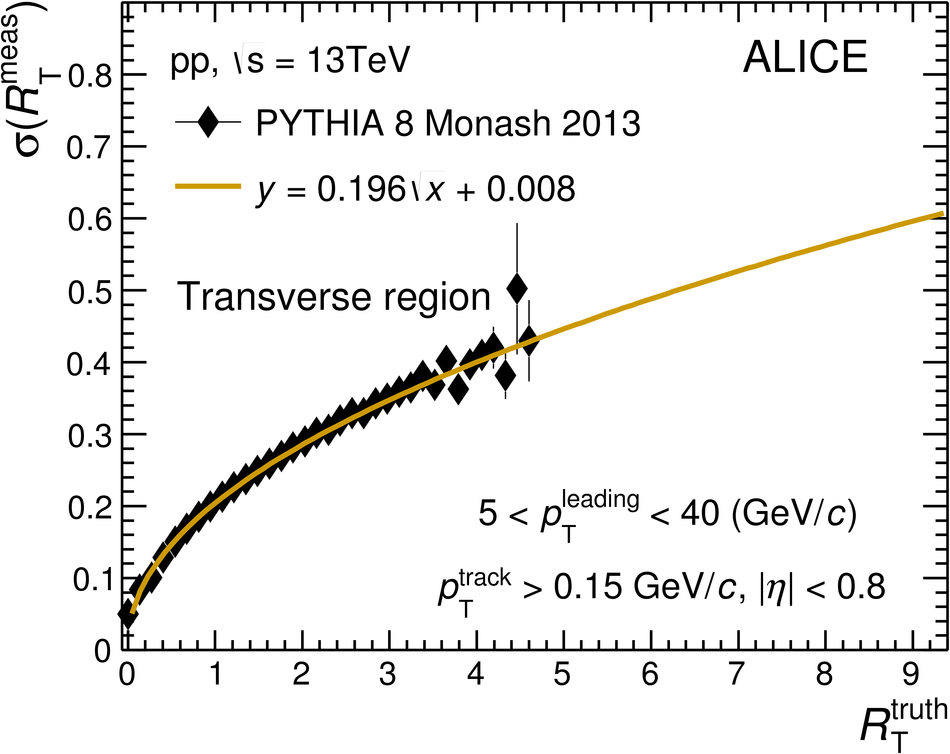
Mean RTmeas and standard deviation σ of the RTmeas distribution as a function of RTtruth. The solid lines represent the fits to the points and the extrapolation to higher RTtruth, resulting in the parameterized response matrix used for unfolding.

Figure 3

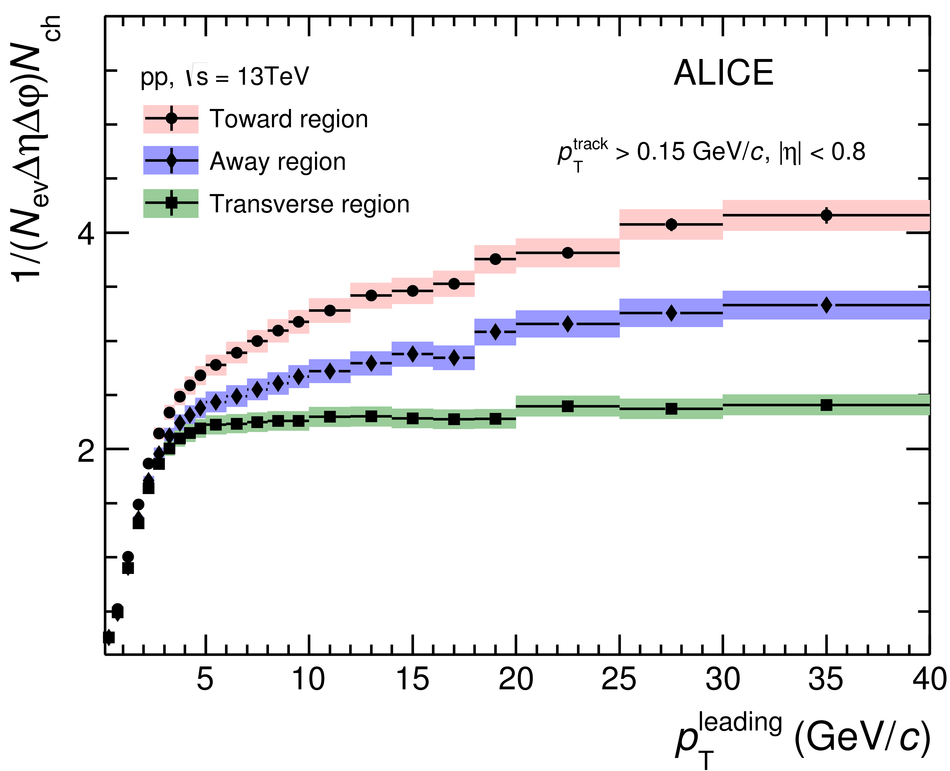
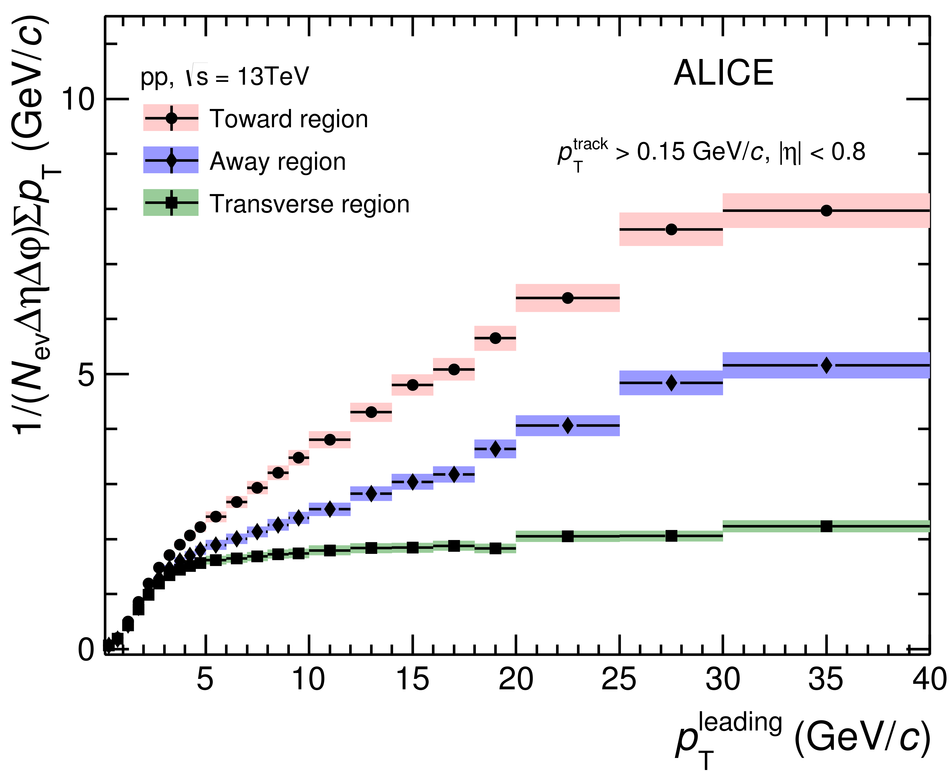
Figure 3: Number density Nch (left) and ∑ pT (right) distributions as a function of pTleading in Toward, Transverse, and Away regions for pTtrack > 0.15 GeV/c. The shaded areas represent the systematic uncertainties and vertical error bars indicate statistical uncertainties.

Figure 4

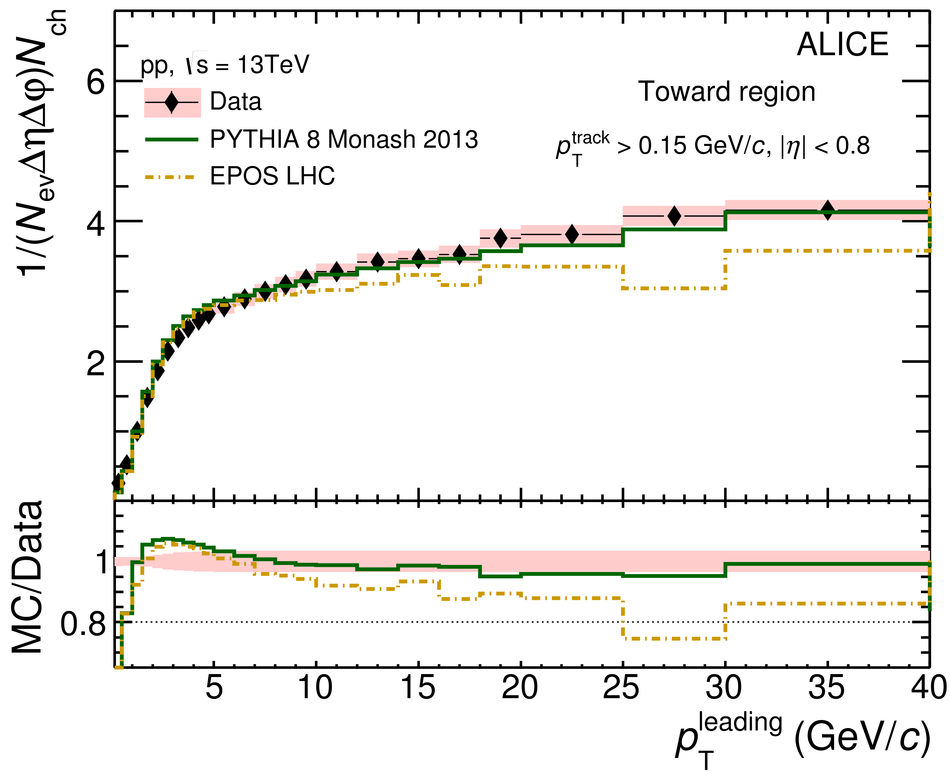
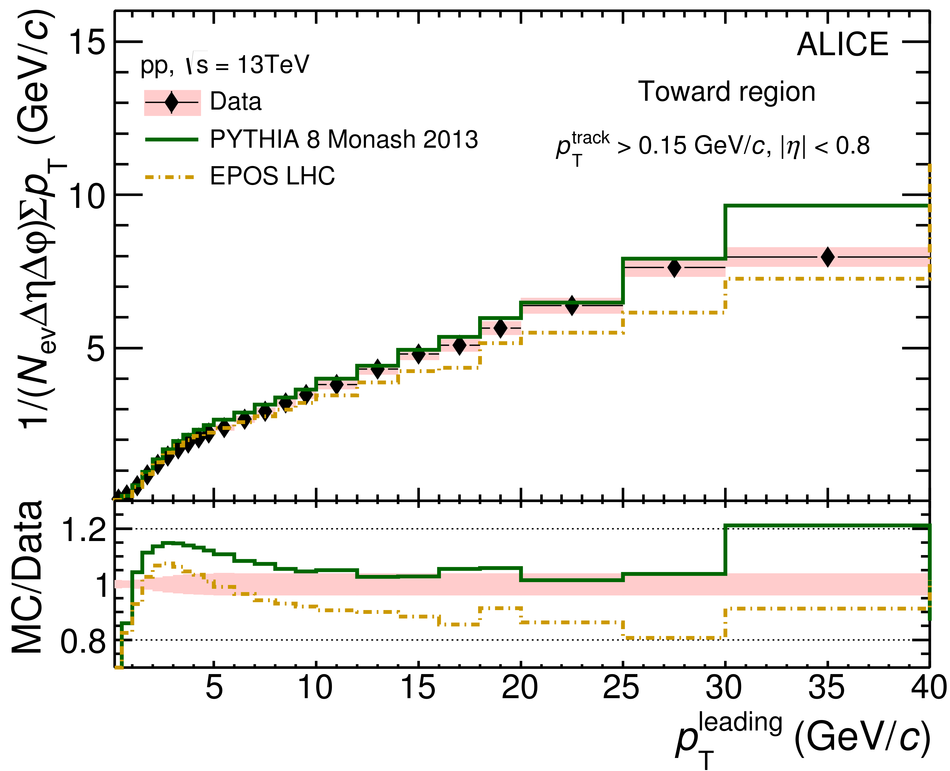
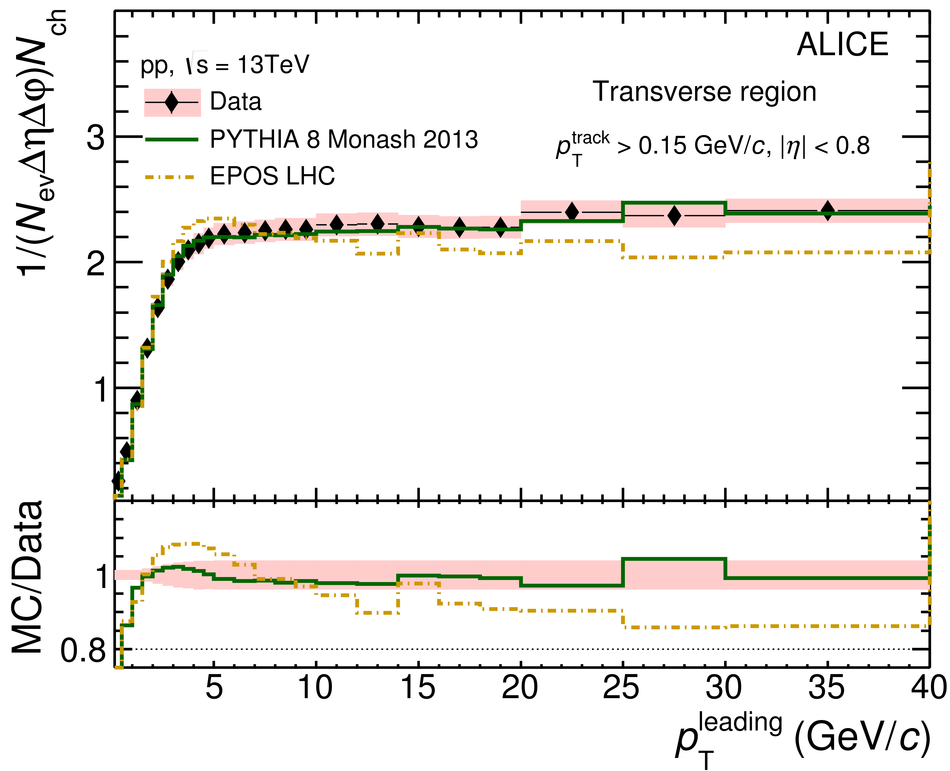
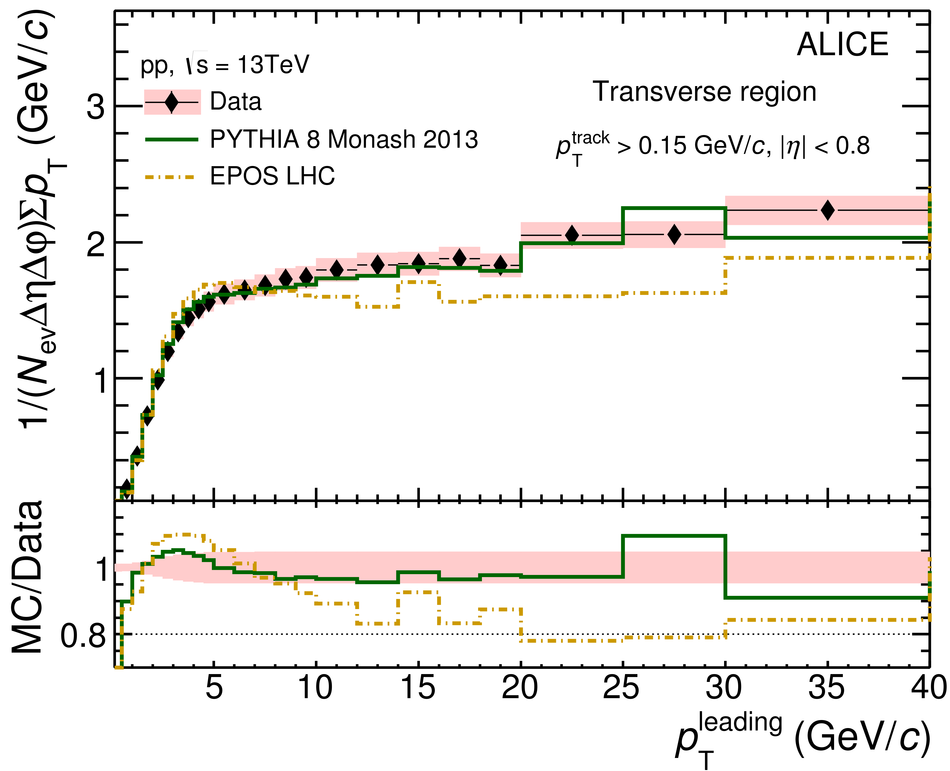
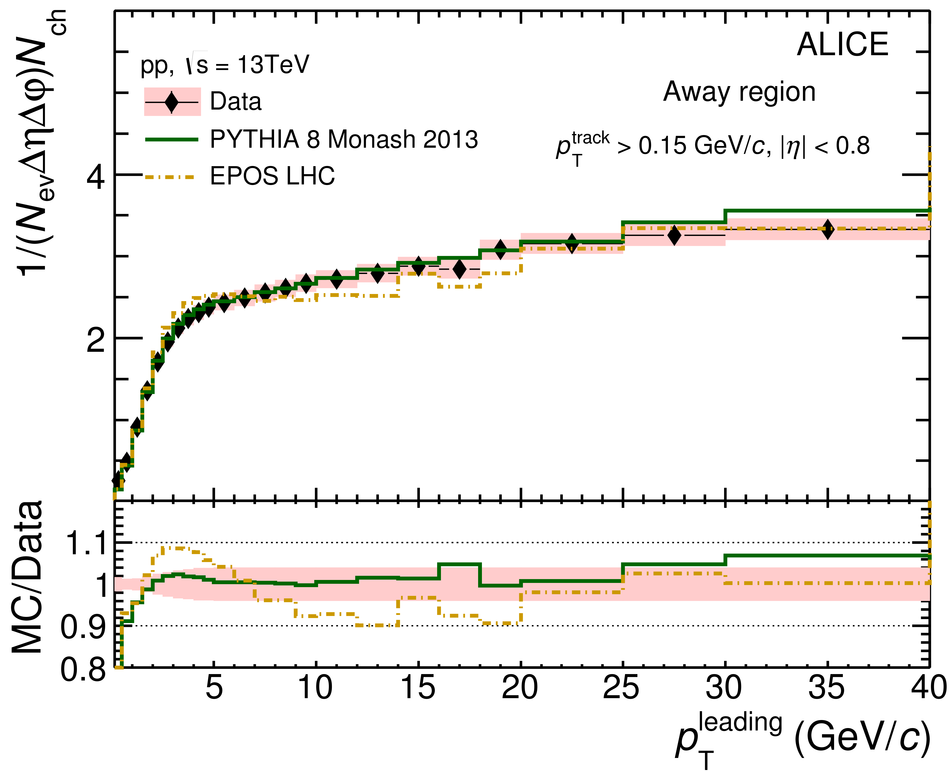
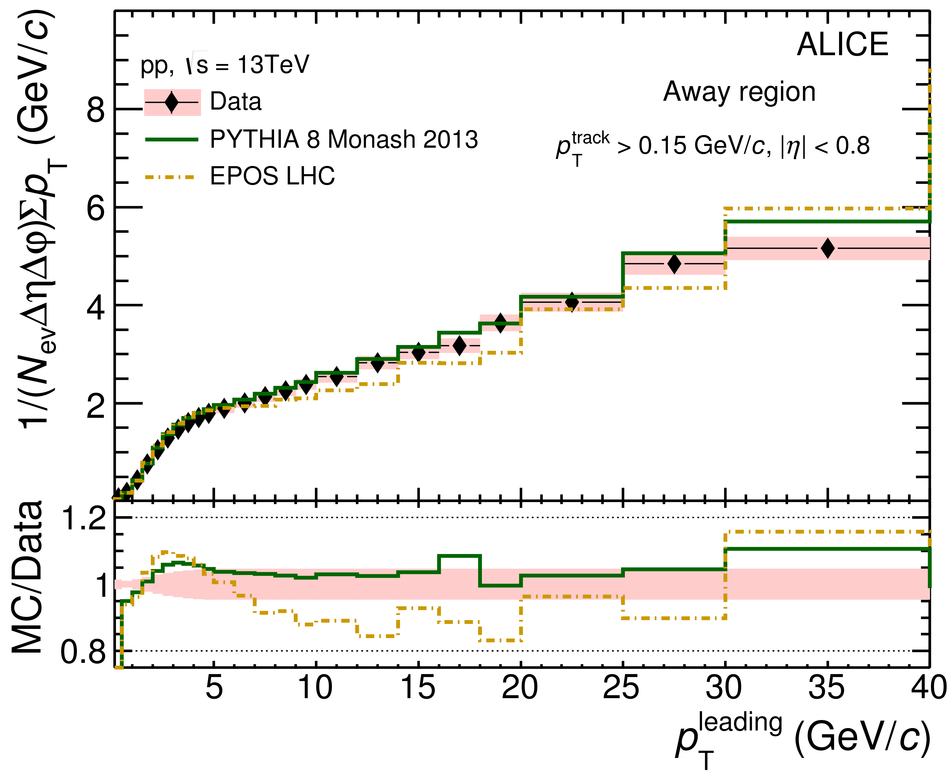
Number density Nch (left) and ∑ pT (right) distributions as a function of pTleading along with the MC simulations in Toward (top), Transverse (middle), and Away (bottom) regions for the threshold of pTtrack > 0.15 GeV/c. The shaded areas in the upper panels represent the systematic uncertainties and vertical error bars indicate statistical uncertainties for the data. In the lower panels, the shaded areas are the sum in quadrature of statistical and systematic uncertainties from upper panels. No uncertainties are shown for the MC simulations.

Figure 5

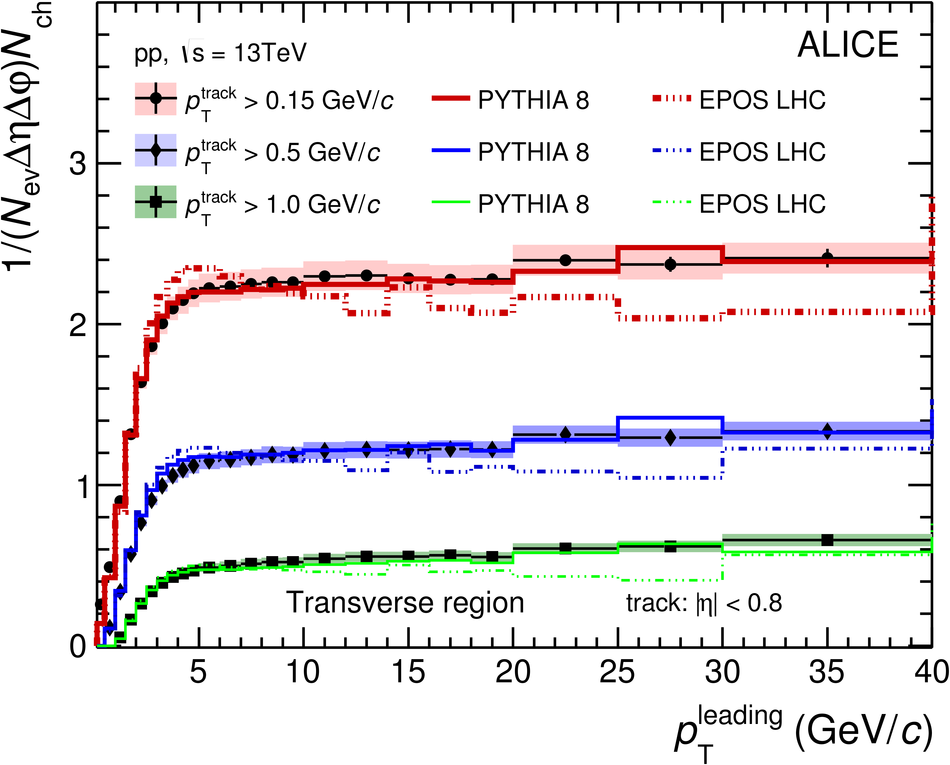
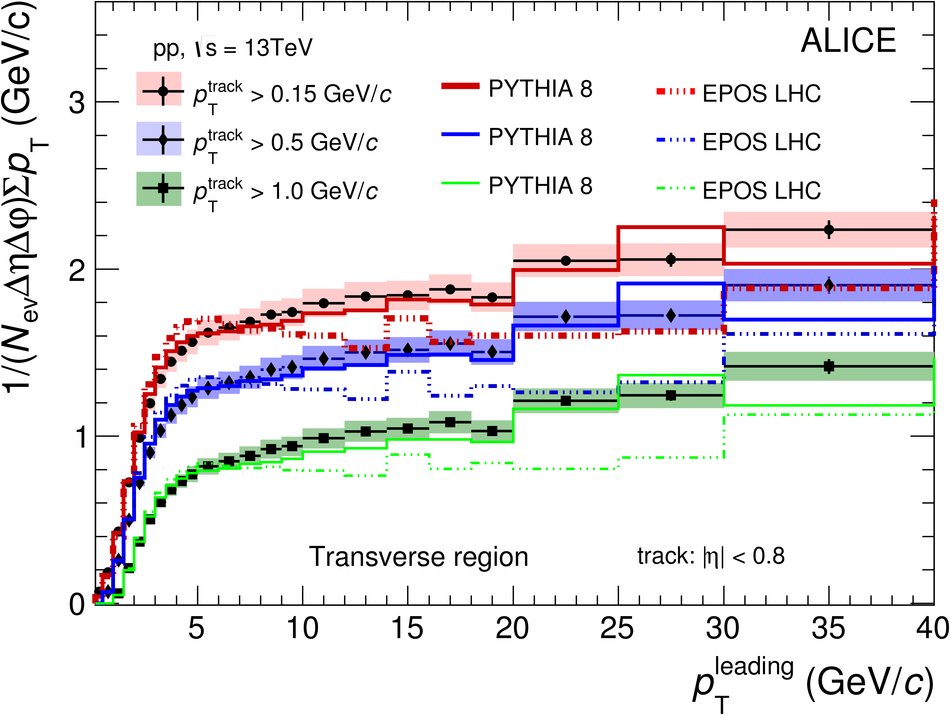
Number density Nch (left) and ∑ pT (right) distributions as a function of pTleading along with the MC simulations in Transverse region for three transverse momentum thresholds of pTtrack > 0.15, 0.5, and 1.0 GeV/c. The shaded areas represent the systematic uncertainties and vertical error bars indicate statistical uncertainties for the data. No uncertainties are shown for the MC simulations.

Figure 6

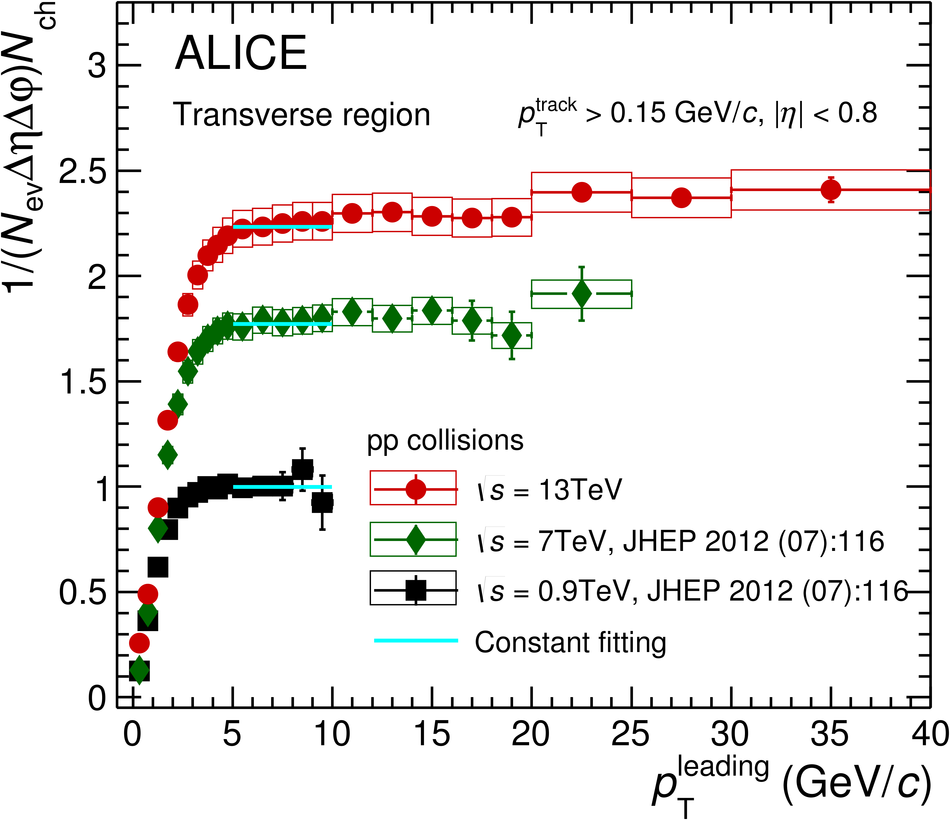
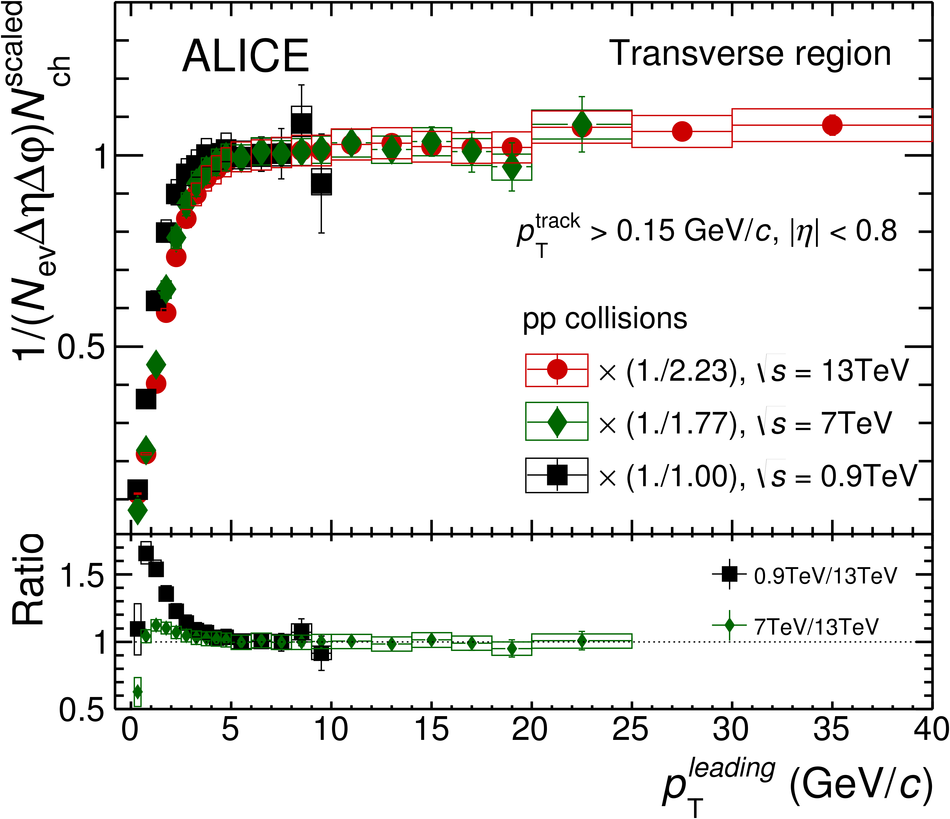
Figure 6: Left: Number density Nch in the Transverse region as a function of pTleading (pTtrack > 0.15 GeV/c threshold) for √s = 0.9, 7 and 13 TeV. A constant function is used to fit the data in the range 5 < pTleading < 10 GeV/c and the results are shown as solid lines. Right: Number densities Nch scaled by the pedestal values obtained from the fit in order to compare the shapes. The open boxes represent the systematic uncertainties and vertical error bars indicate statistical uncertainties.

Figure 7

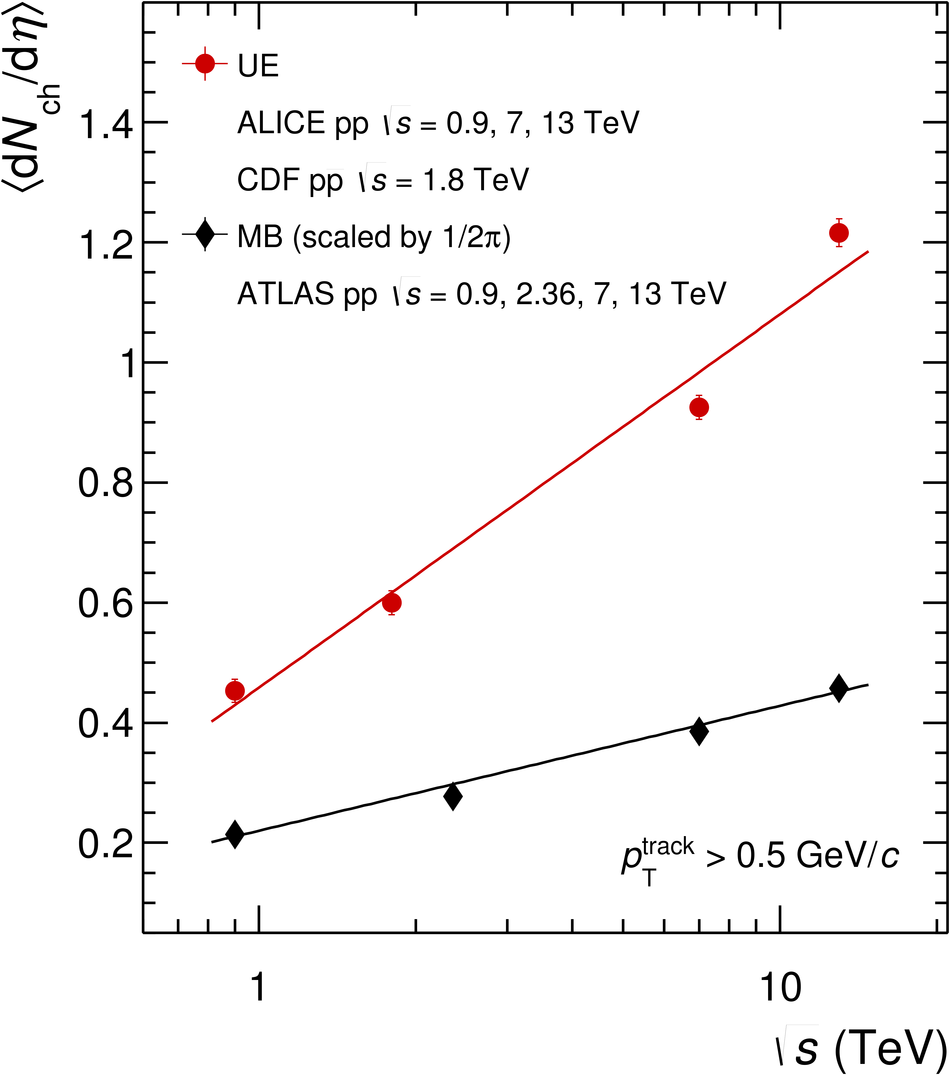
Figure 7: Comparison of number density in the plateau of the Transverse region with lower energy data taken from [5, 11] and dNch/dη in minimum-bias events (scaled by 1/2π) [53]. Both are for charged-particles with pT > 0.5 GeV/c. Error bars represent statistical and systematic uncertainties summed in quadrature. The straight lines show the results of fitting data points with the functional form a +blns.

Figure 8

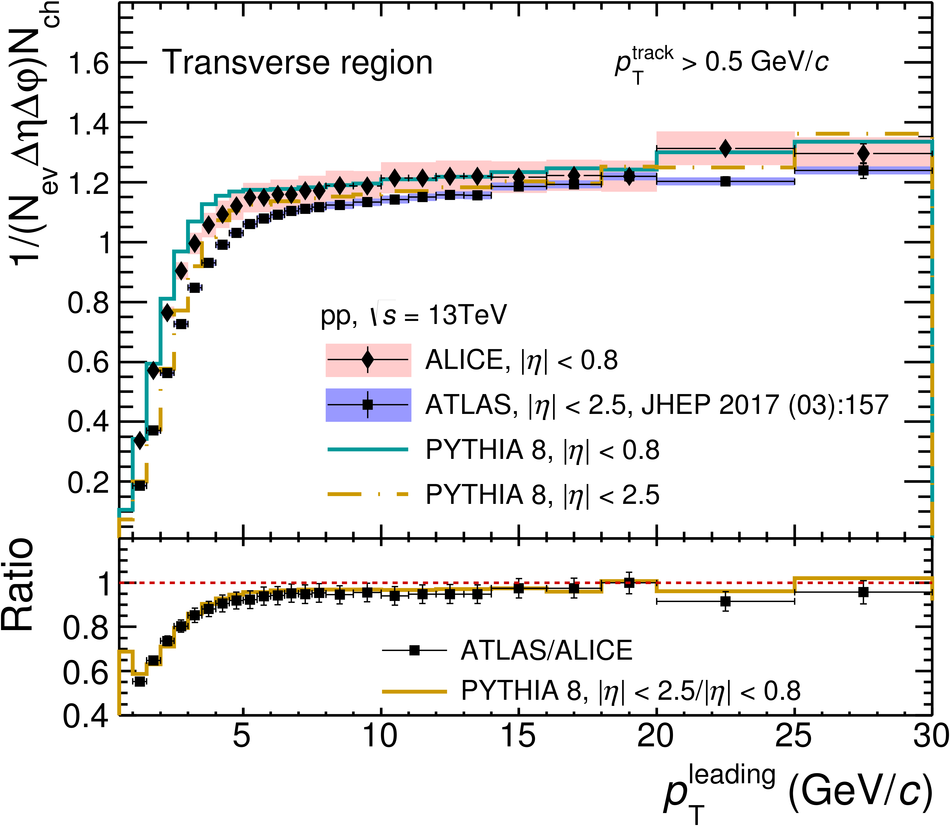
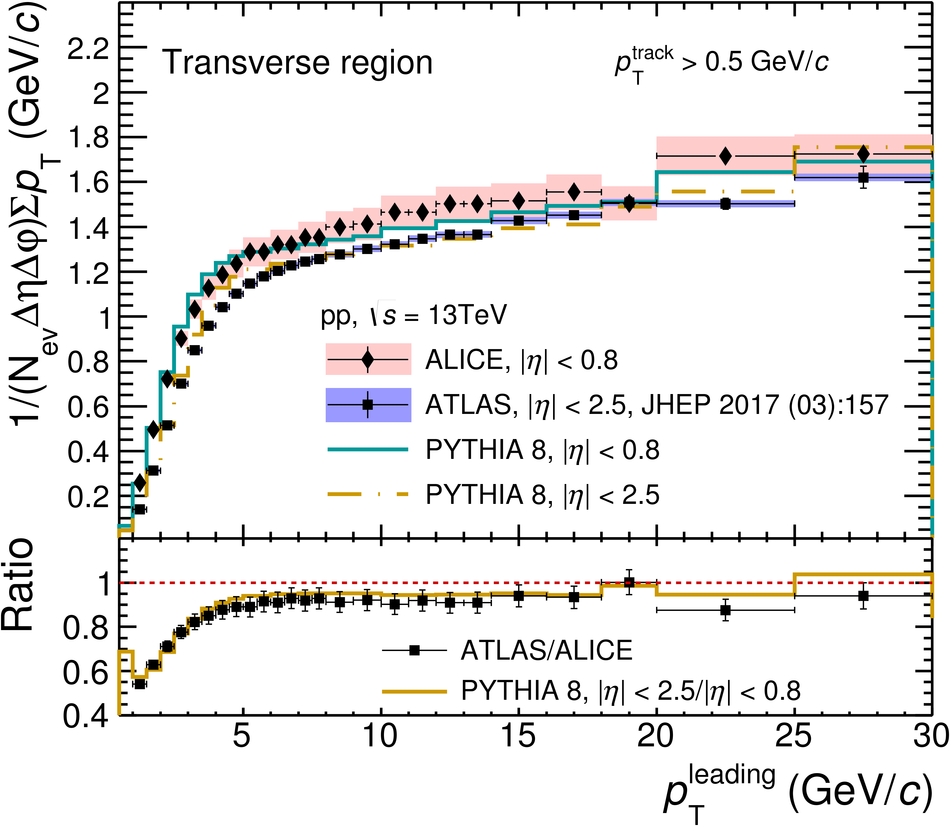
Number density Nch (left) and ∑ pT density (right) in the Transverse region for pTtrack > 0.5 GeV/c at √s = 13 TeV from ALICE (|η| < 0.8) and ATLAS (|η| < 2.5) measurements [13]. The results are compared to PYTHIA 8 Monash-2013 calculations. The shaded areas represent the systematic uncertainties and vertical error bars indicate statistical uncertainties for the data. No uncertainties are shown for the MC simulations.

Figure 9

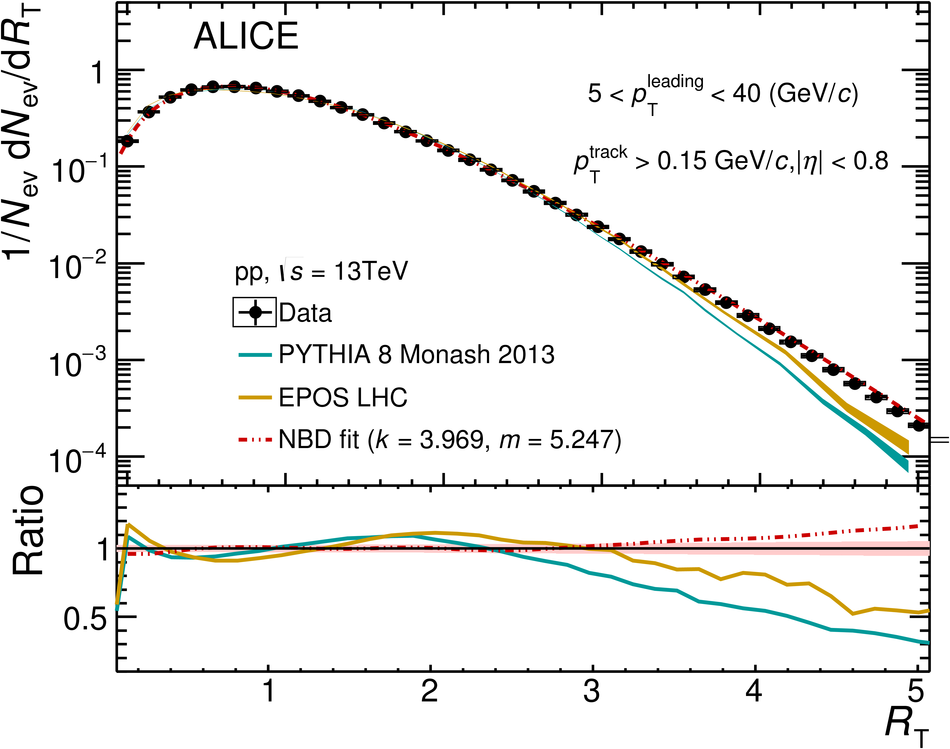
RT probability distribution in the Transverse region for pTtrack > 0.15 GeV/c and |η| < 0.8. The result (solid circles) is compared to the PYTHIA 8 and EPOS LHC calculations (lines). The red line represents the result of the NBD fit, where the multiplicity is scaled by its mean value, m. The parameter k is related to the standard deviation of the distribution via σ = qm1 + 1k . The open boxes represent the systematic uncertainties and vertical error bars indicate statistical uncertainties for the data. The bands indicate the statistical uncertainties of the MC simulations. The bottom panel shows the ratio between the NBD fit, as well as those of the MC to the data.

Figure 10

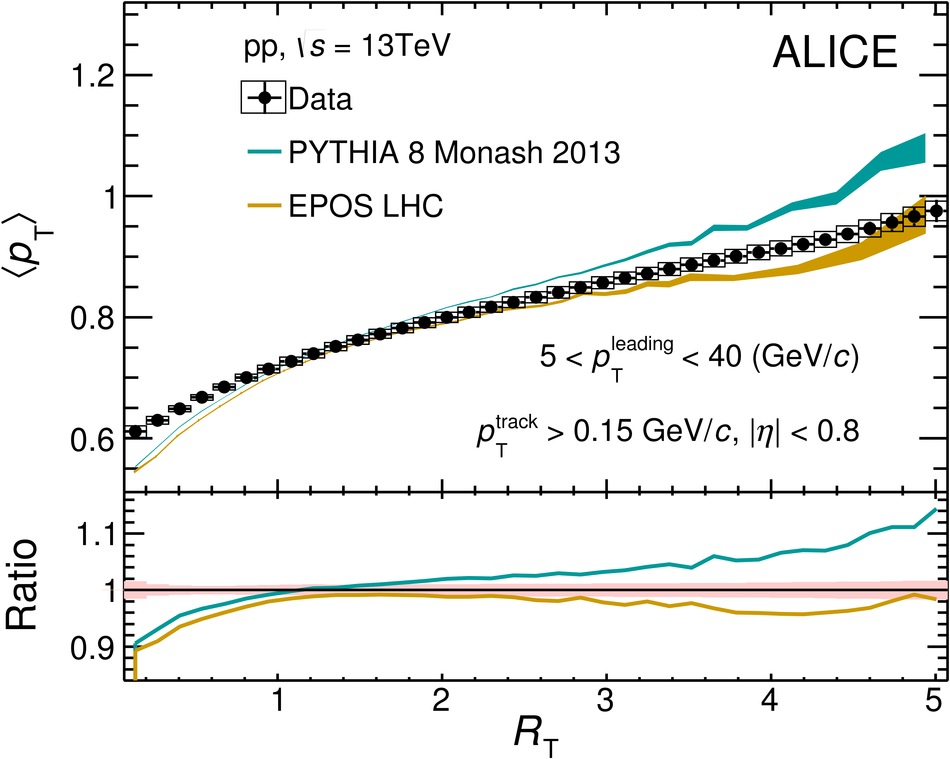
hpTi in the Transverse region as a function of RT for pTtrack > 0.15 GeV/c and |η| < 0.8. Data (solid circles) are compared to the results of PYTHIA 8 and EPOS LHC calculations (lines). The open boxes represent the systematic uncertainties and vertical error bars indicate statistical uncertainties for the data. The bands indicate the statistical uncertainties of the MC simulations. The bottom panel shows the ratio of the MC to data.

Figure 11

$\avpt$ in the Transverse region as a function of \Rt\ for $\ptmin > 0.15 \; \gmom $ and $|\eta | < 0.8$. Data (solid circles) are compared to the results of \textsc{Pythia} 8 and \textsc{Epos} LHC calculations (lines). The open boxes represent the systematic uncertainties and vertical error bars indicate statistical uncertainties for the data. The bands indicate the statistical uncertainties of the MC simulations. The bottom panel shows the ratio of the MC to data.

Figure 12

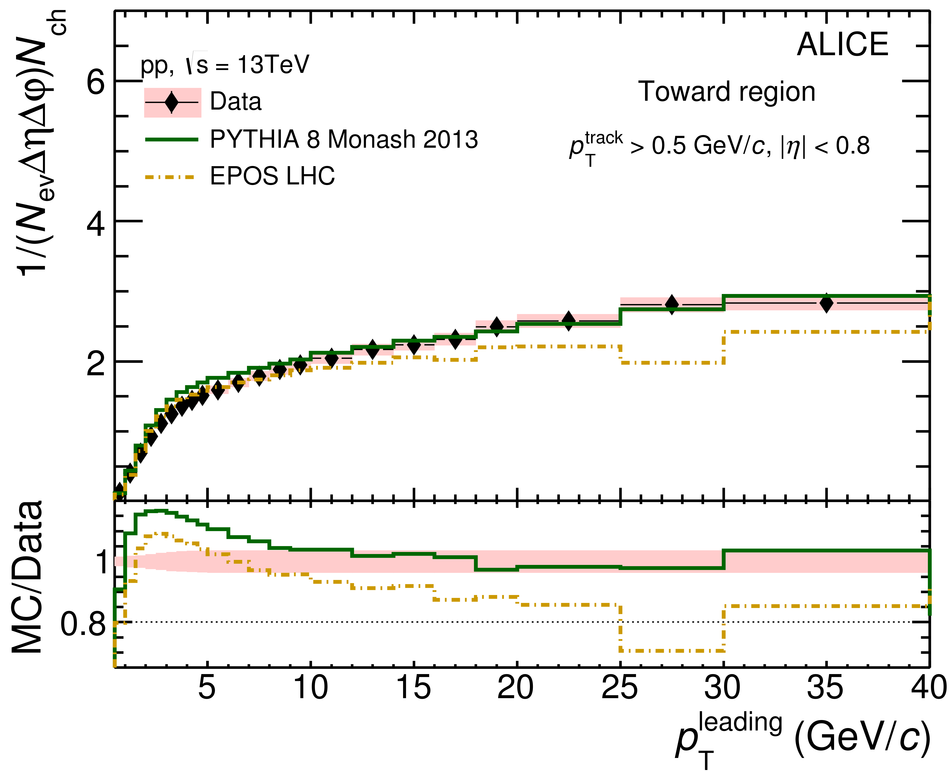
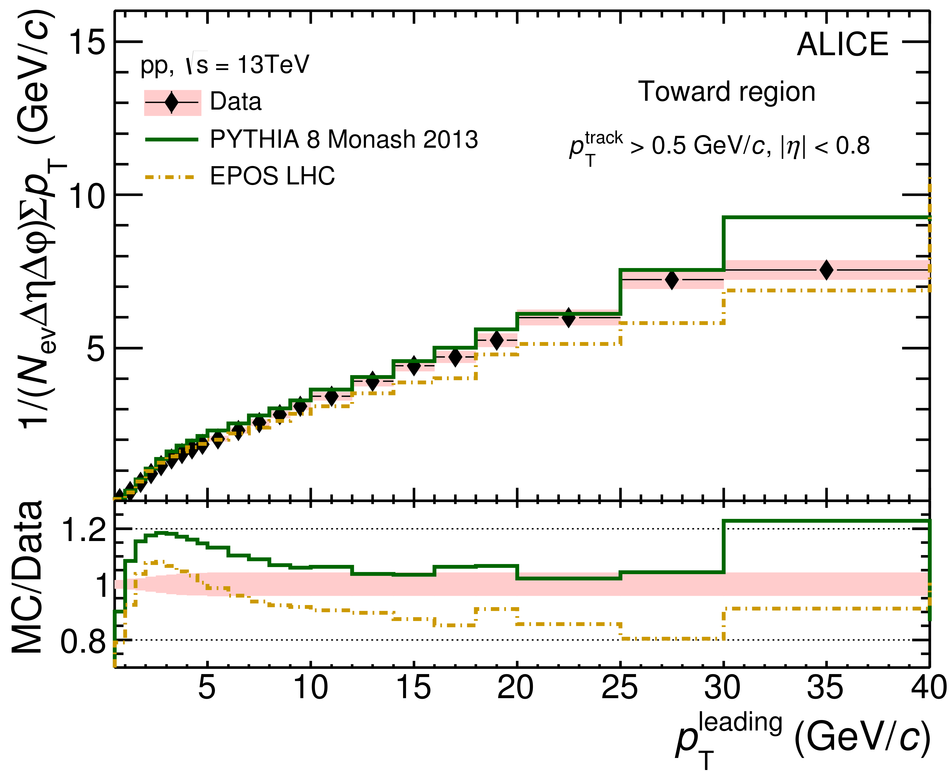
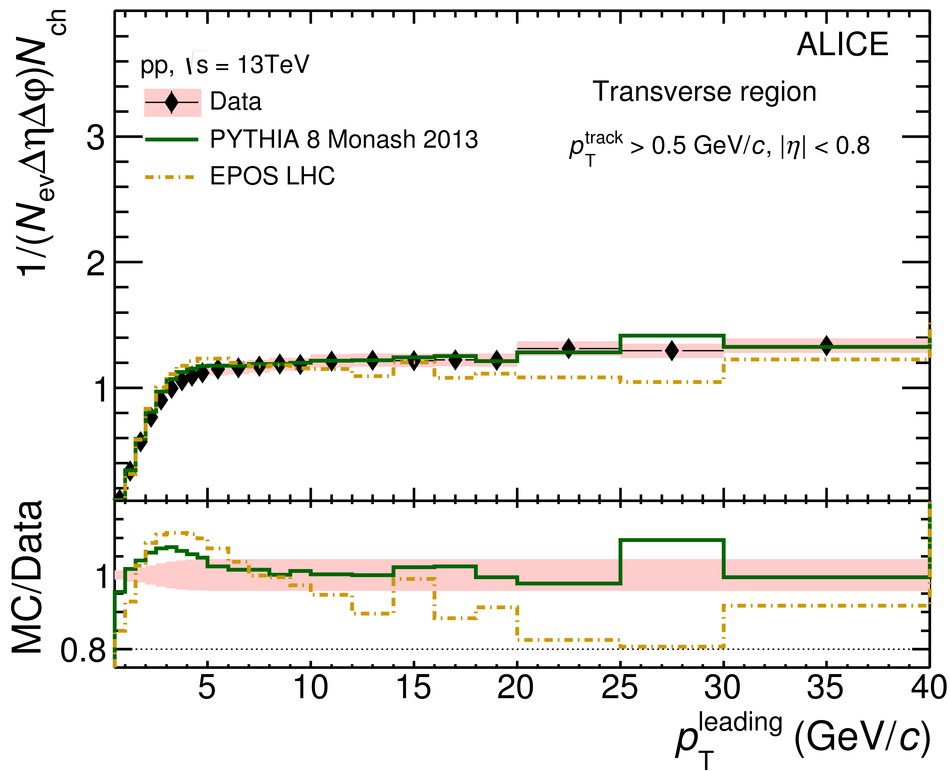
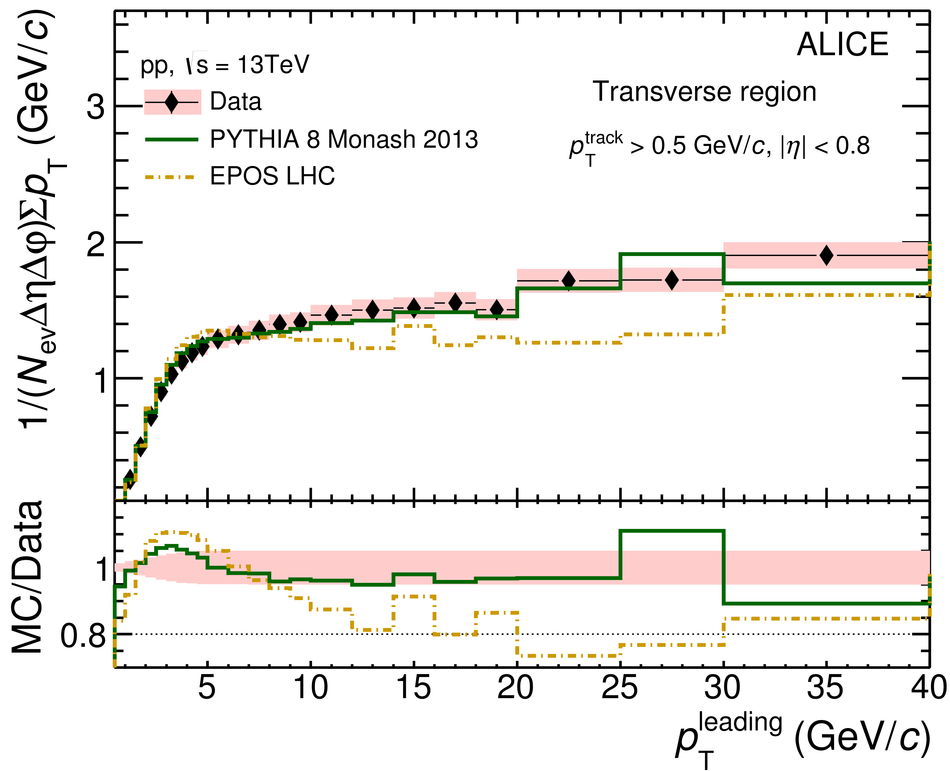
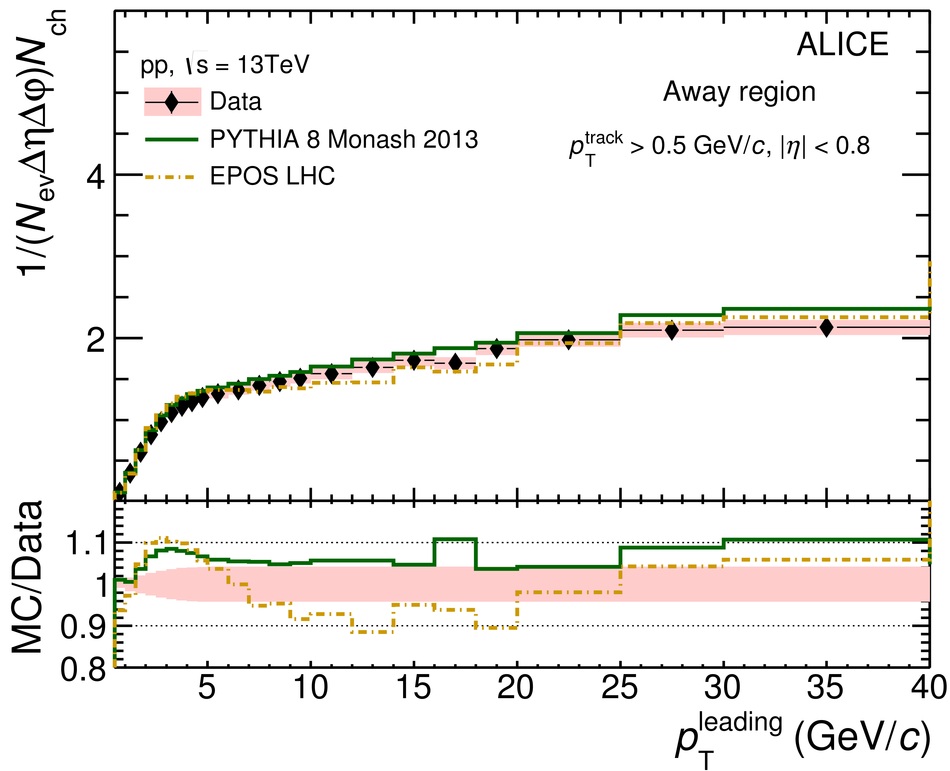
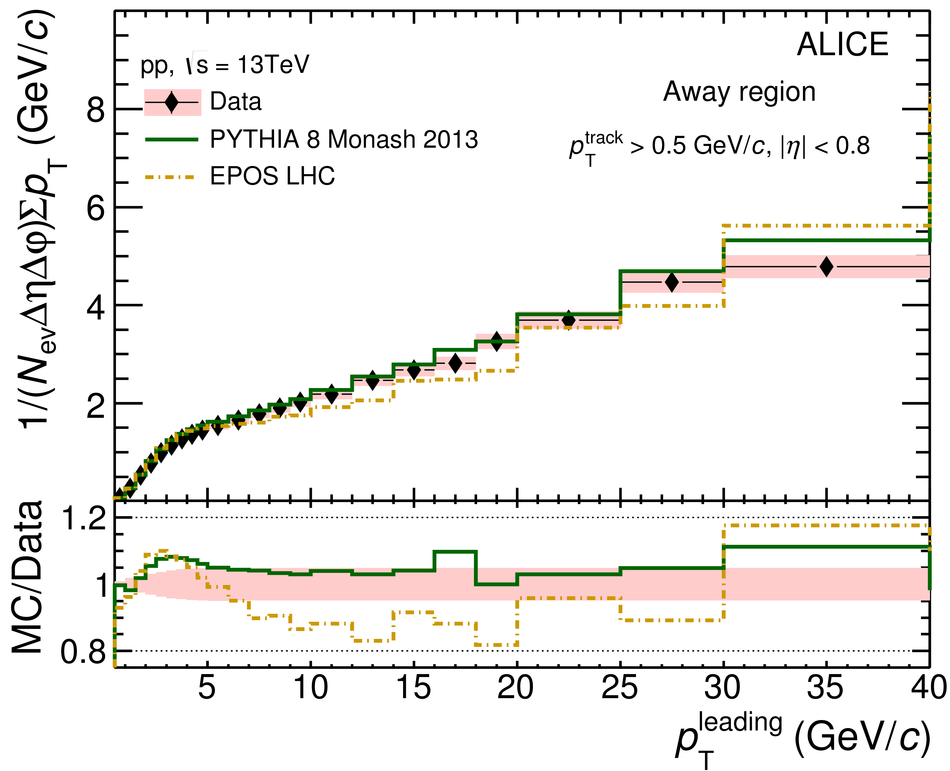
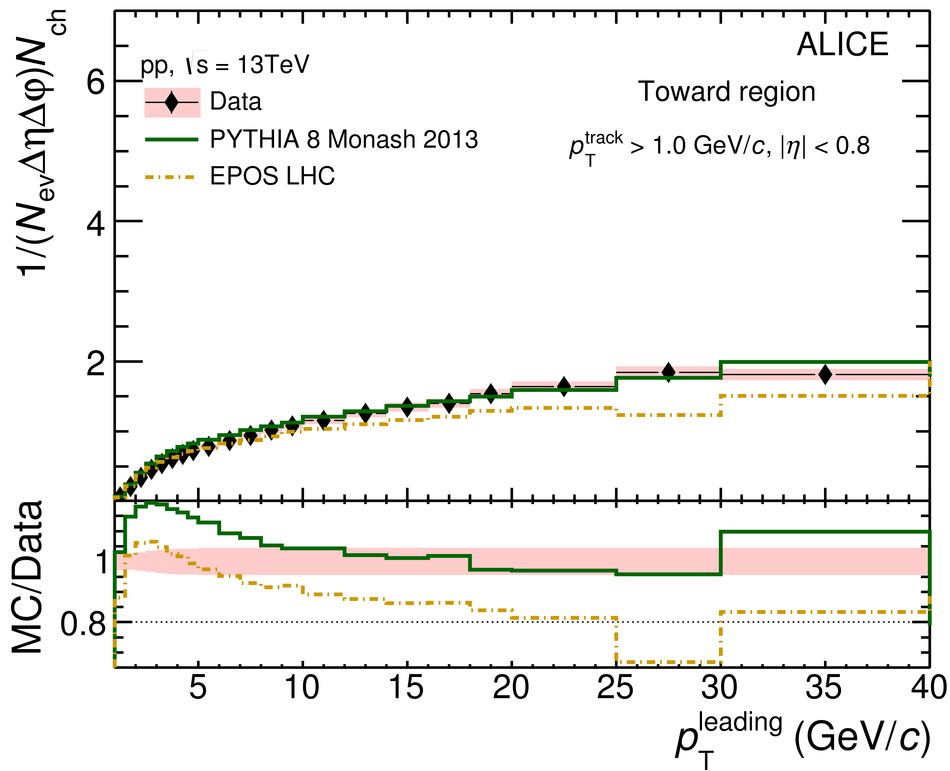
Number density $\Nch$ (left) and $\sum \pt$ (right) distributions as a function of \ptlead\, compared to MC predictions in Toward (top), Transverse (middle), and Away (bottom) regions for $\ptmin > 0.5\; \gmom $. The shaded areas in the upper panels represent the systematic uncertainties and vertical error bars indicate statistical uncertainties. In the lower panels, the shaded areas are the sum in quadrature of statistical and systematic uncertainties from the upper panels . No uncertainties are given for the MC calculations.