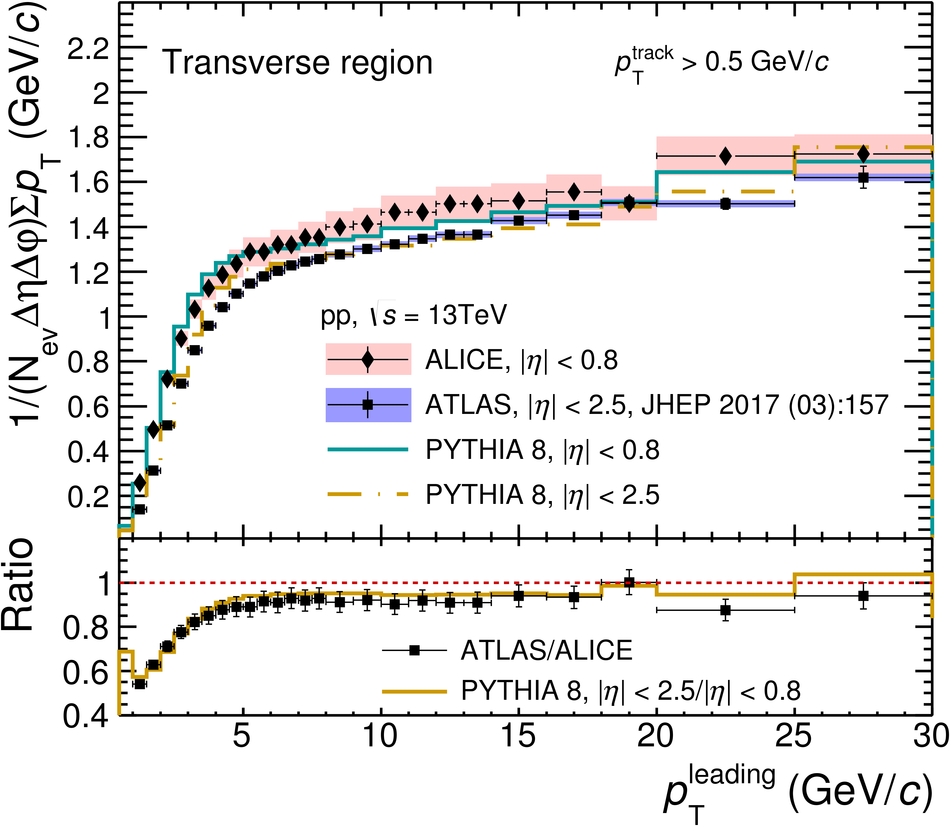
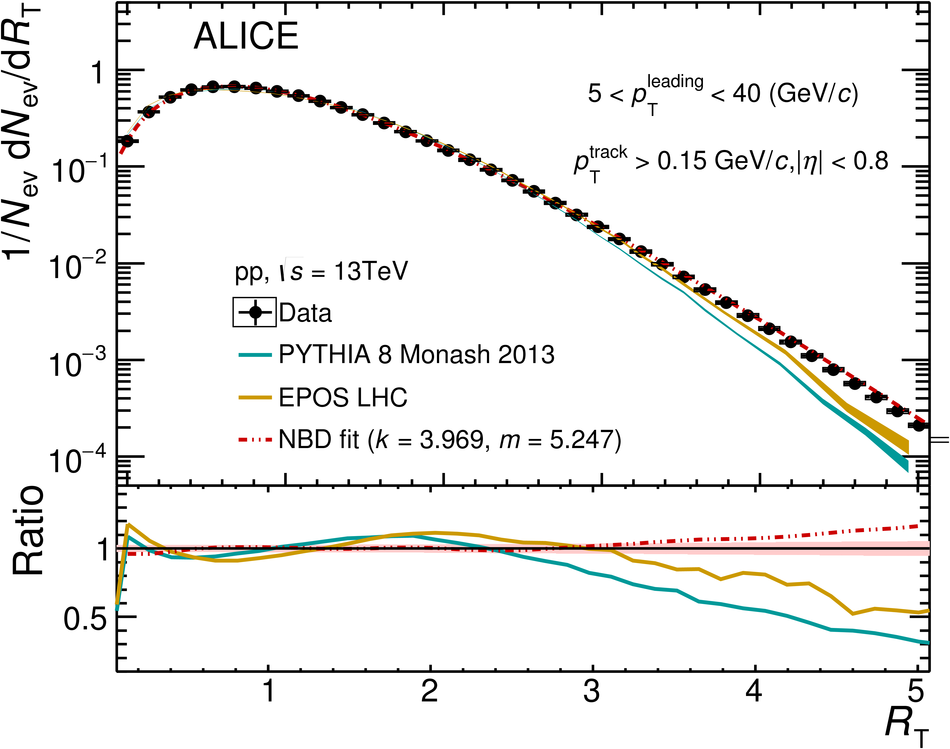
RT probability distribution in the Transverse region for pTtrack > 0.15 GeV/c and |η| < 0.8. The result (solid circles) is compared to the PYTHIA 8 and EPOS LHC calculations (lines). The red line represents the result of the NBD fit, where the multiplicity is scaled by its mean value, m. The parameter k is related to the standard deviation of the distribution via σ = qm1 + 1k . The open boxes represent the systematic uncertainties and vertical error bars indicate statistical uncertainties for the data. The bands indicate the statistical uncertainties of the MC simulations. The bottom panel shows the ratio between the NBD fit, as well as those of the MC to the data. |   |